This document outlines the design and implementation of a data warehouse focused on retail analytics, utilizing multiple data sources and the Kimball method for data warehouse architecture. It details the ETL process, the creation of dimension and fact tables, and the use of Power BI for business analysis through various case studies. The findings highlight seasonal and regional sales patterns, emphasizing strategies for improving sales in underperforming areas.
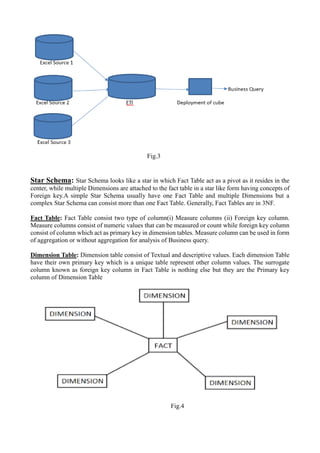
![Advantage of Star Schema: Star schema has various merit which prove its efficiency as well as its
specialty in building a Data warehouse.
• Easy to generate an ETL process
• Complexity is low as table query has direct relationship
• Decrease the headache of Normalizing, as data in dimension tables is stored in normal form
• It is very efficient to carry out metric analysis
• Each Dimension table is directly connected to Fact Table
• Navigation of Data is fast as of the nature of connection of fact and dimension table.
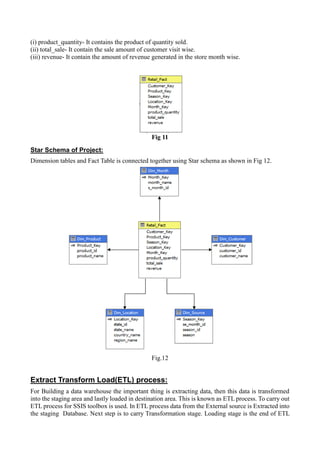
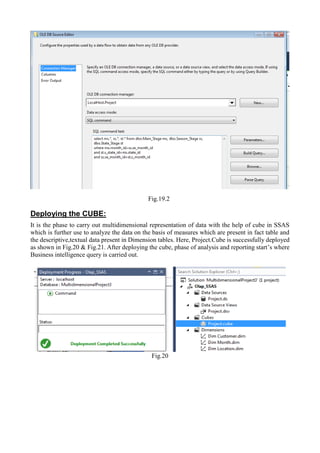
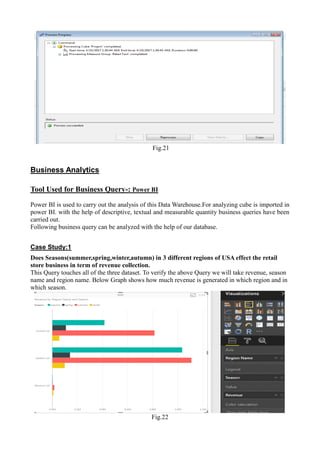
Design of Data Warehouse:
For this Retail Data warehouse five dimensions and one fact table have been created.
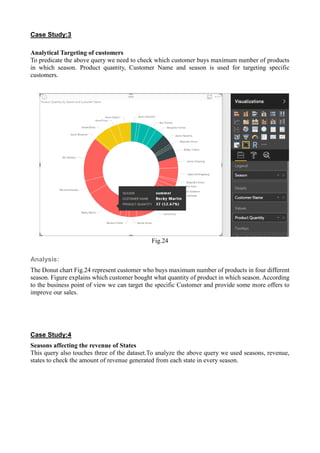
Dim_Customer:
Customer dimension consist of Customer name, Customer id, Customer key. Customer key is the
primary key in this dimension. It is generated when we I create the dimension by entering query
[Customer_Key] INT Identity (1,1)PK. Now the question is why I generated this, as I was already
having customer_id. As the primary key should be unique, none of the value should be repeated but
as the customer is repeated their id will also repeat and that won’t make the column unique,so to
remove this redundancy Customer_key as the primary key of this dimension is auto generated.
Customer_name contains the name of customer and customer_id column contain the id of customer.
With this dimension we can analyse which one is our regular customer.
Fig 5
Fig 6
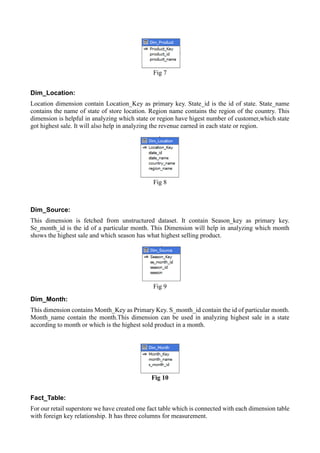
Dim_Product:
Product dimension has product_key as the primary key. Product_id contain id of the products.
Product_name contain the name of product sold.With the help of this dimension we can analyze which
is the highest selling product and which customer buys what product.](https://image.slidesharecdn.com/datawarehouseprojectonretailstore-180128222932/85/Data-warehouse-project-on-retail-store-7-320.jpg)