Download to read offline
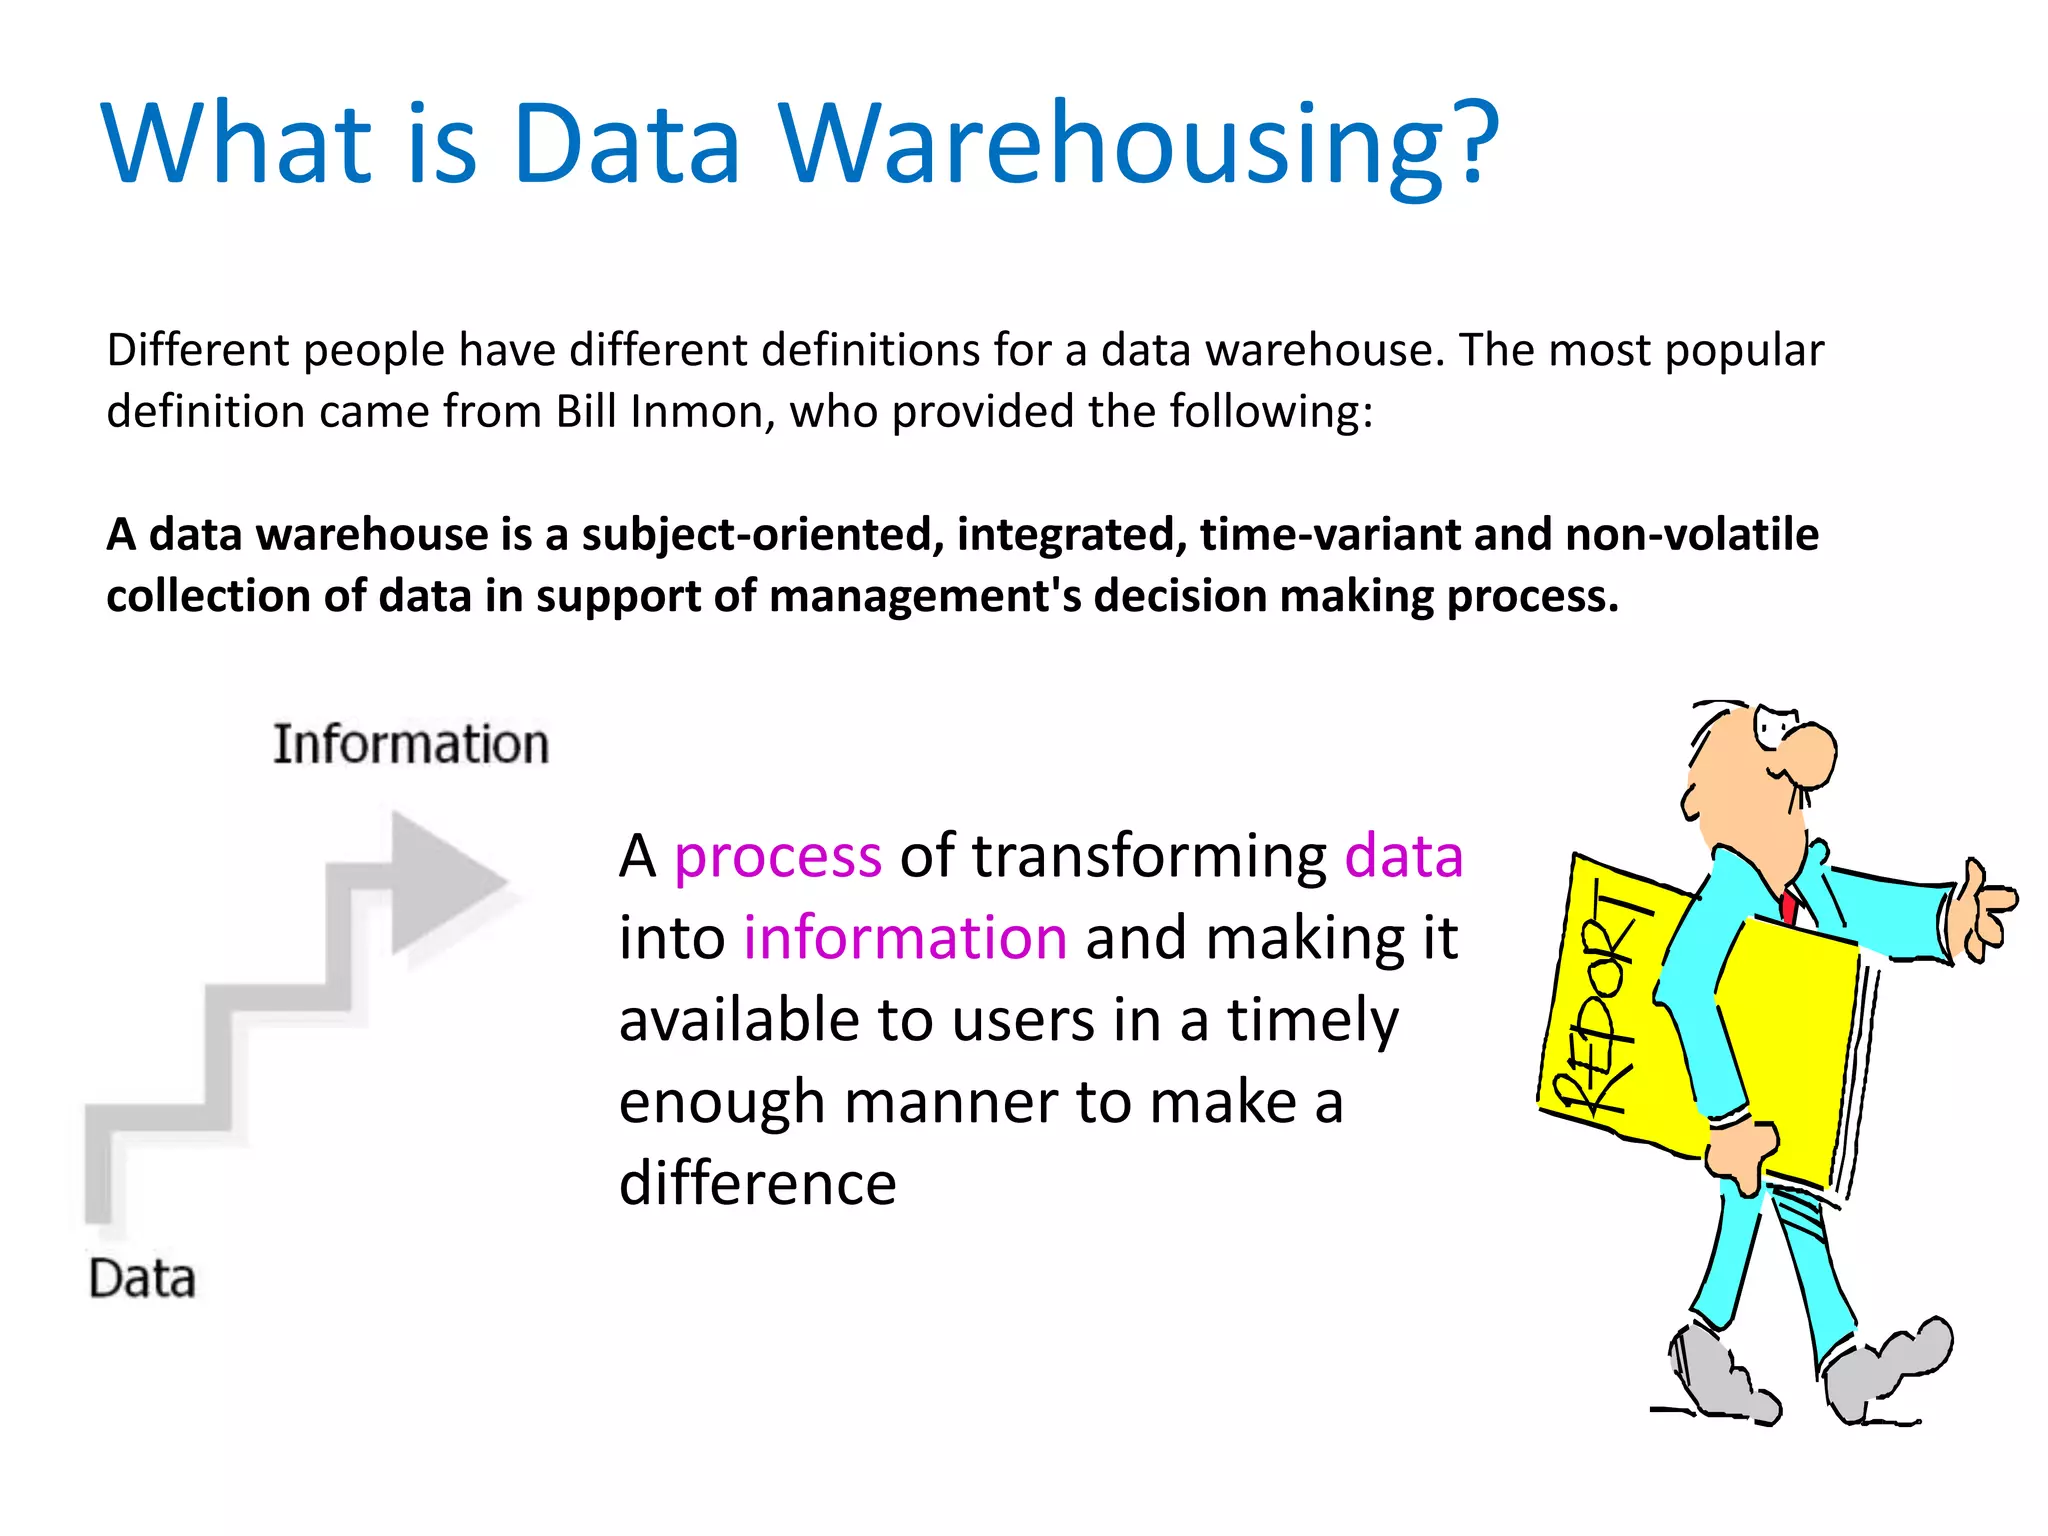
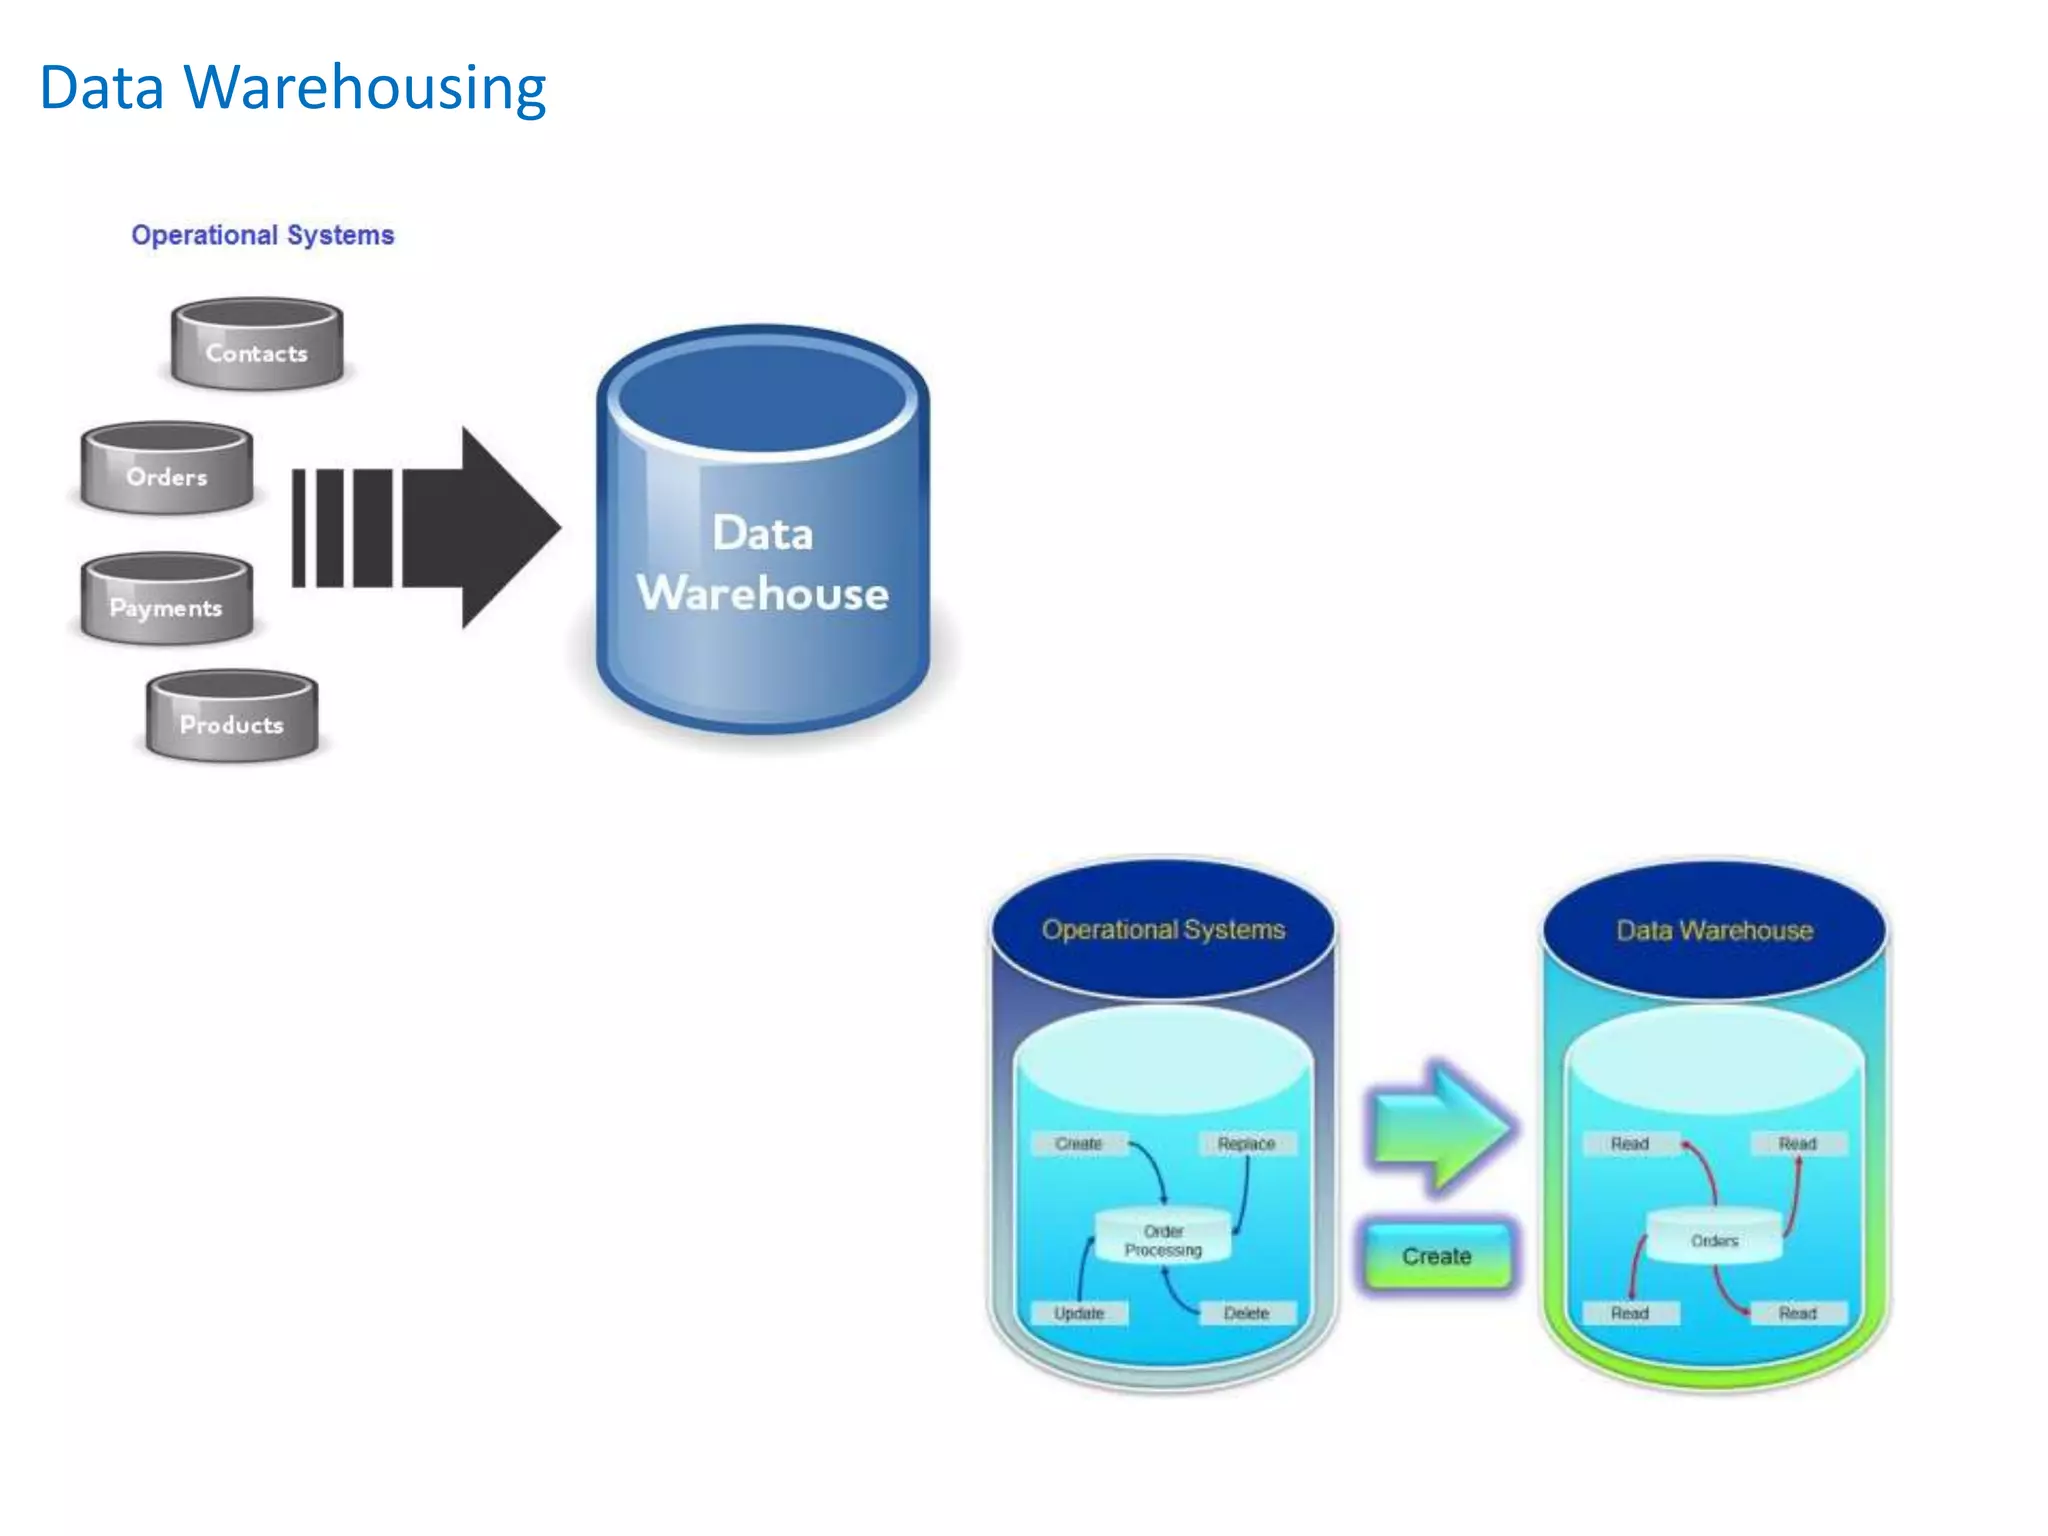
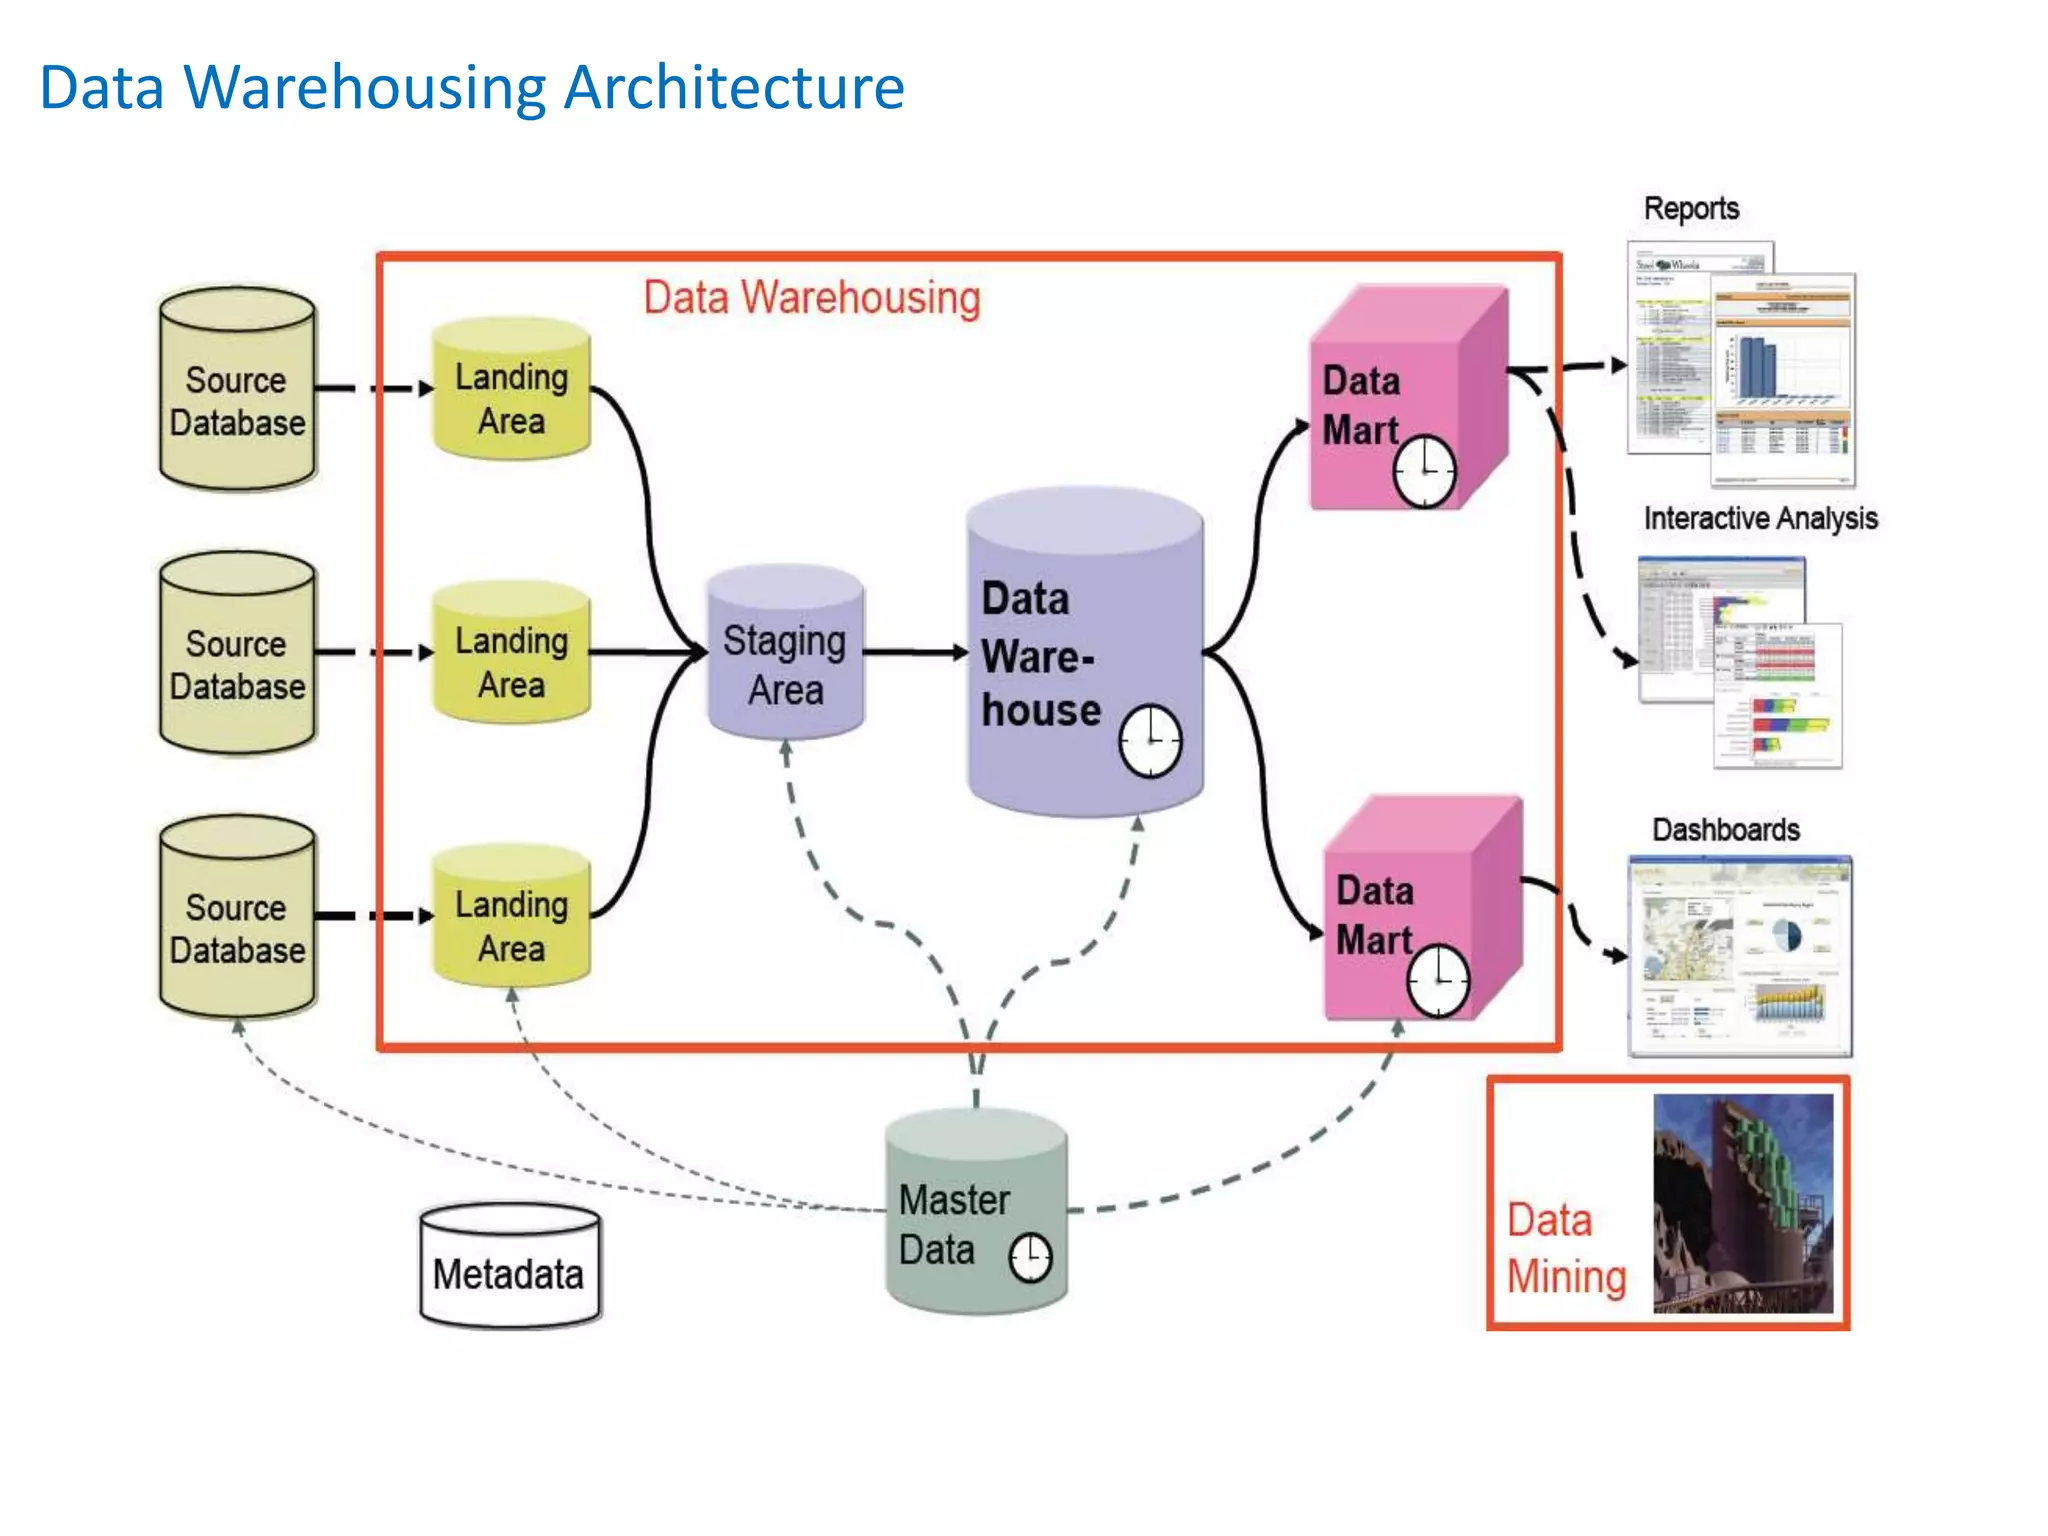
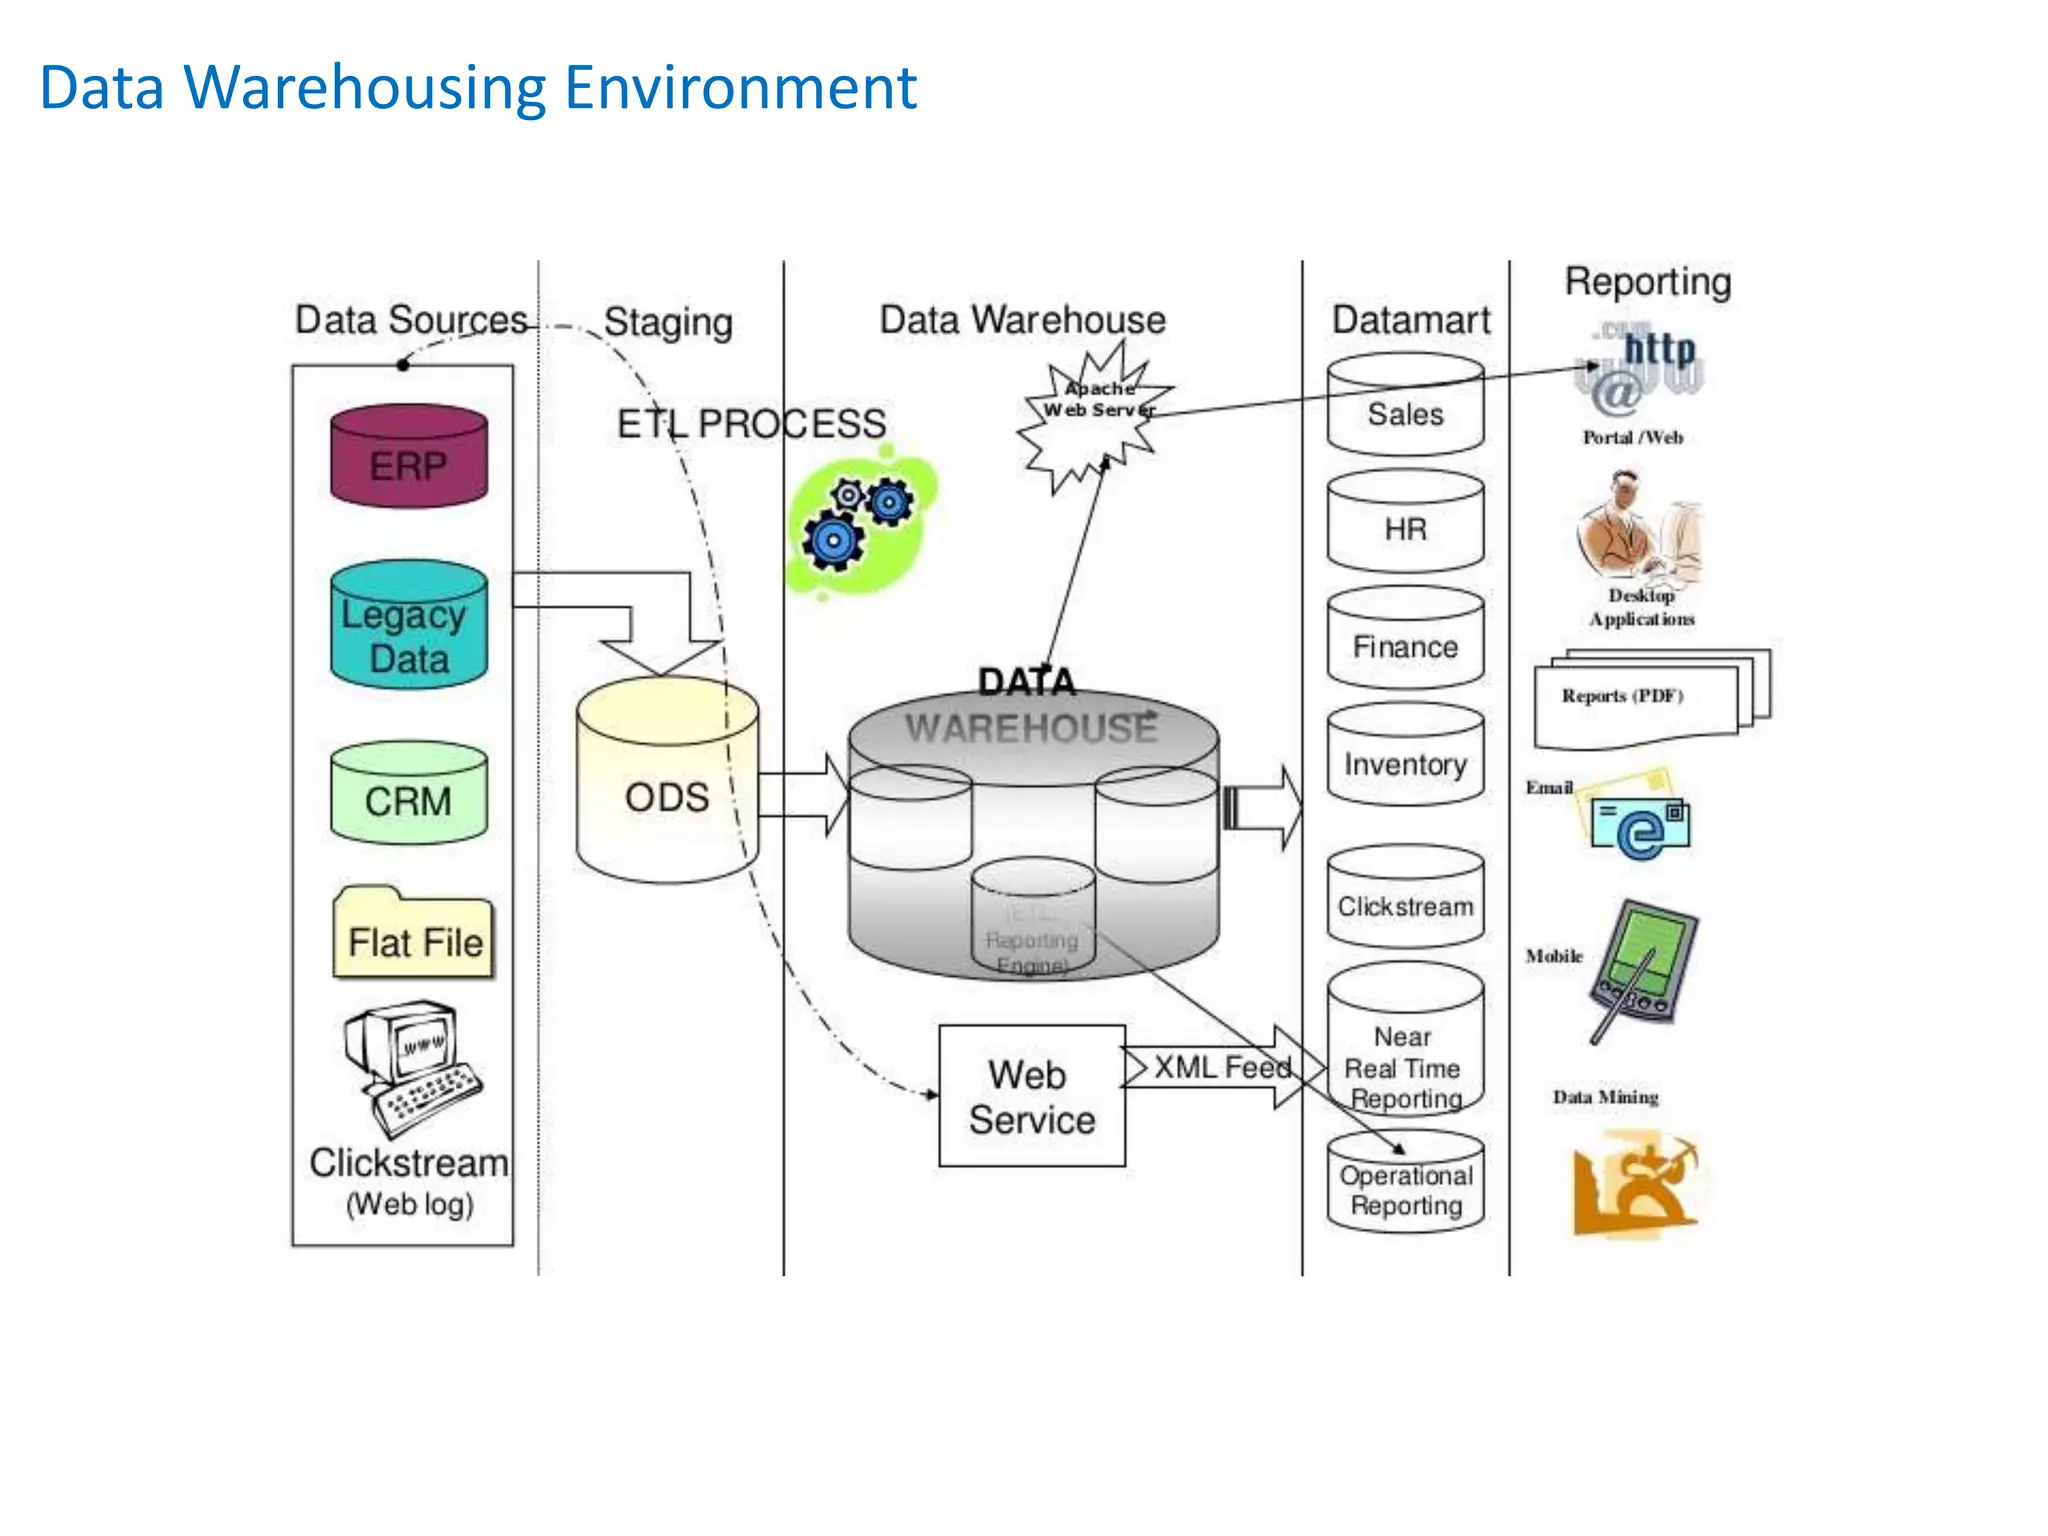
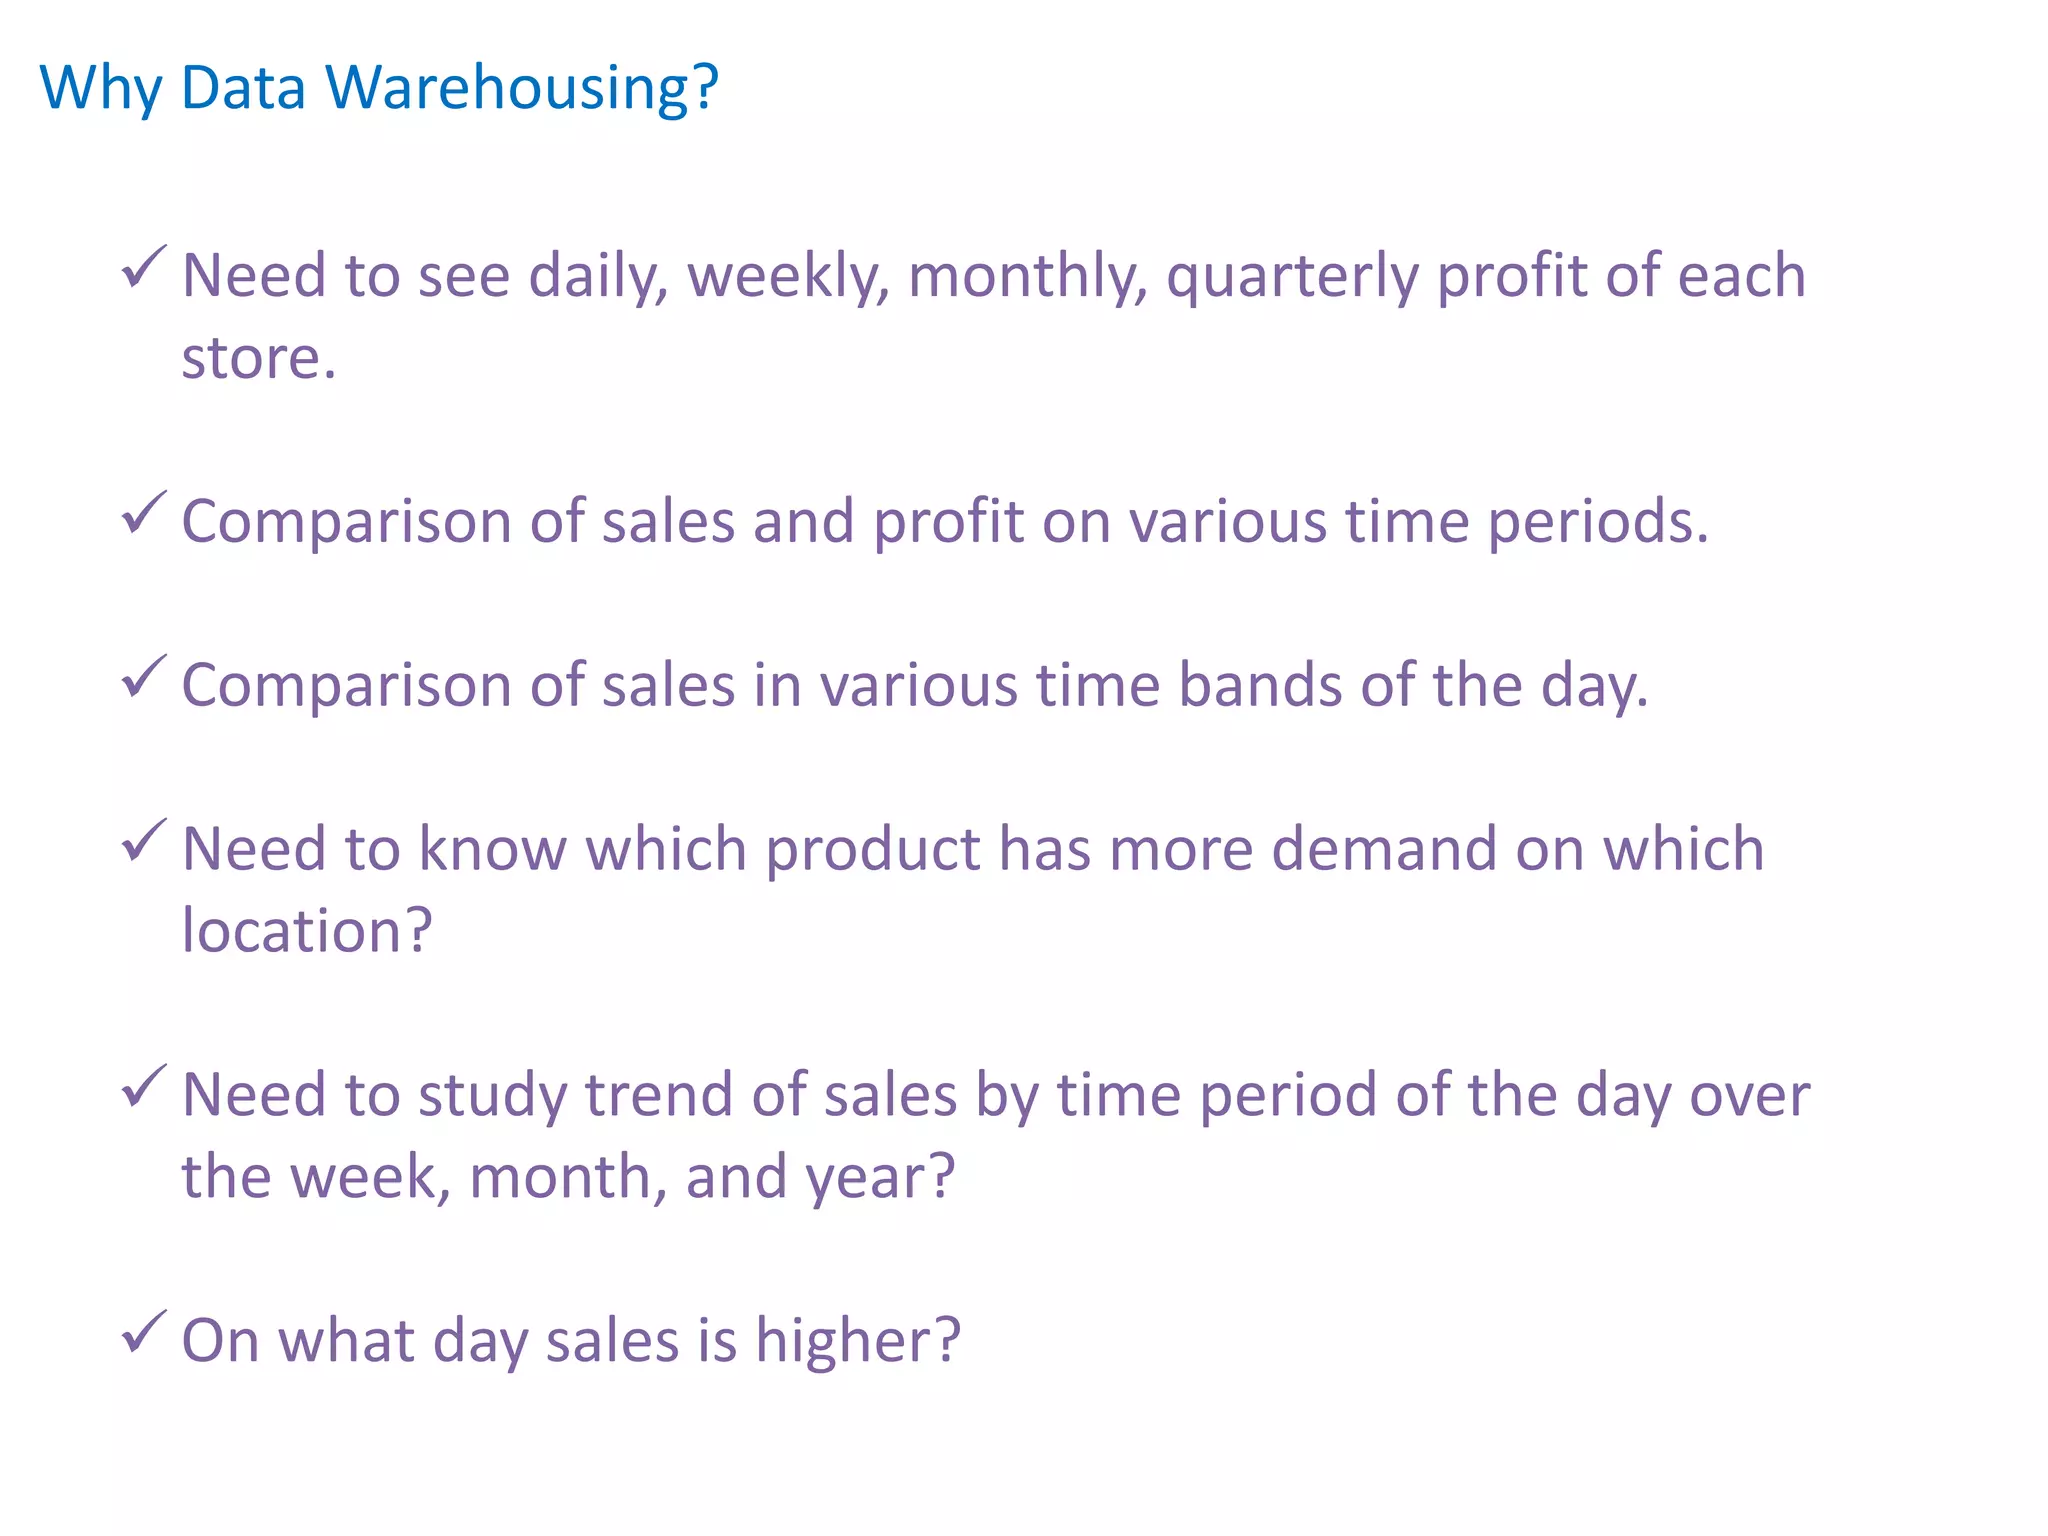
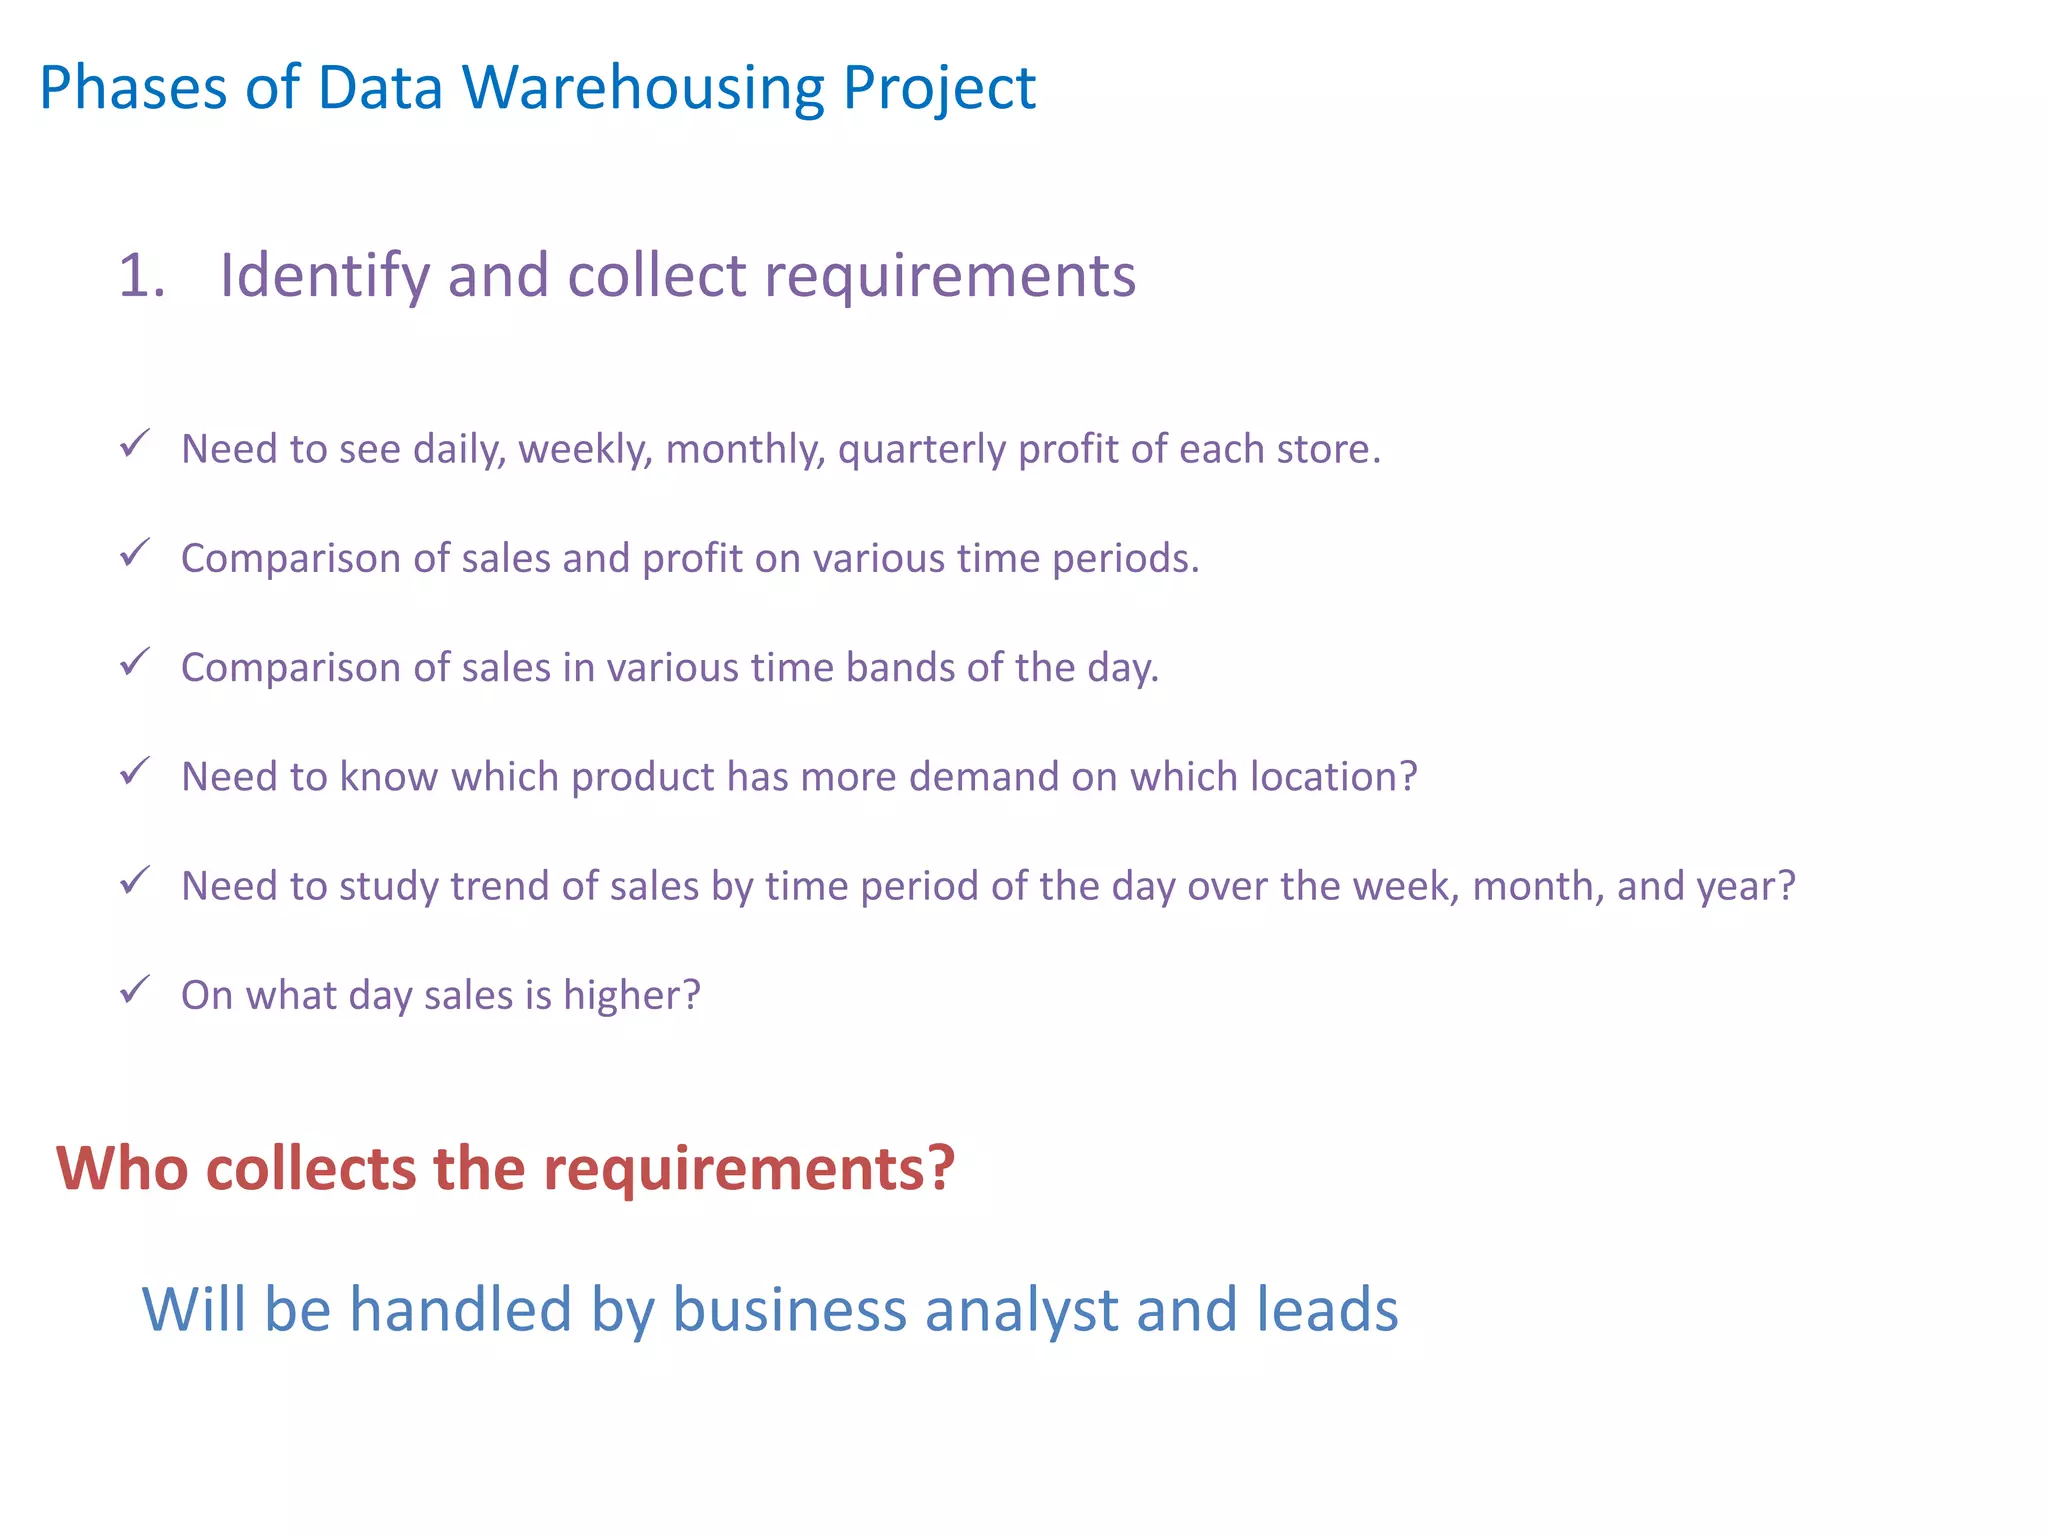
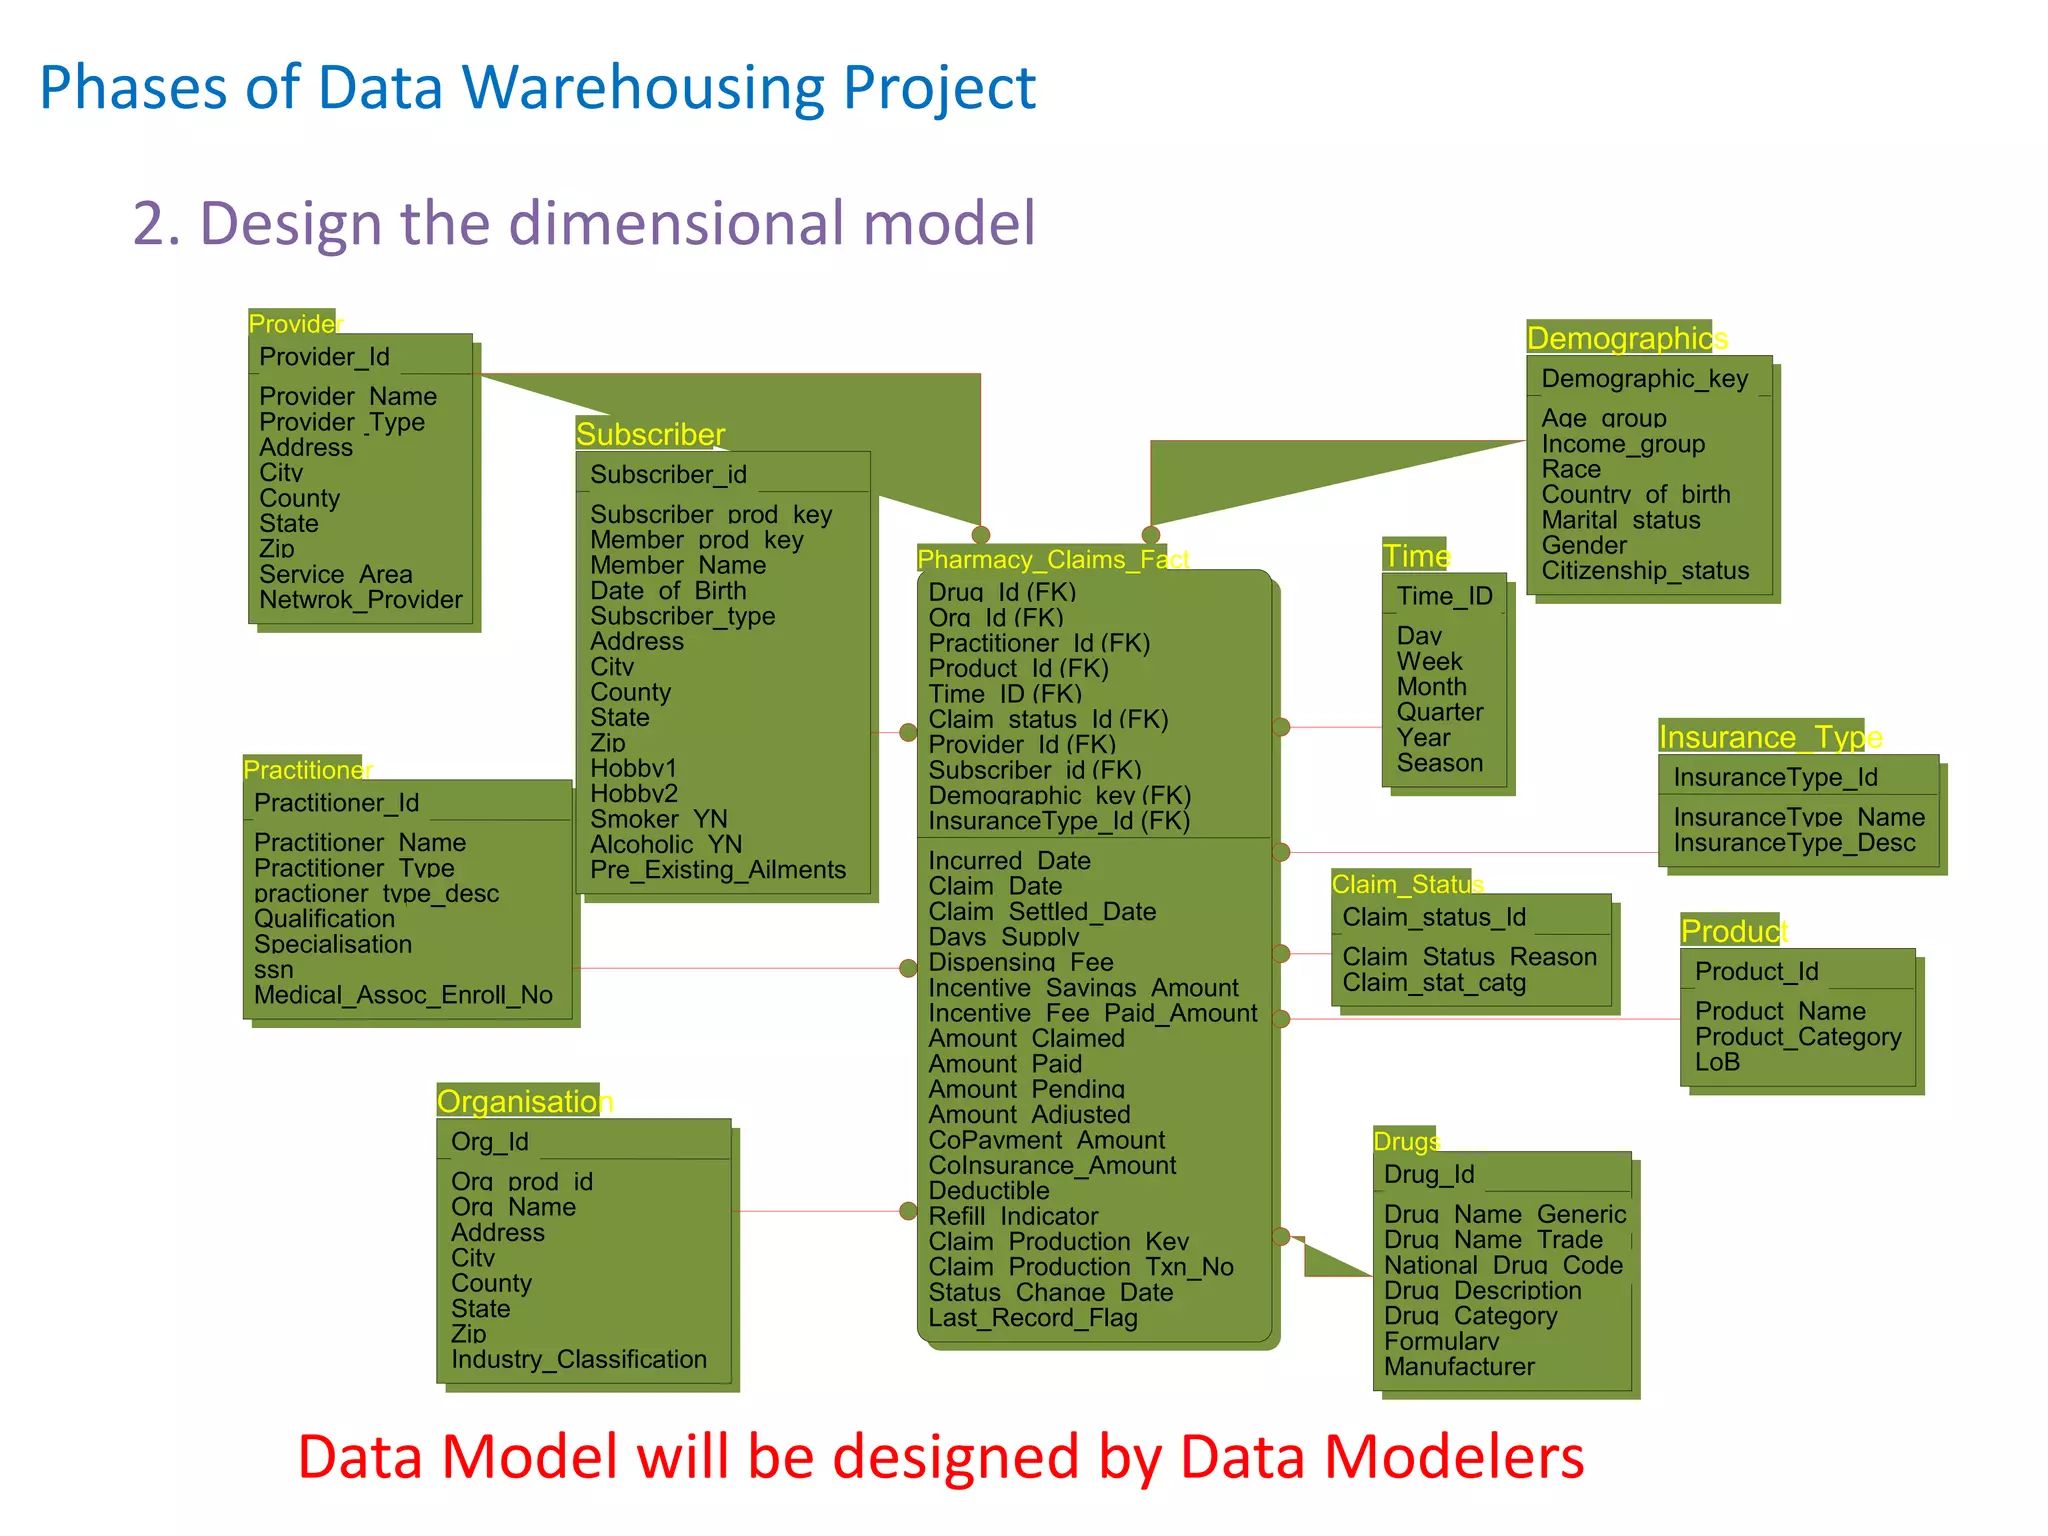
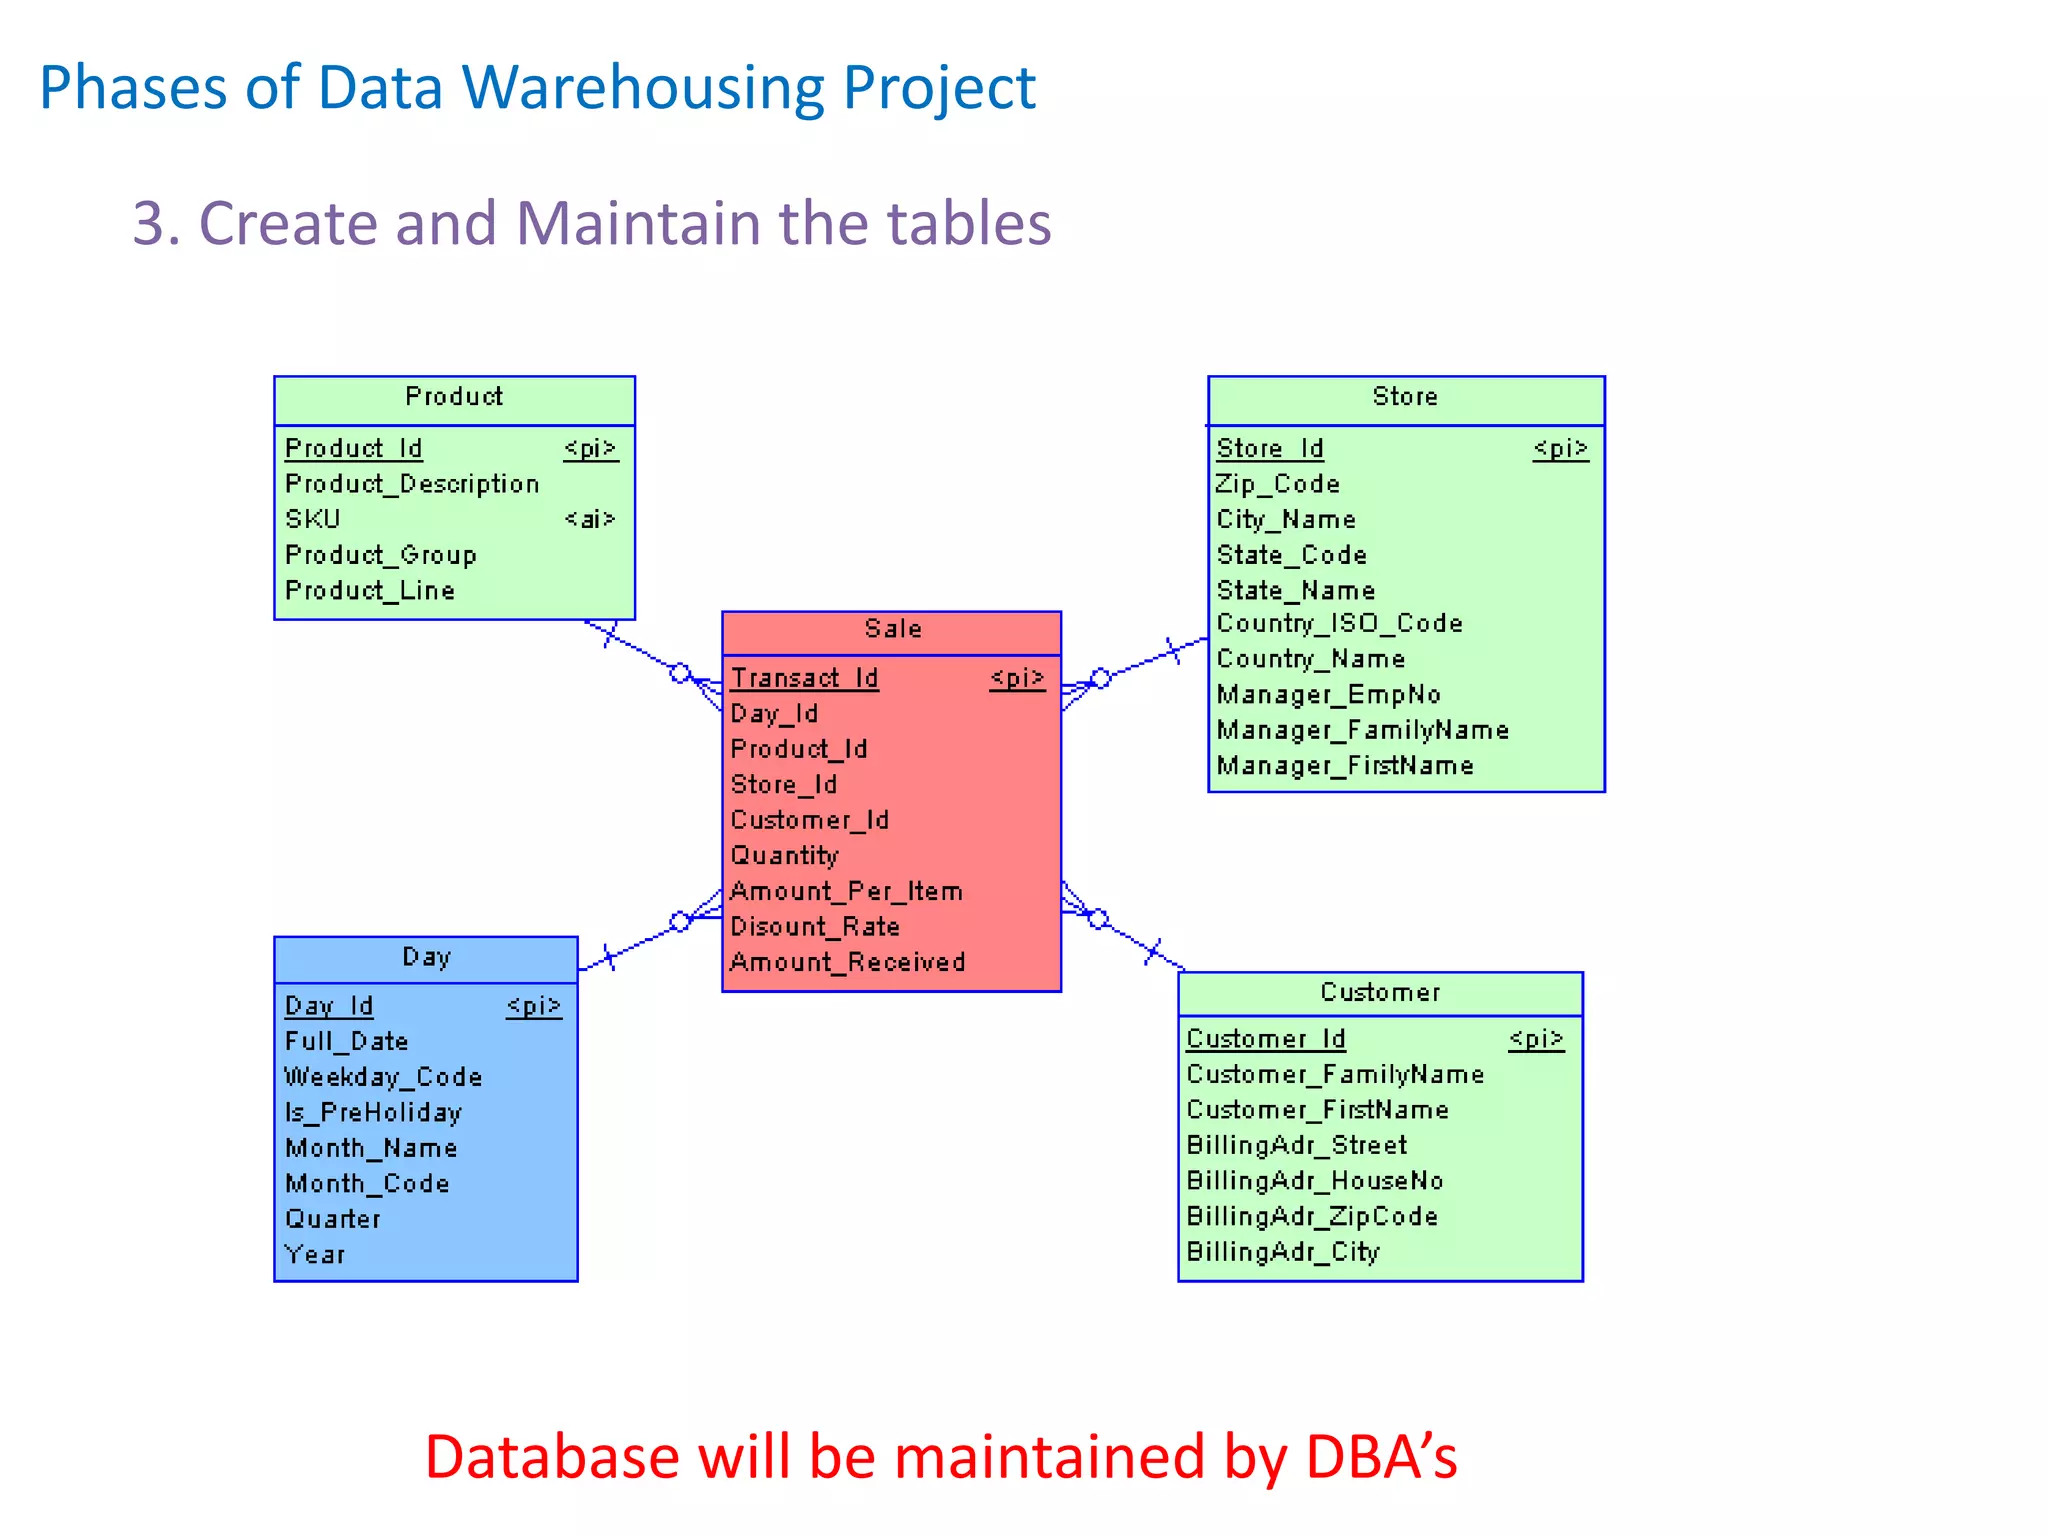
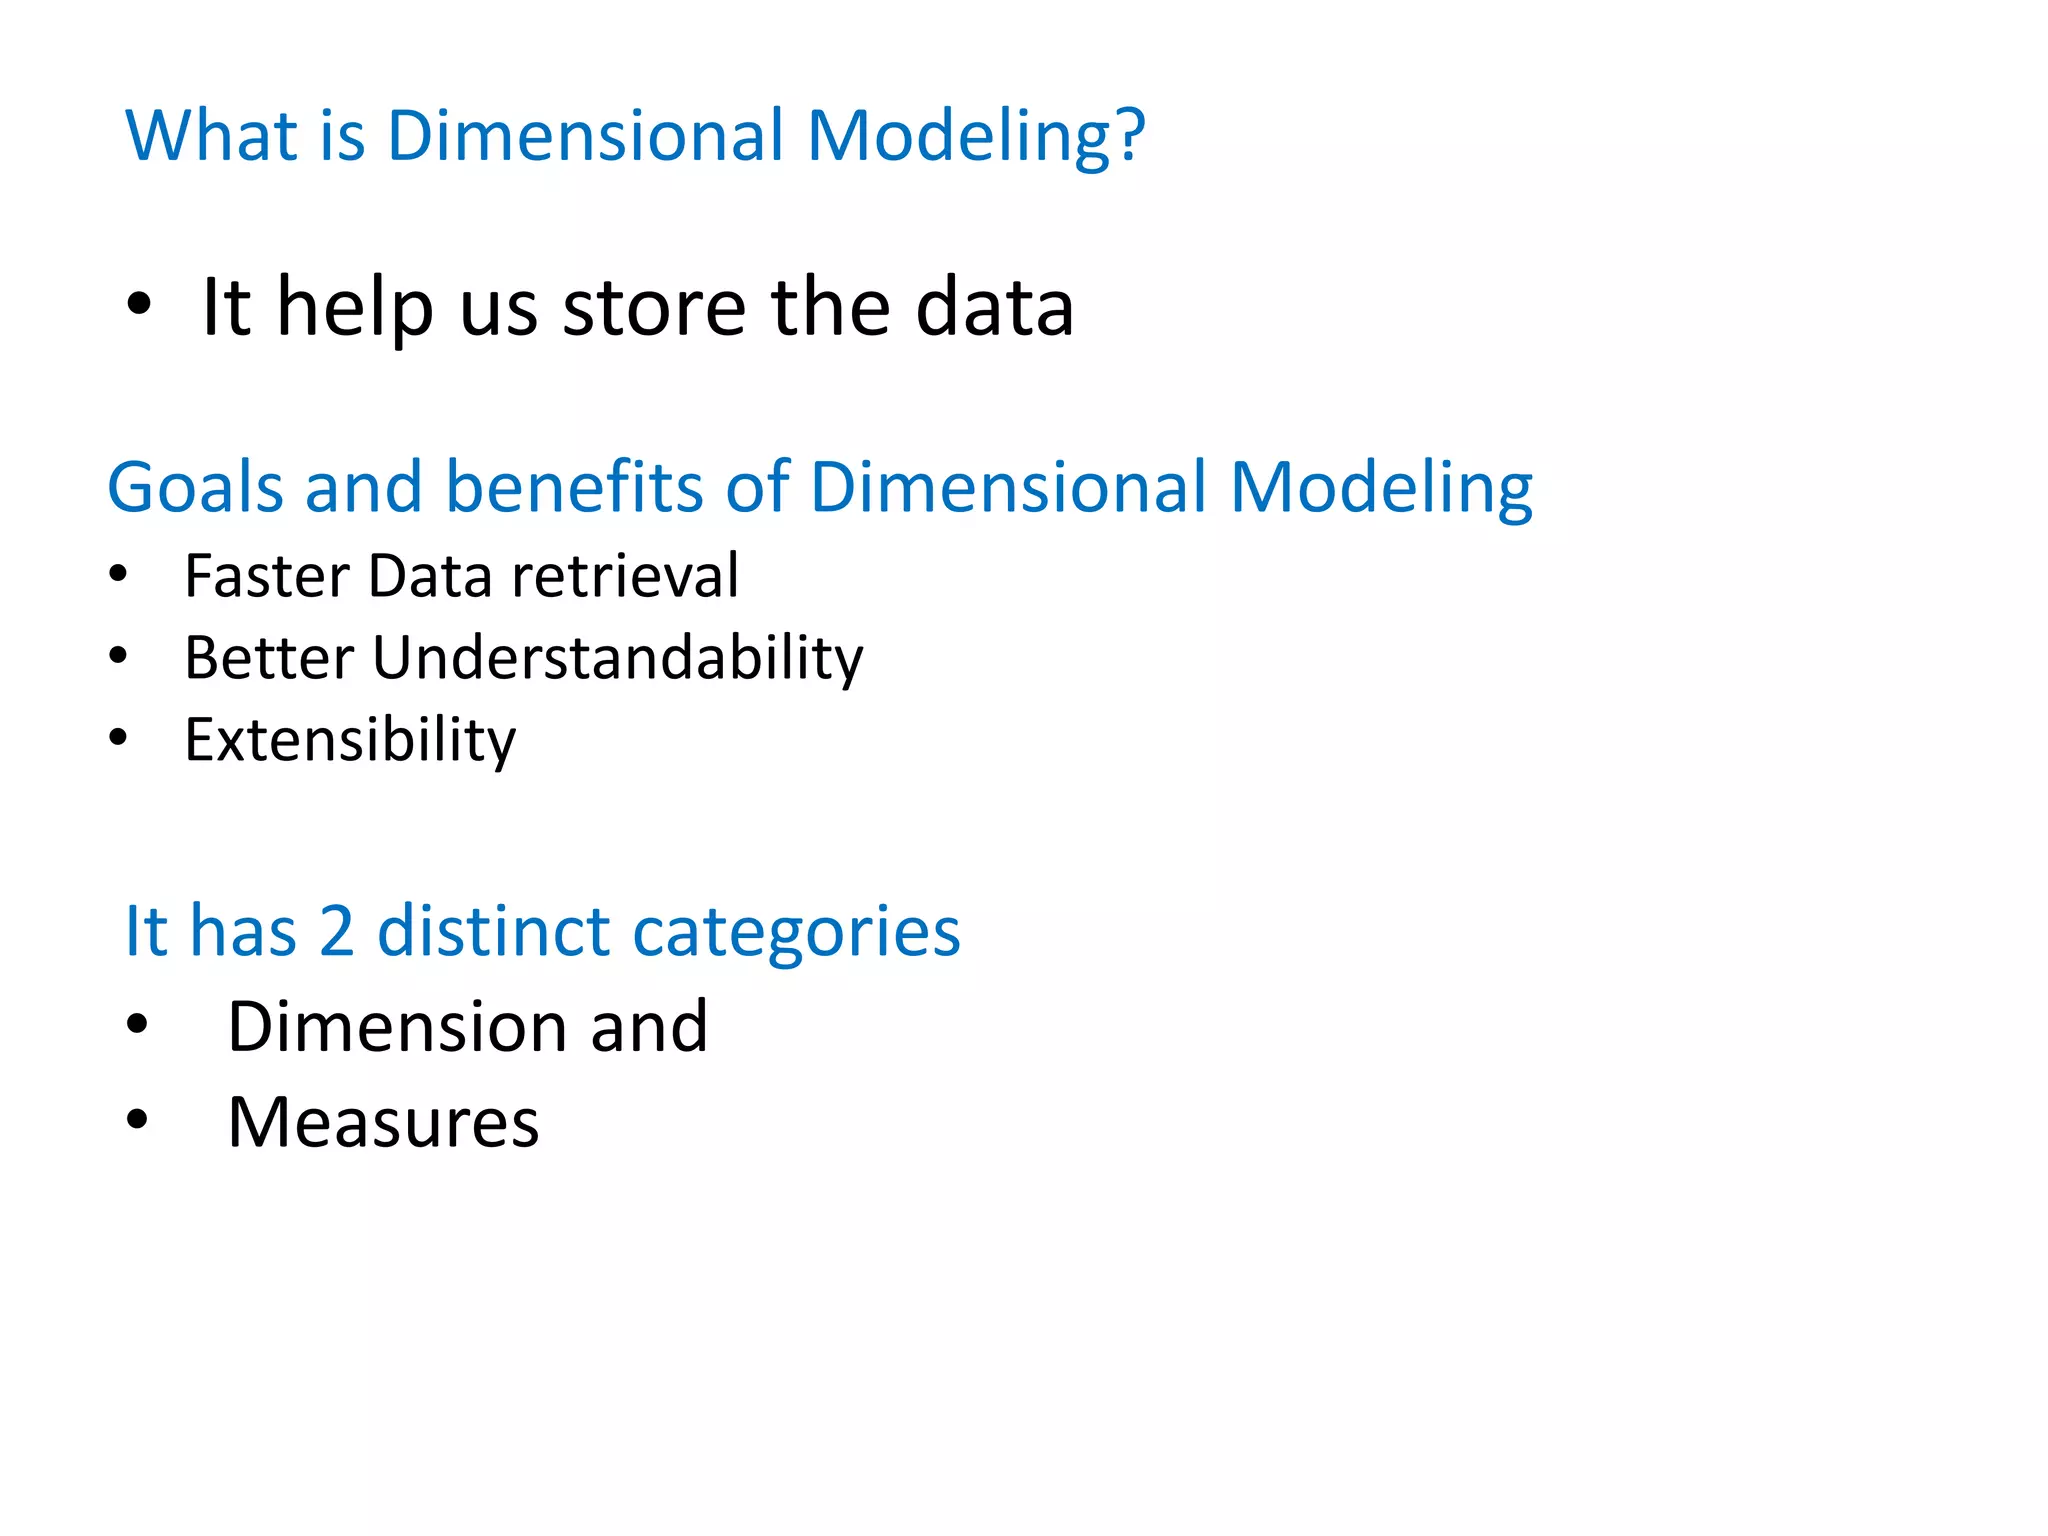
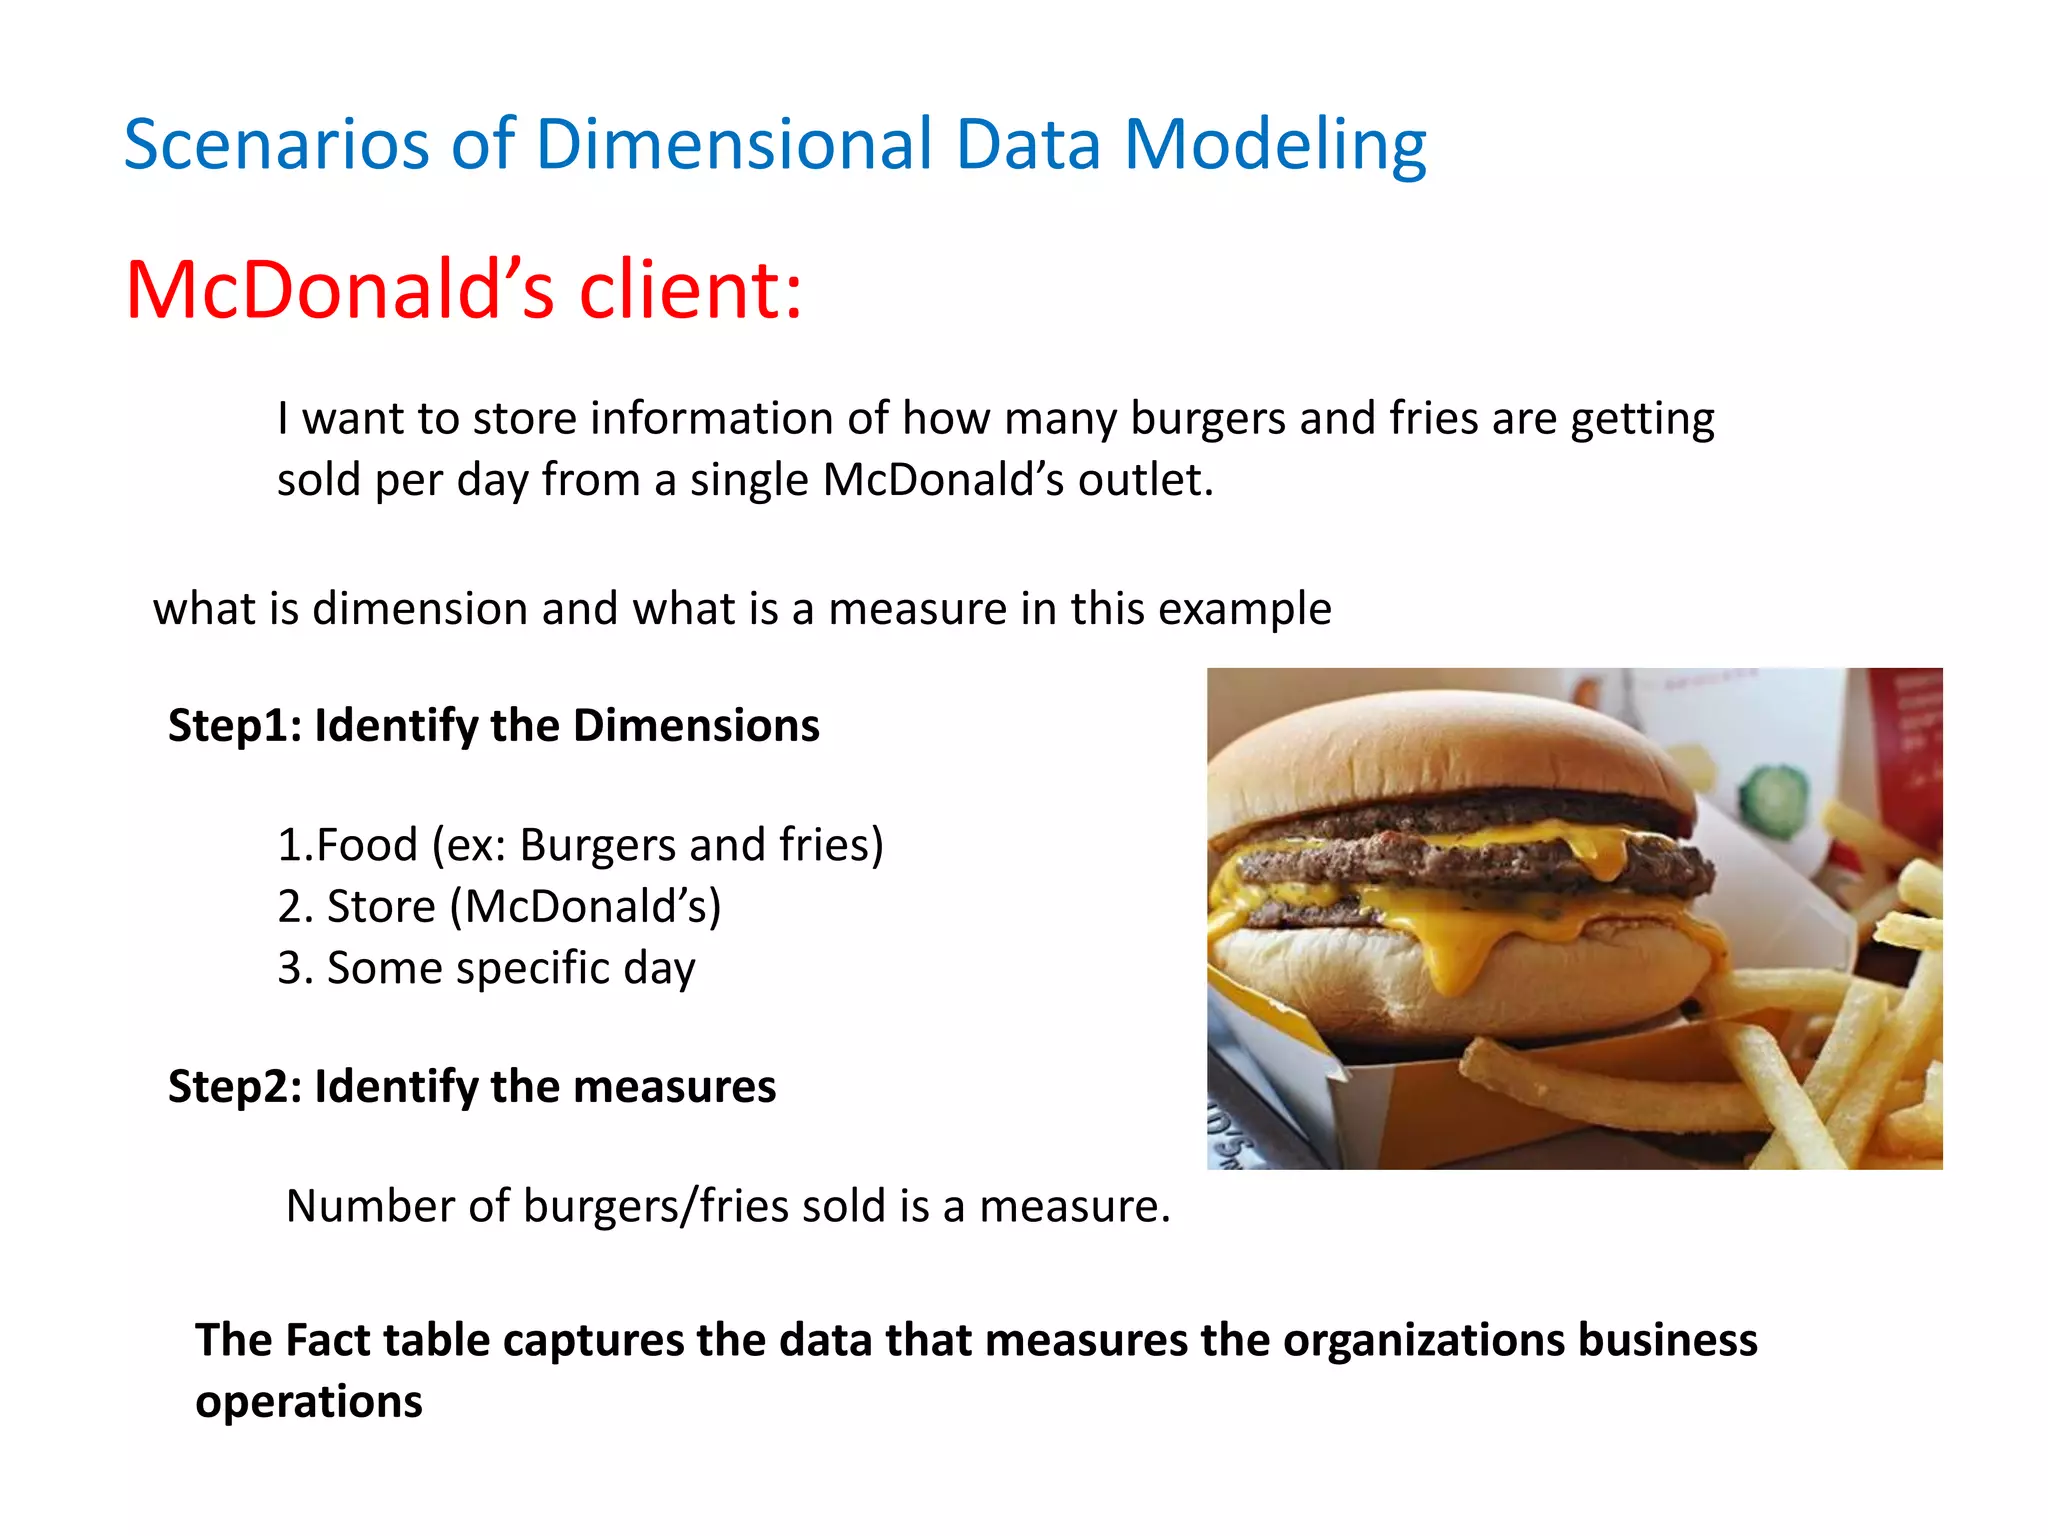
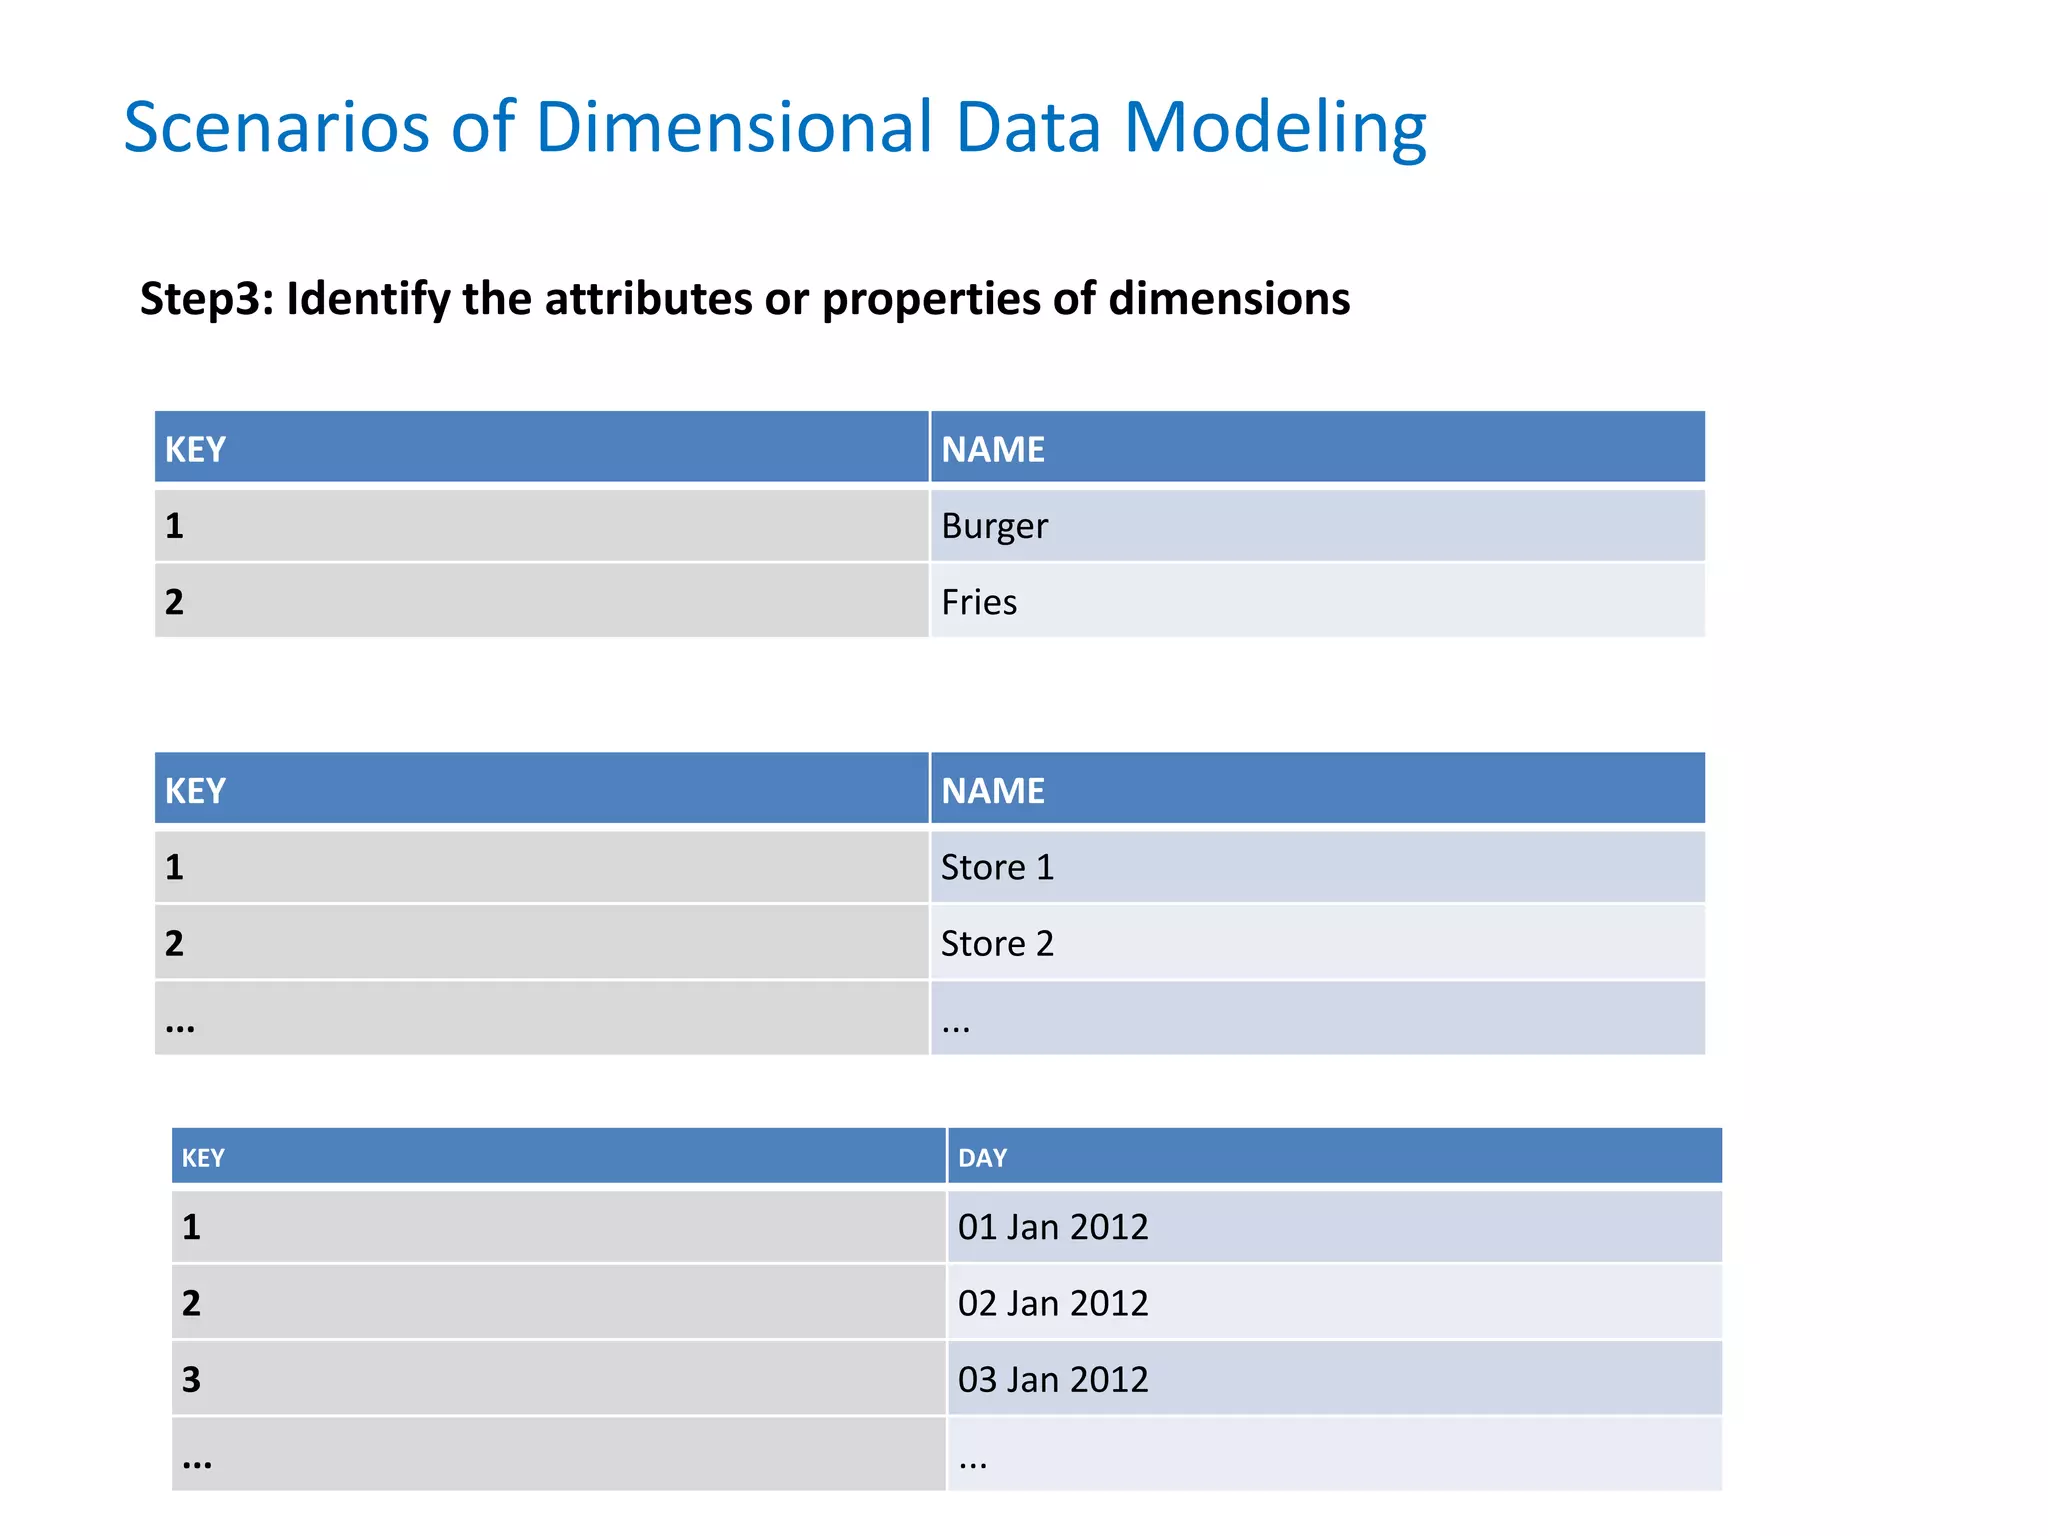
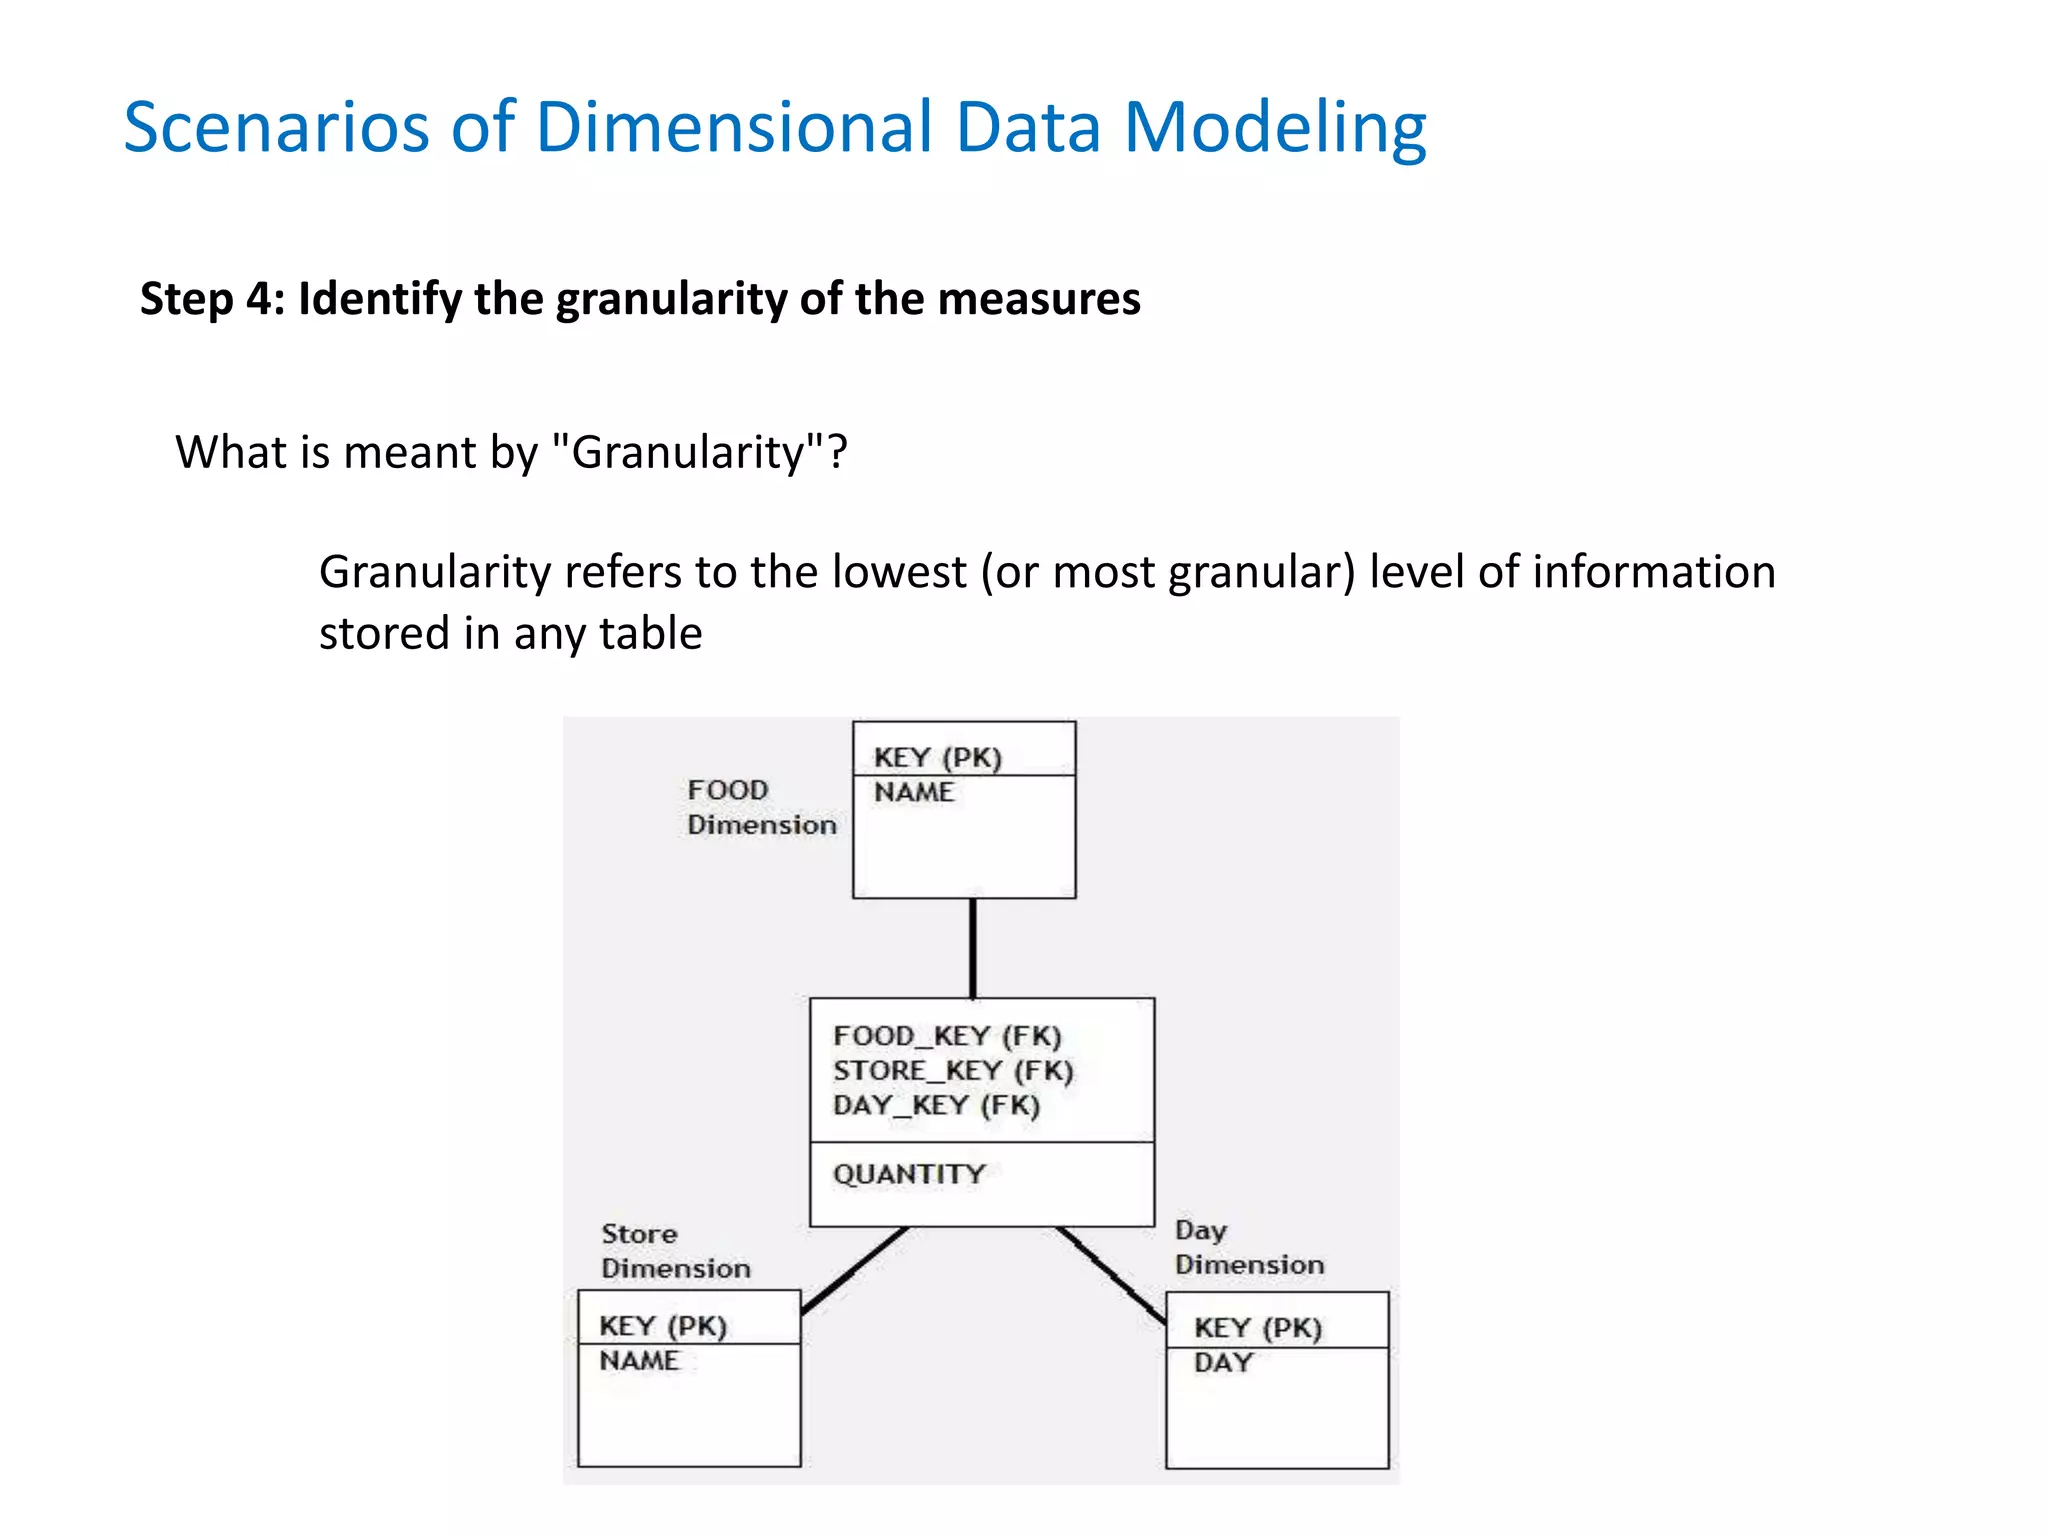
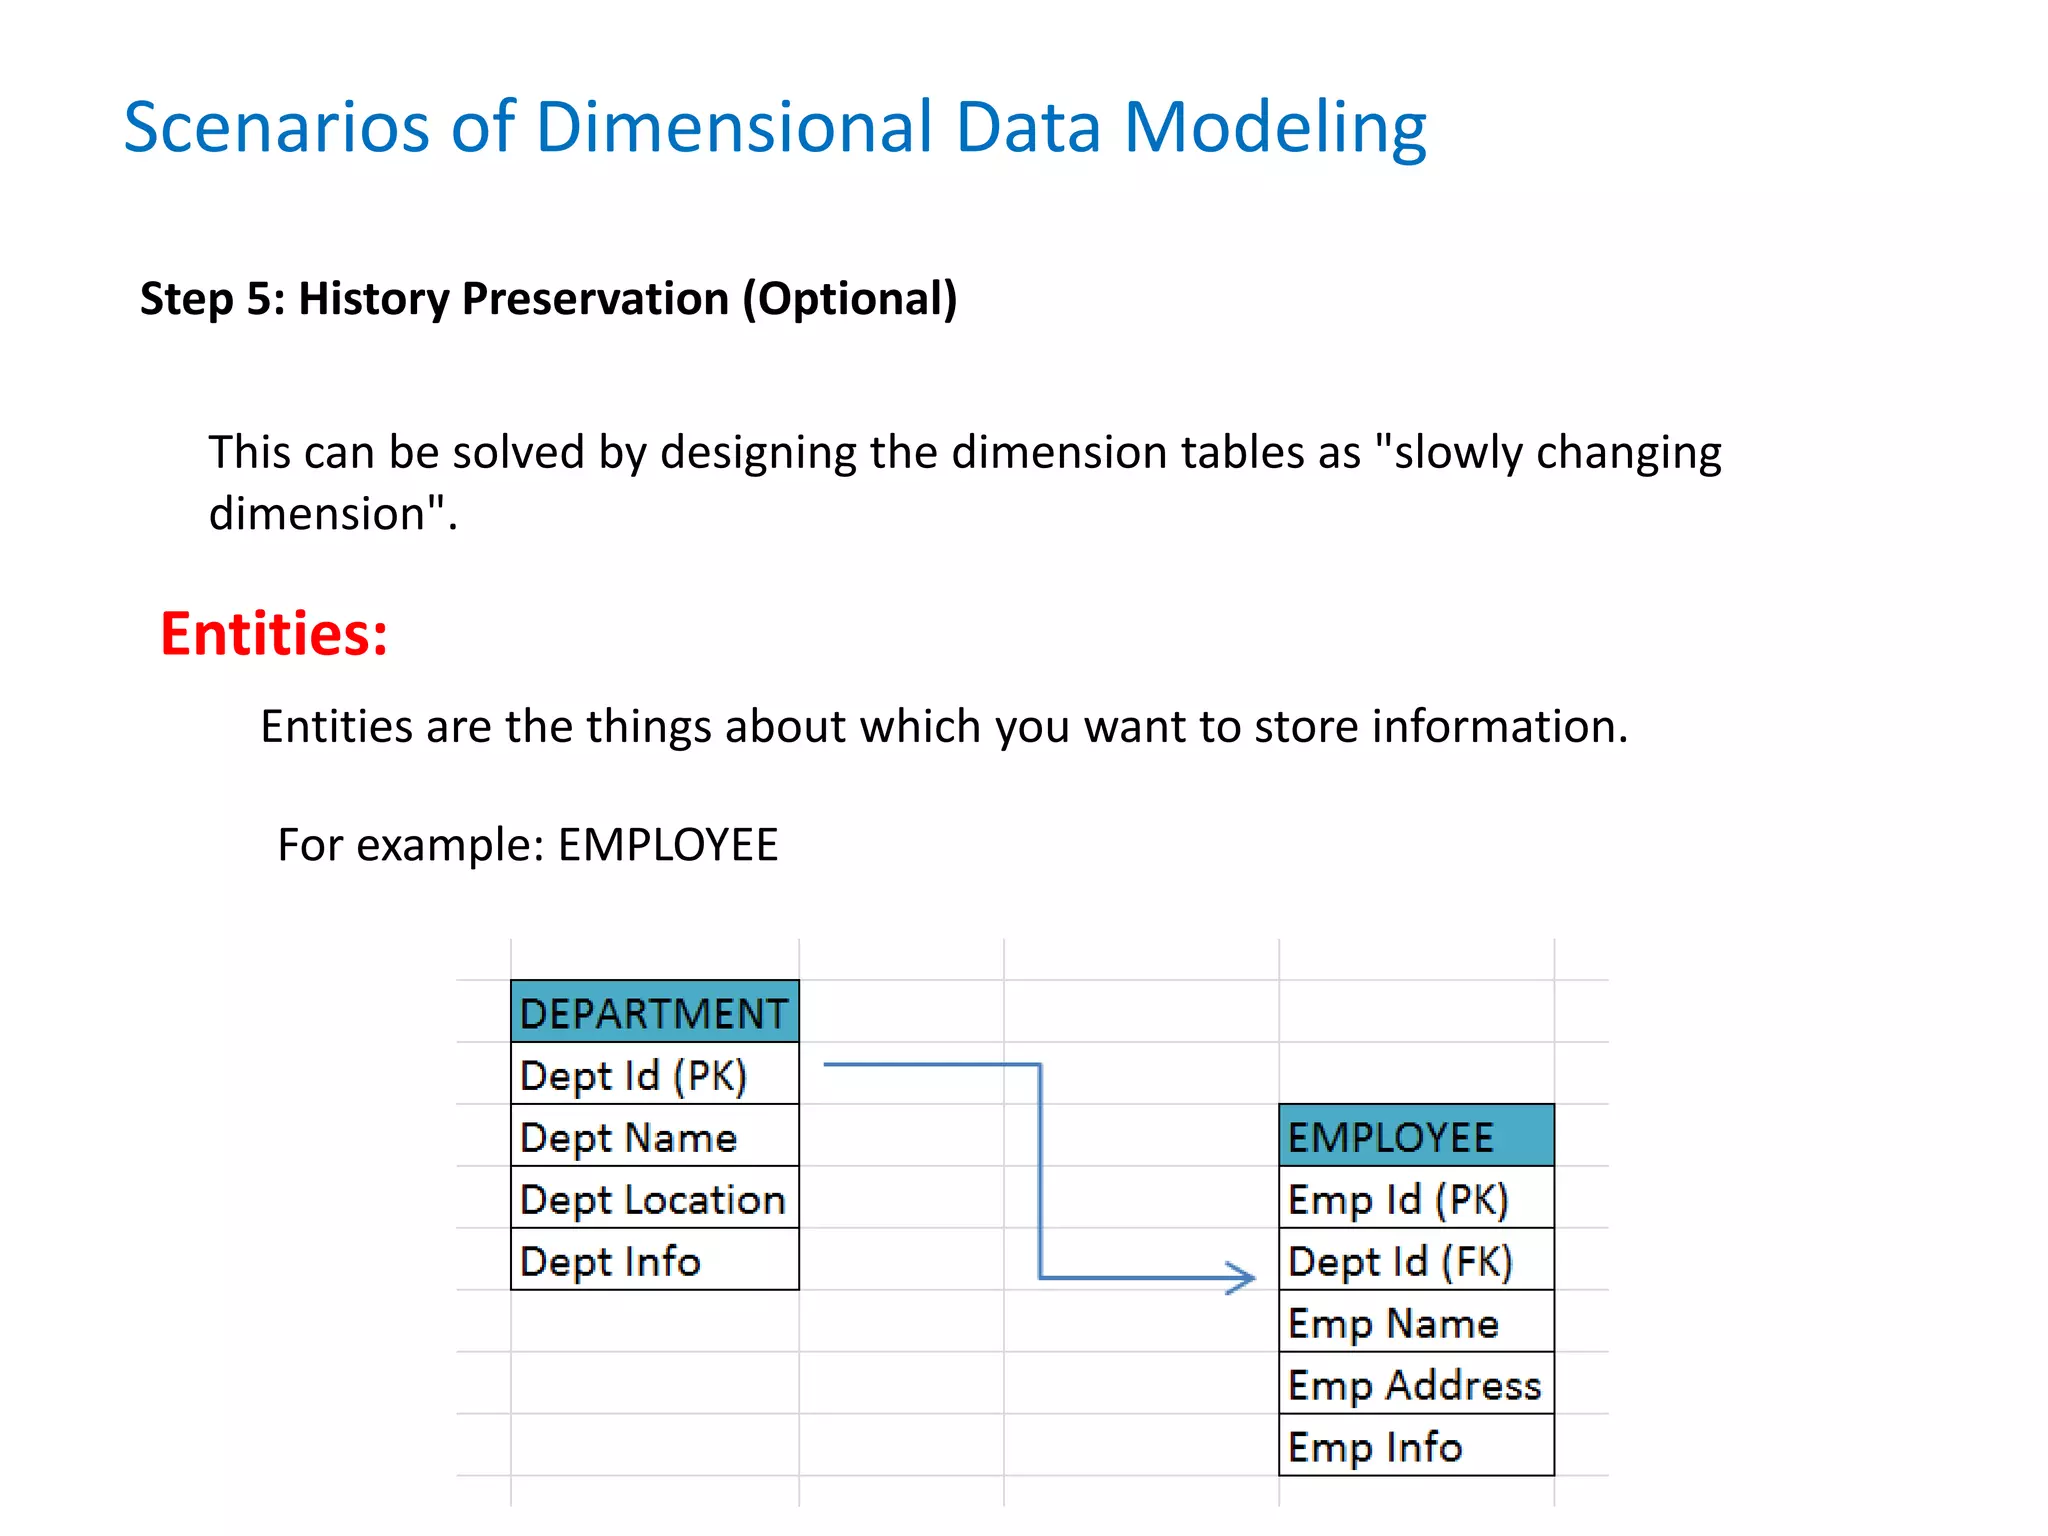


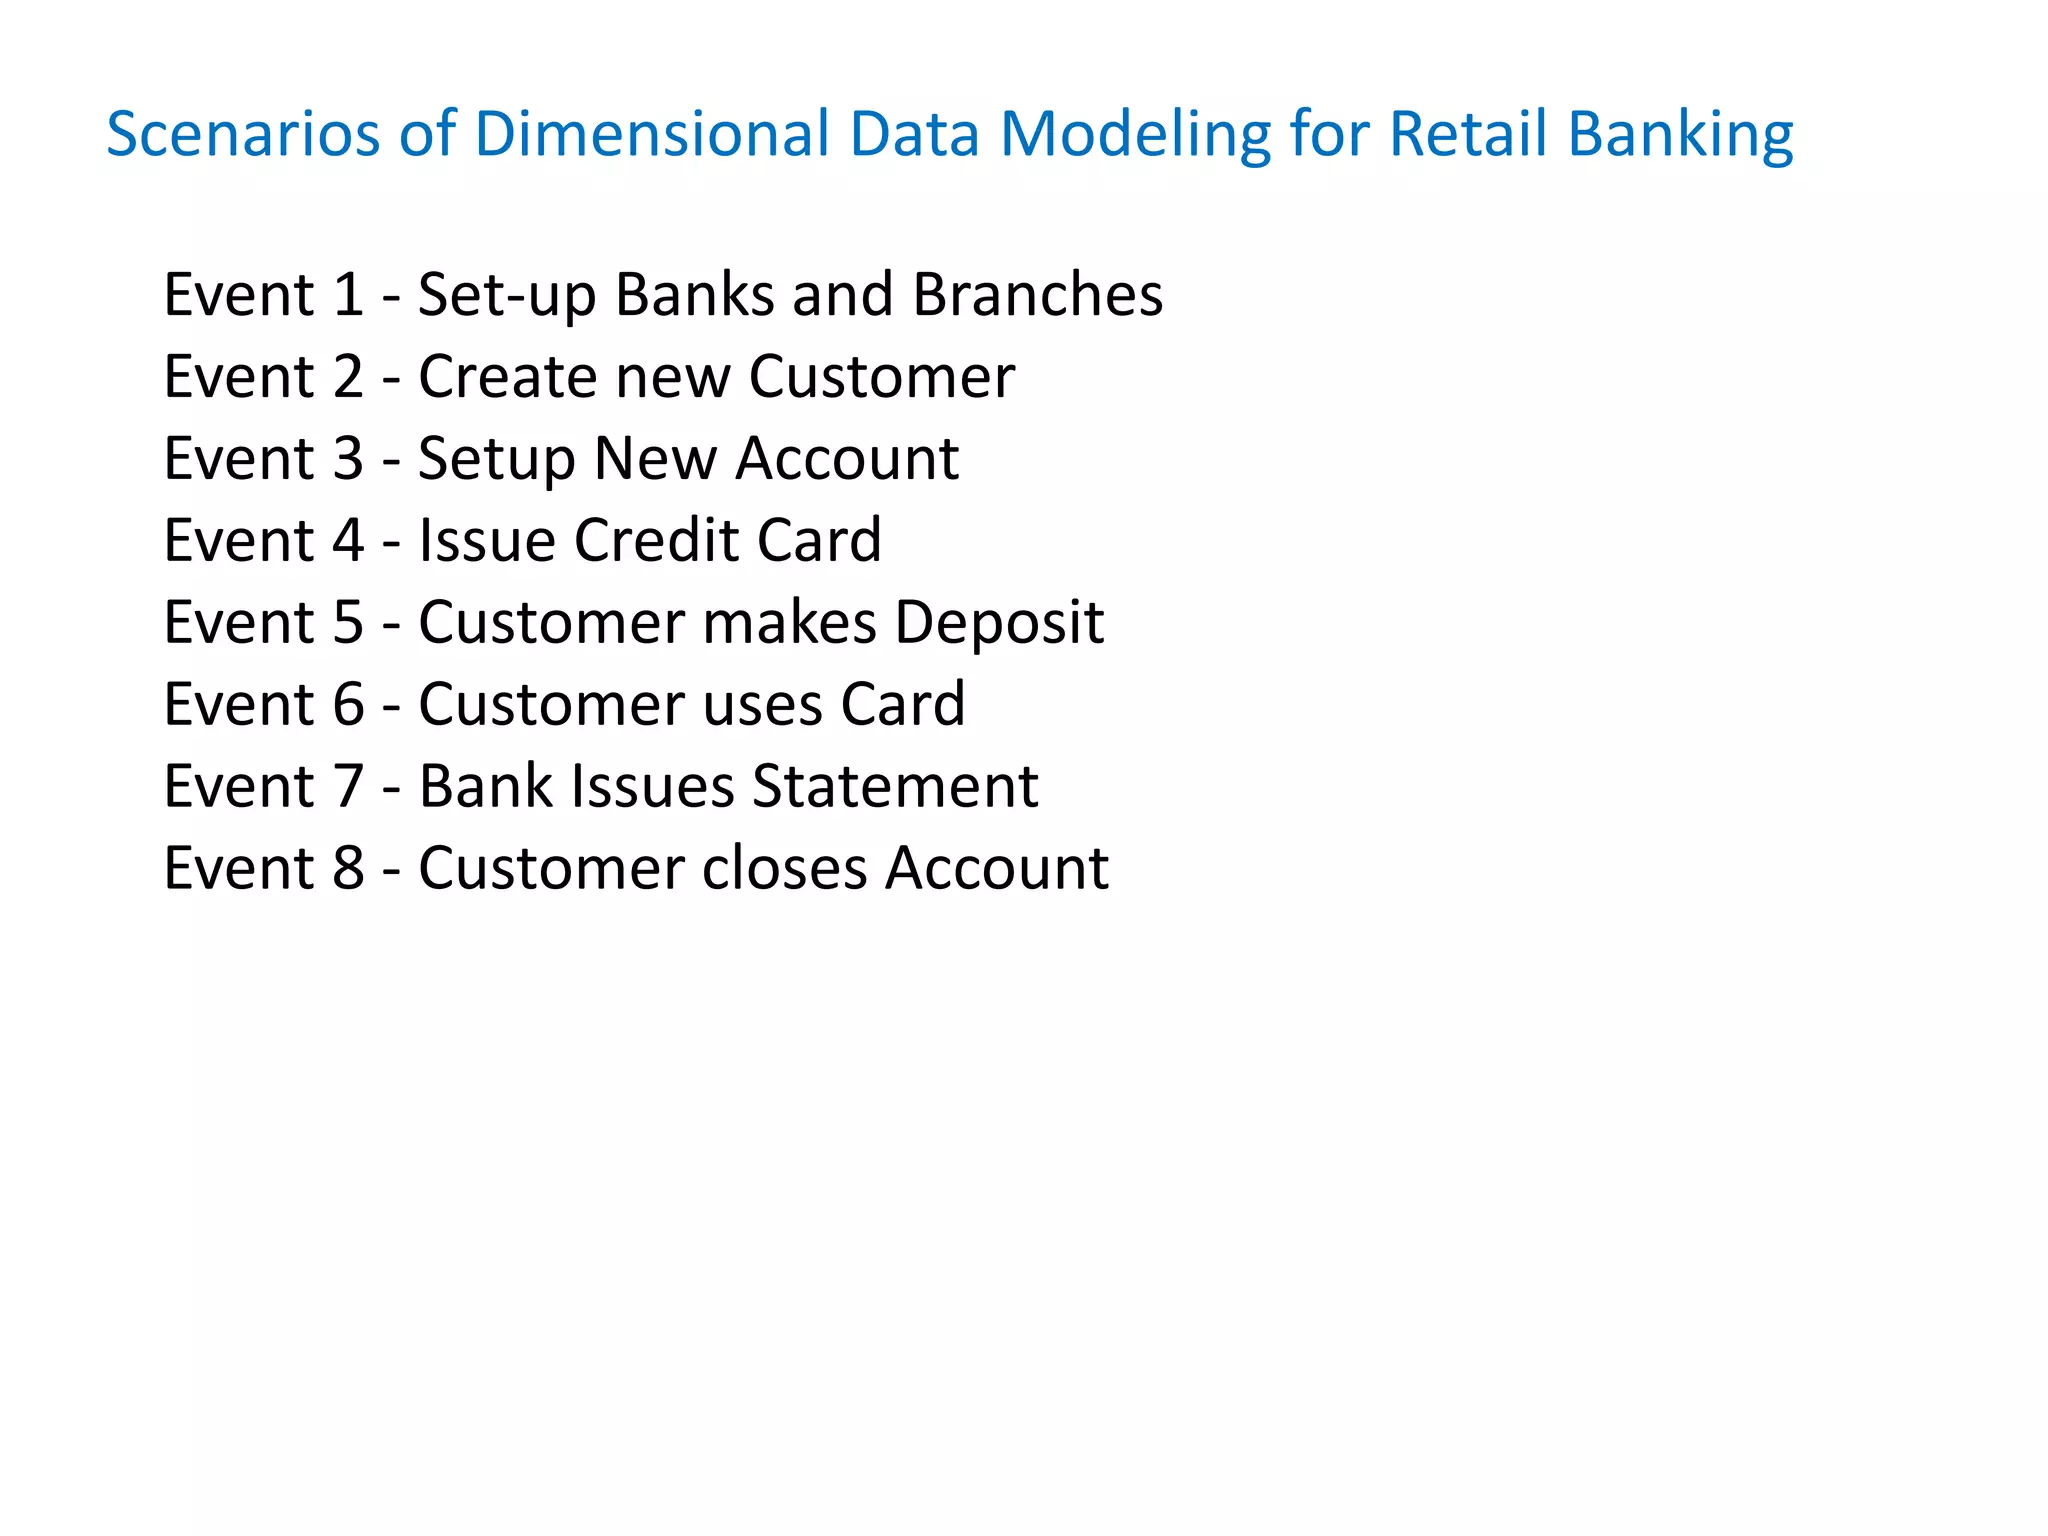
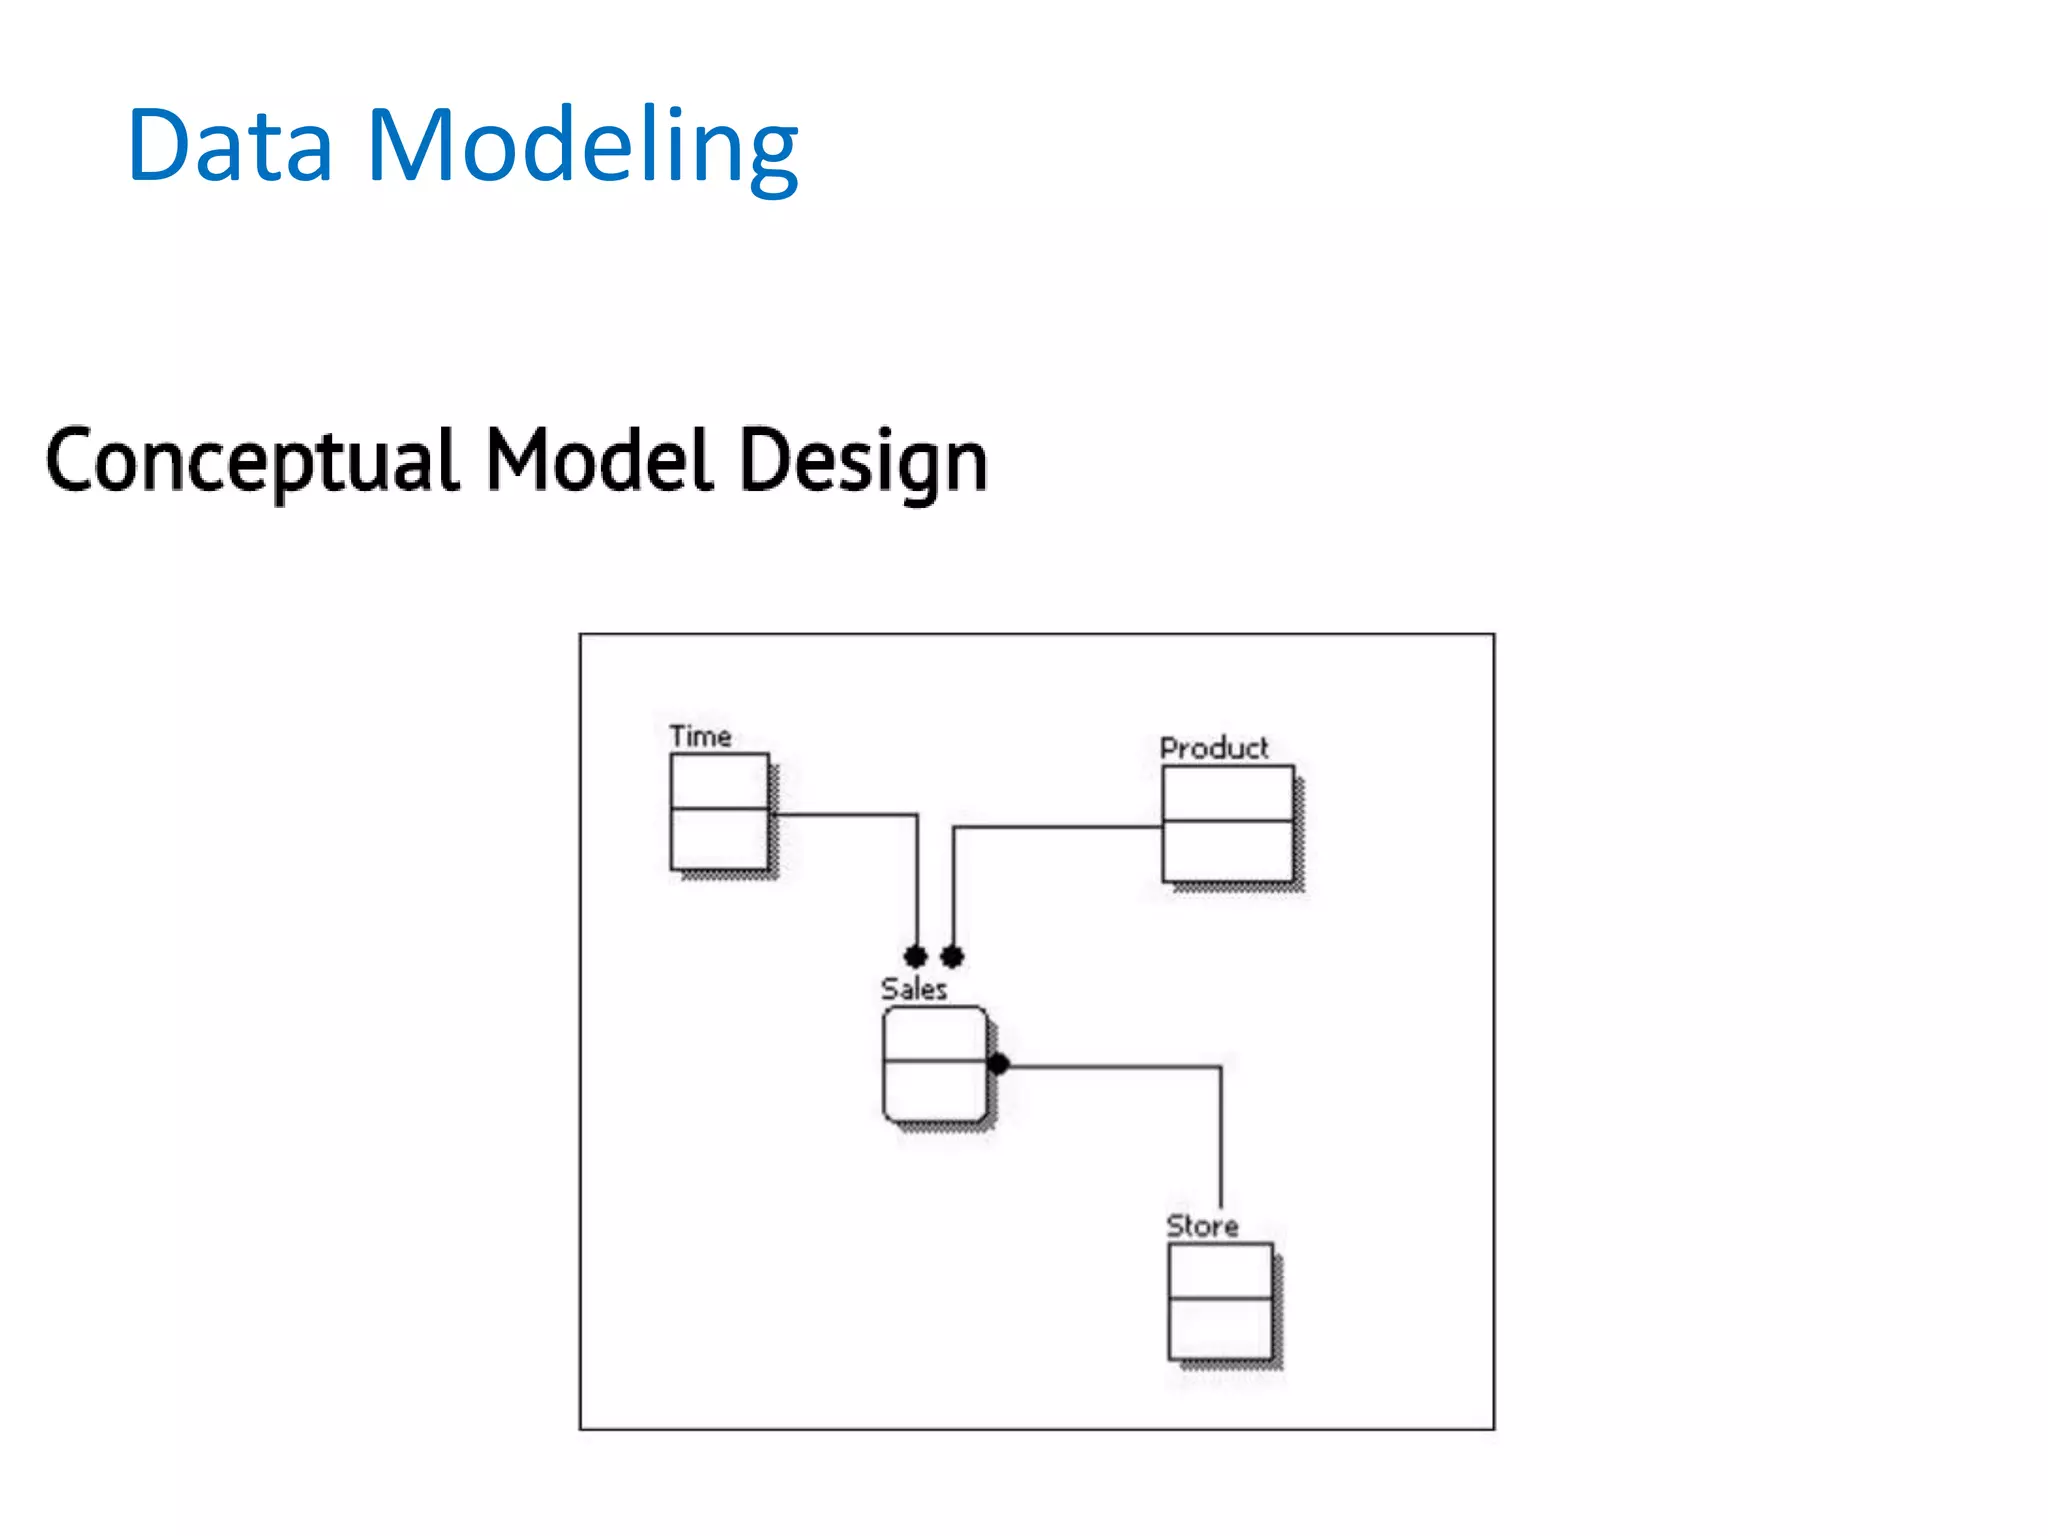
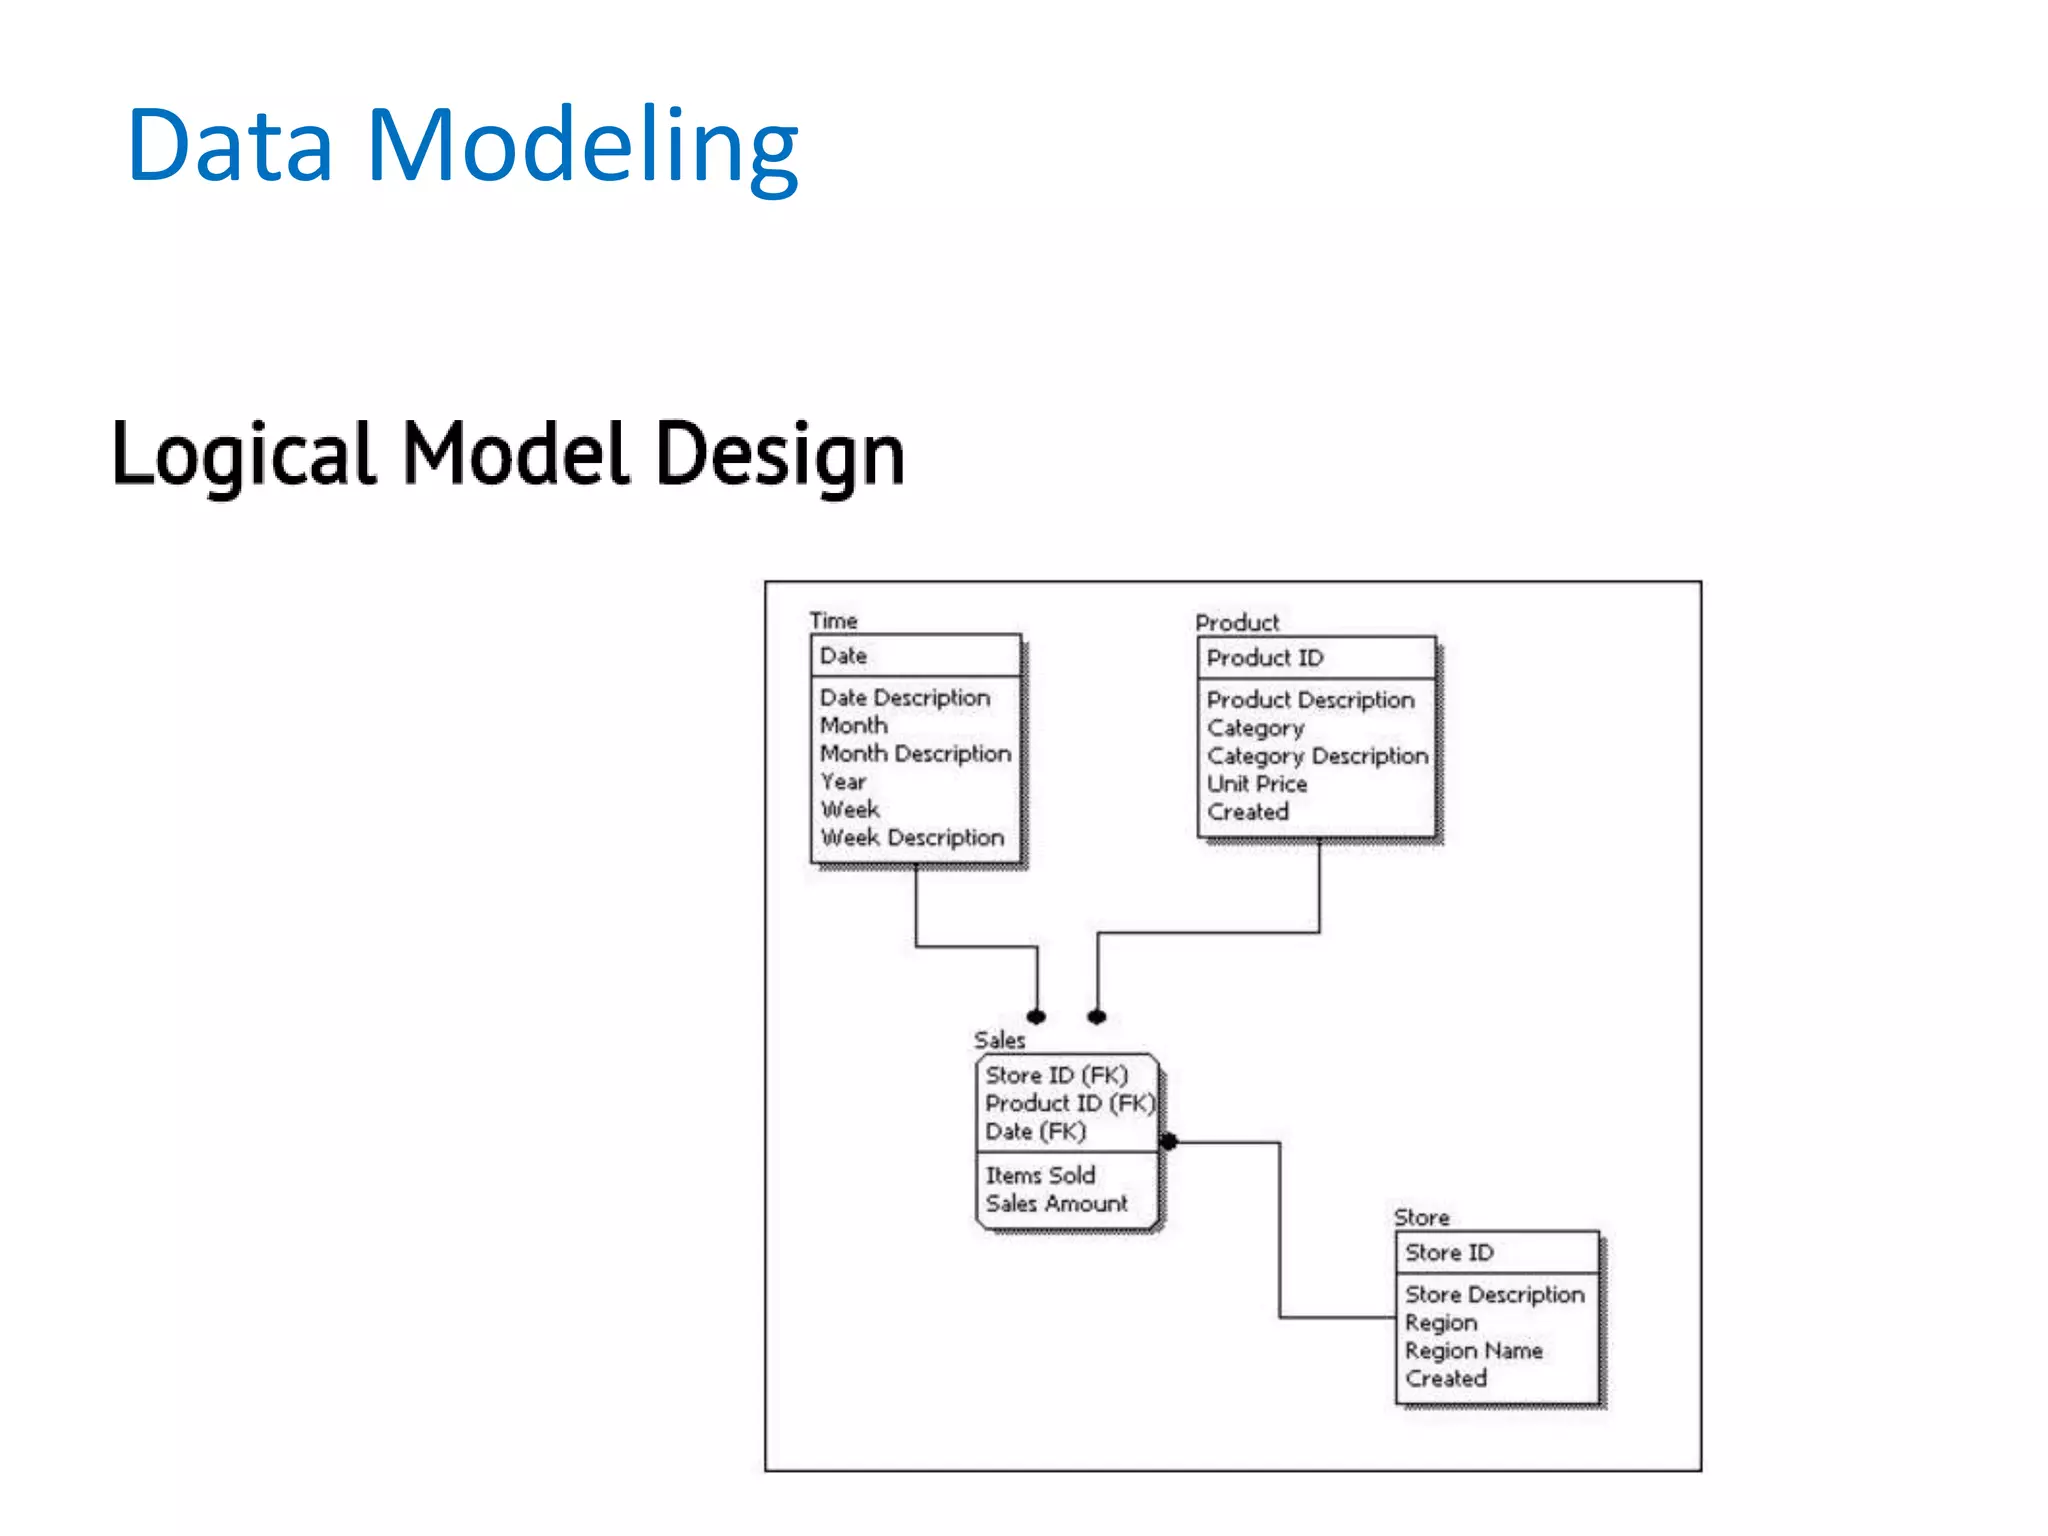
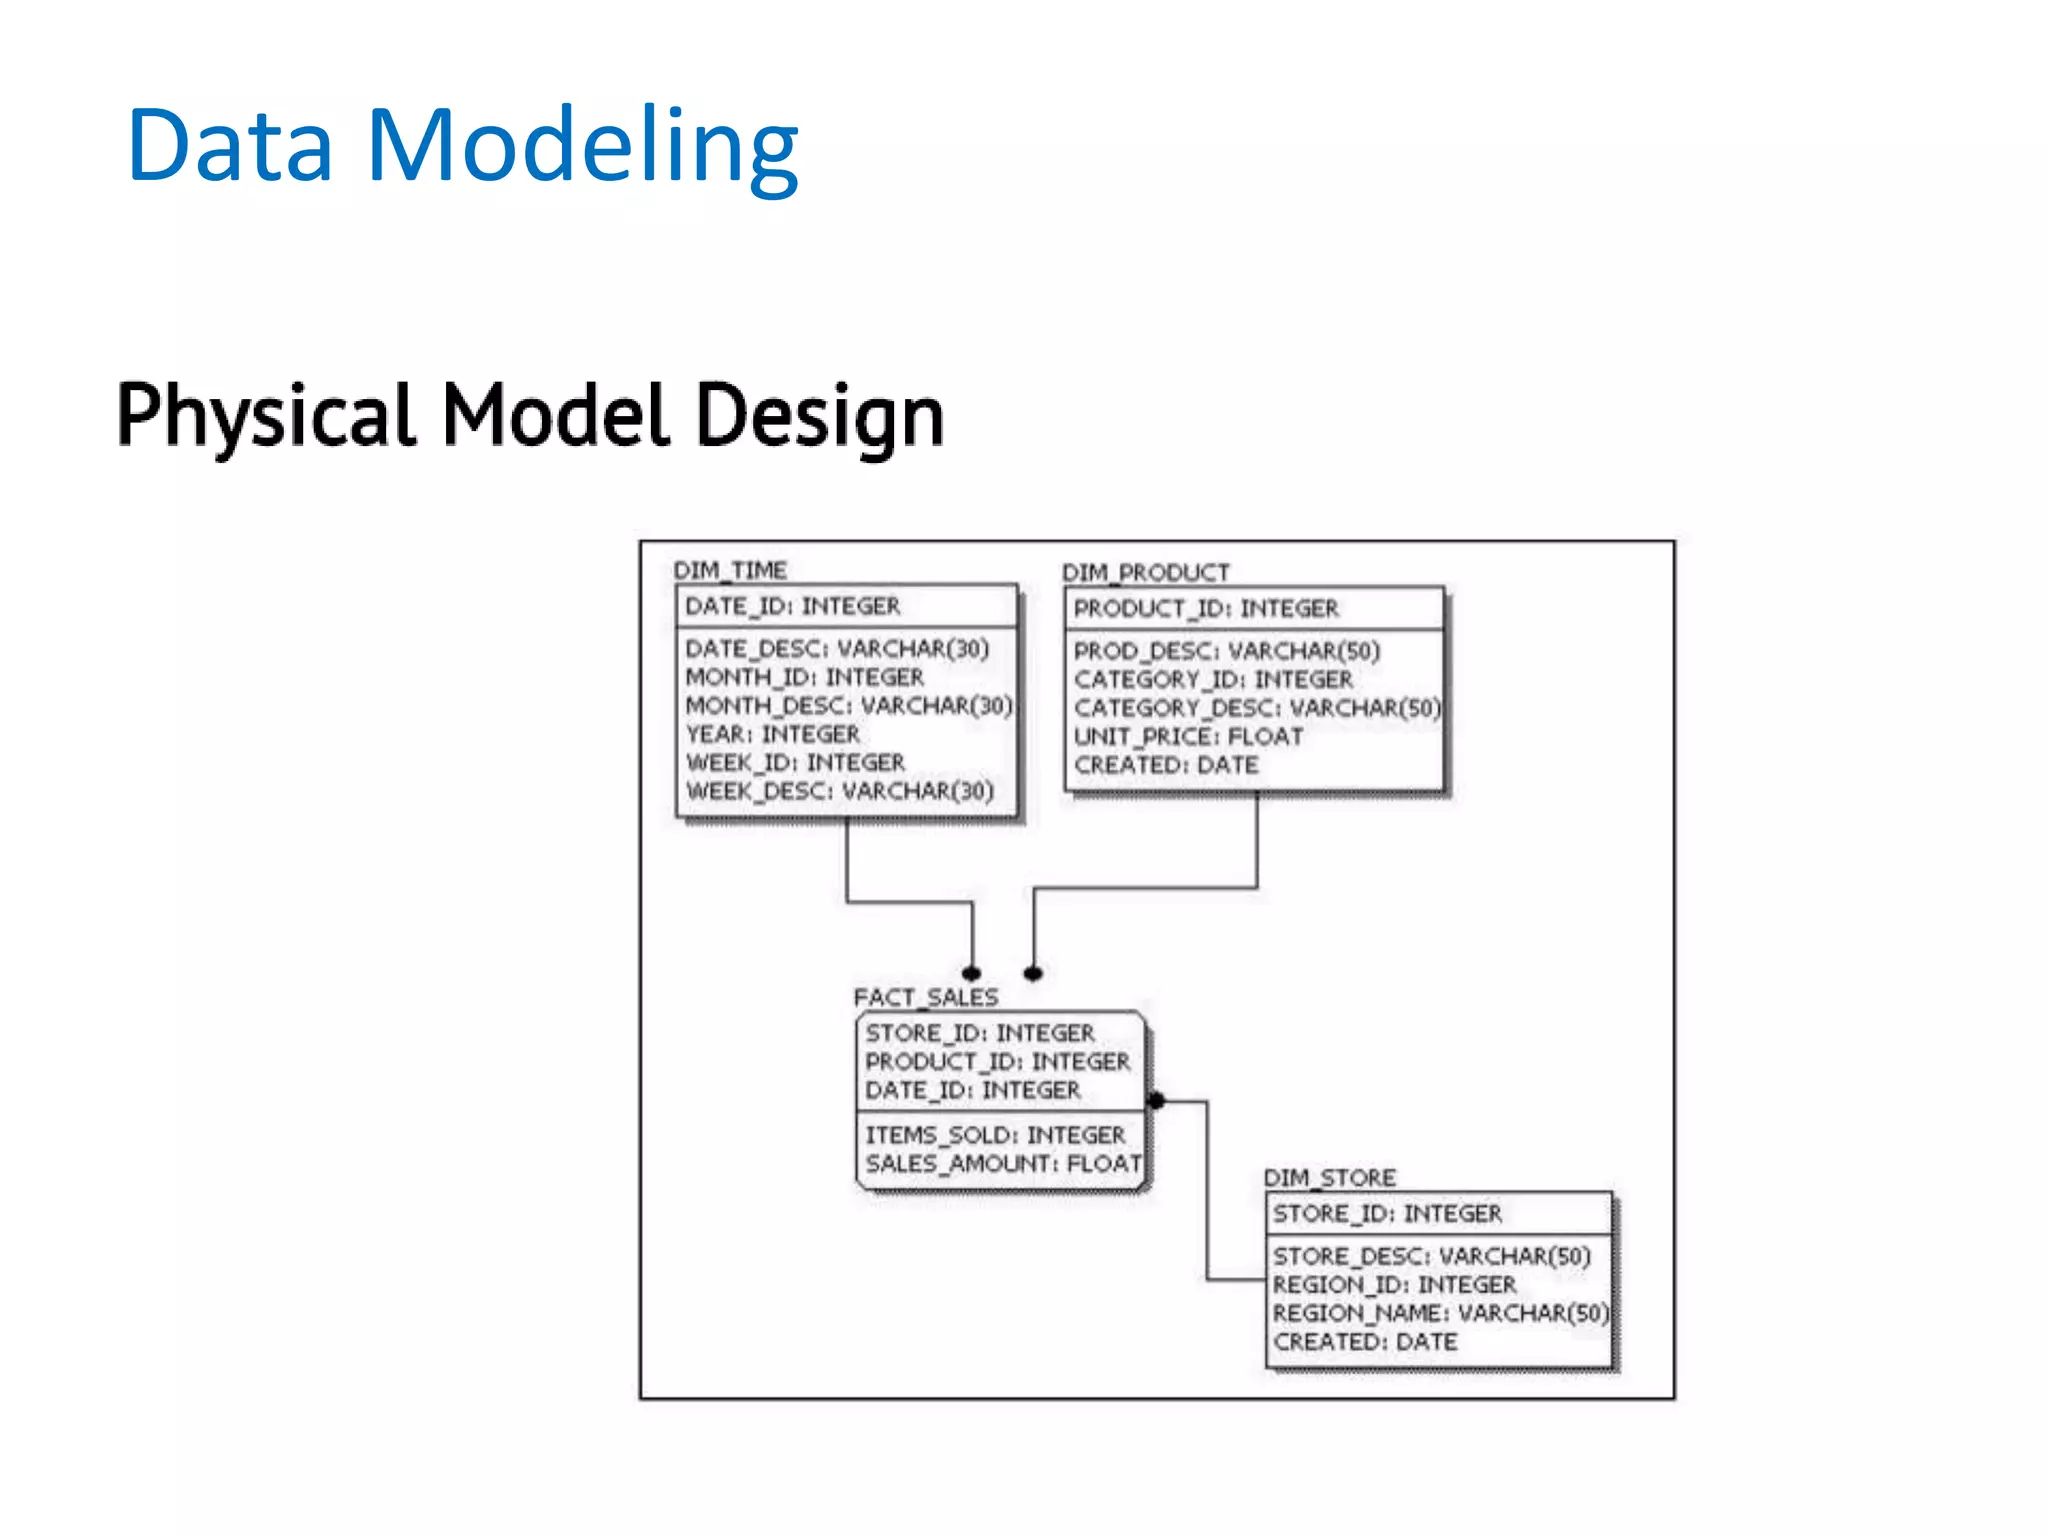
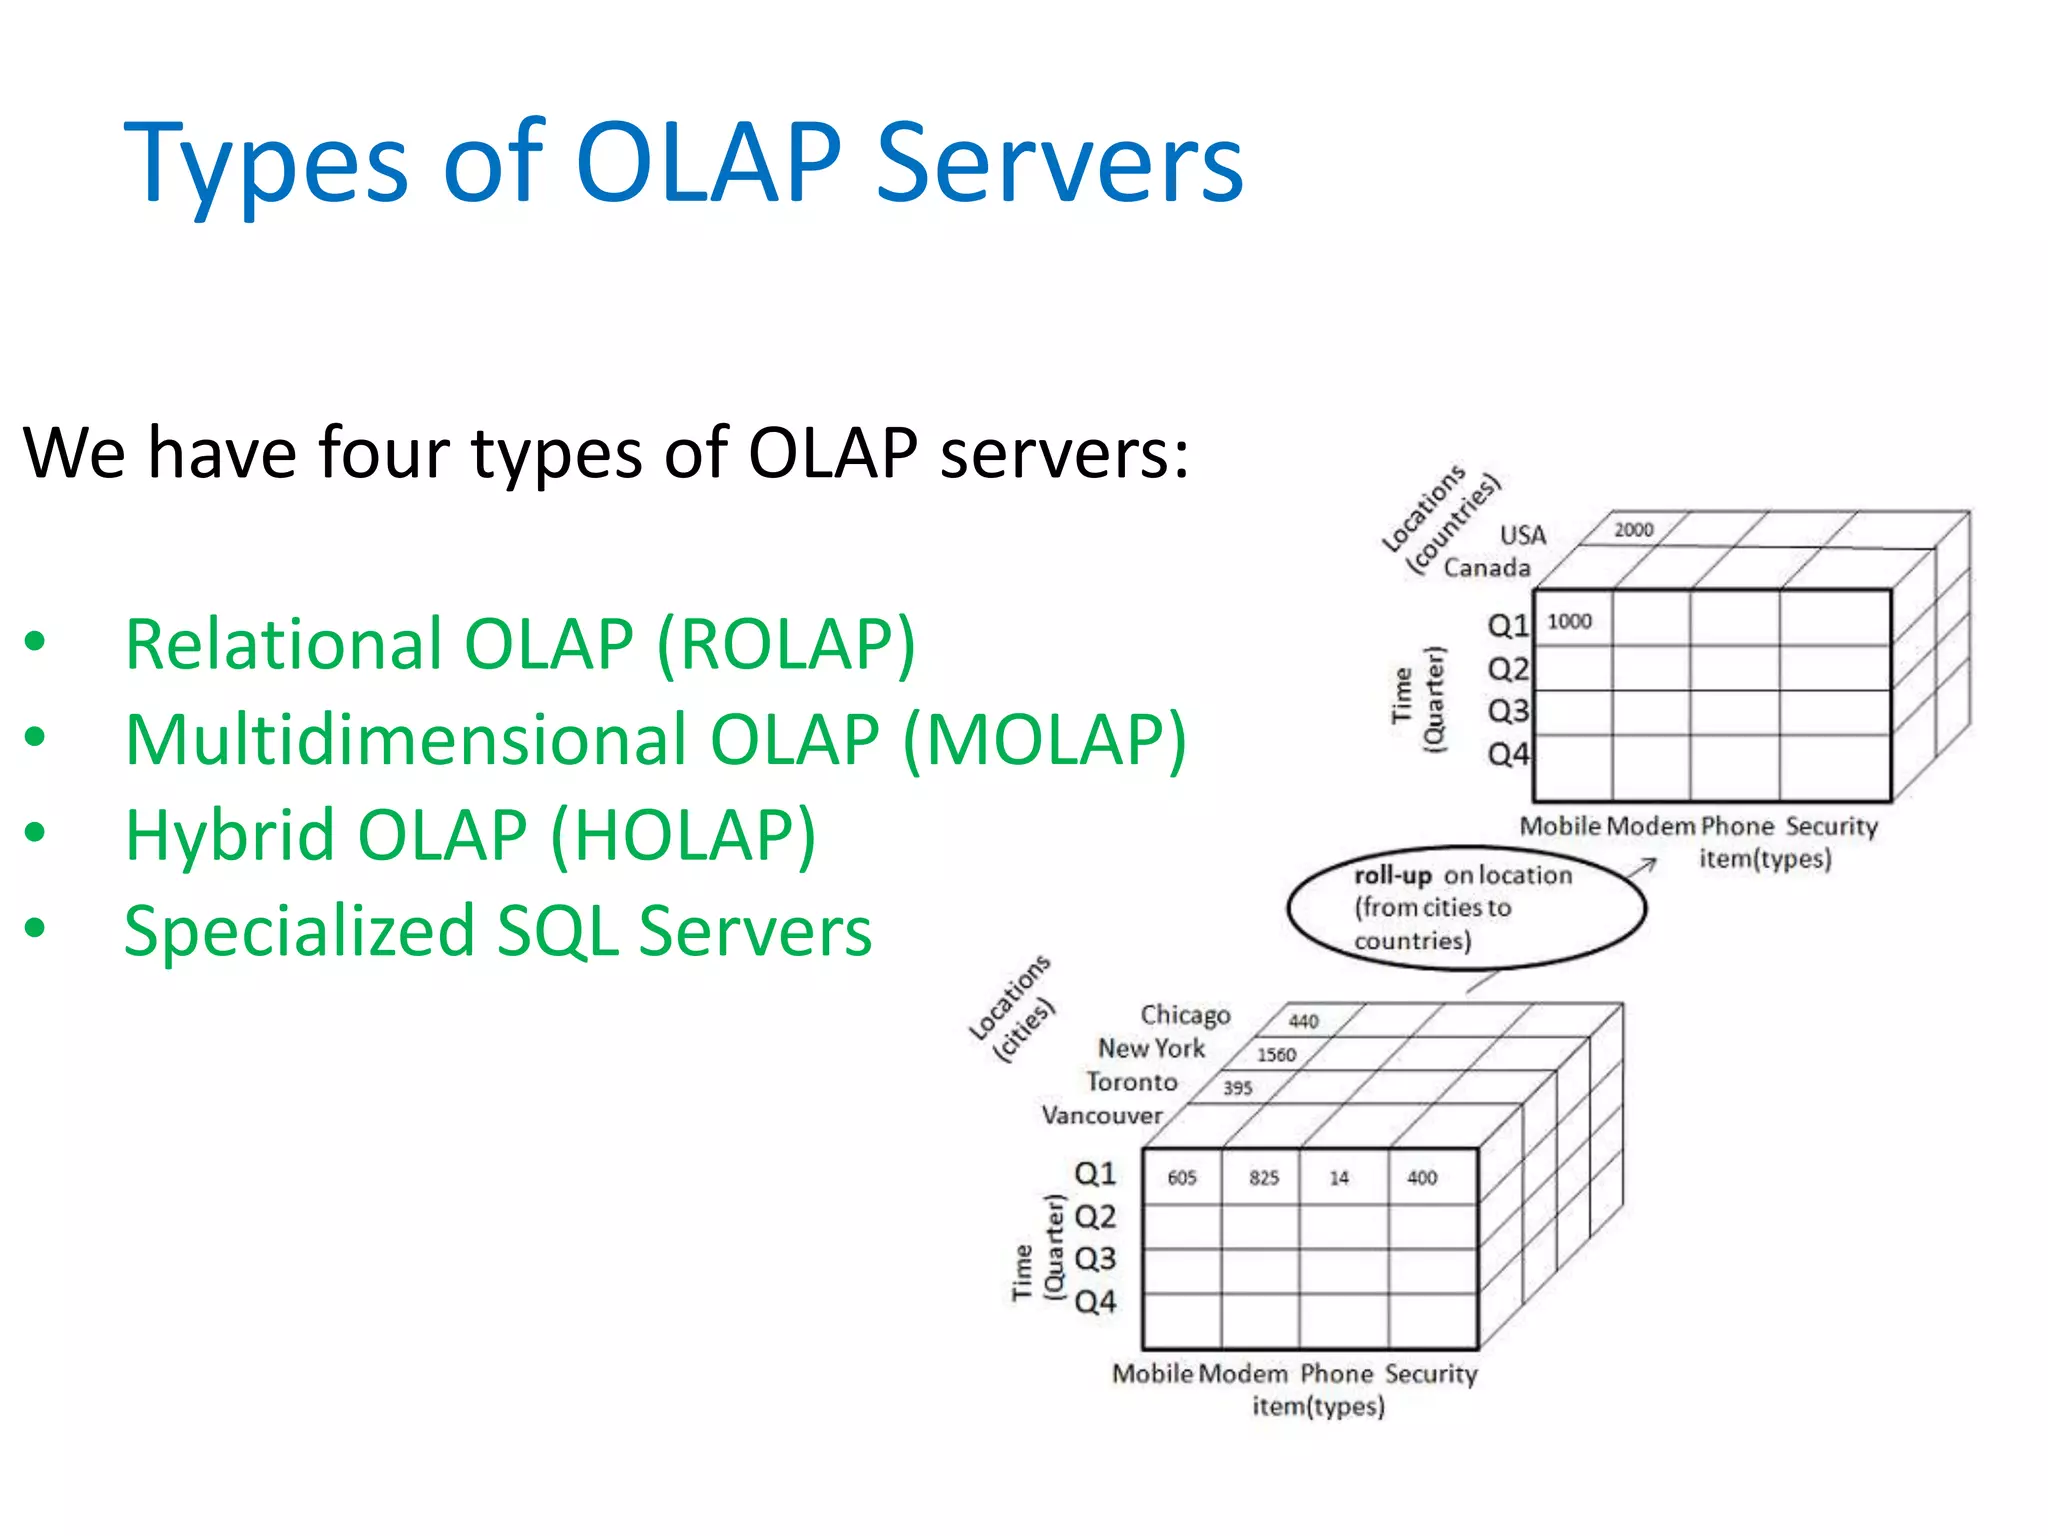
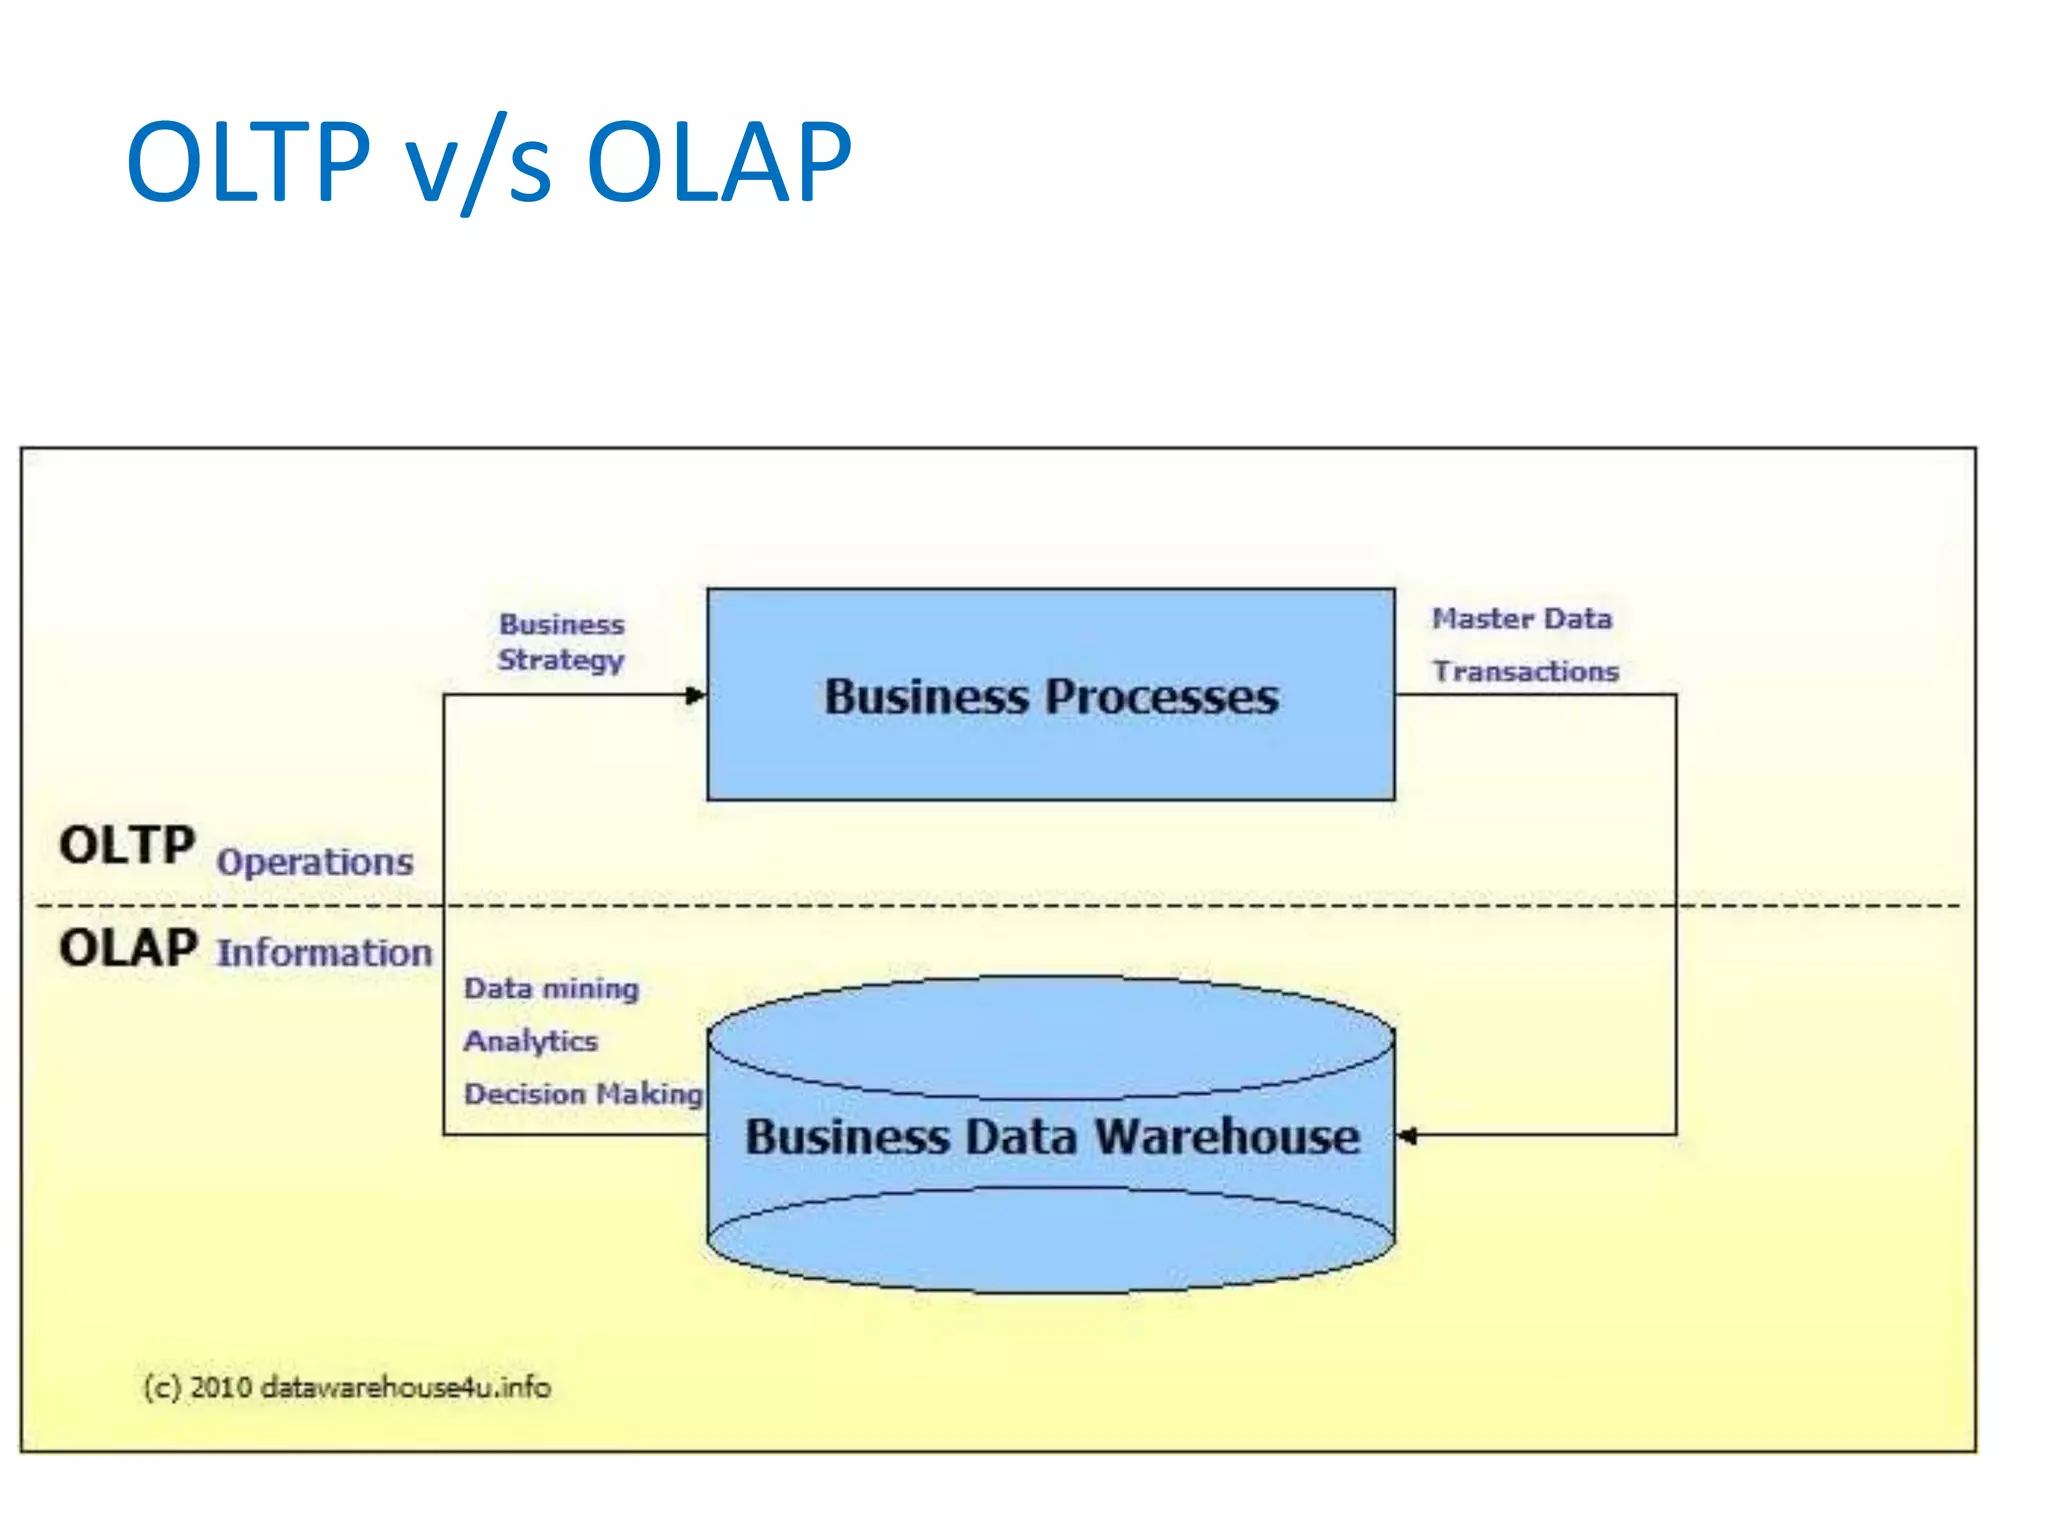
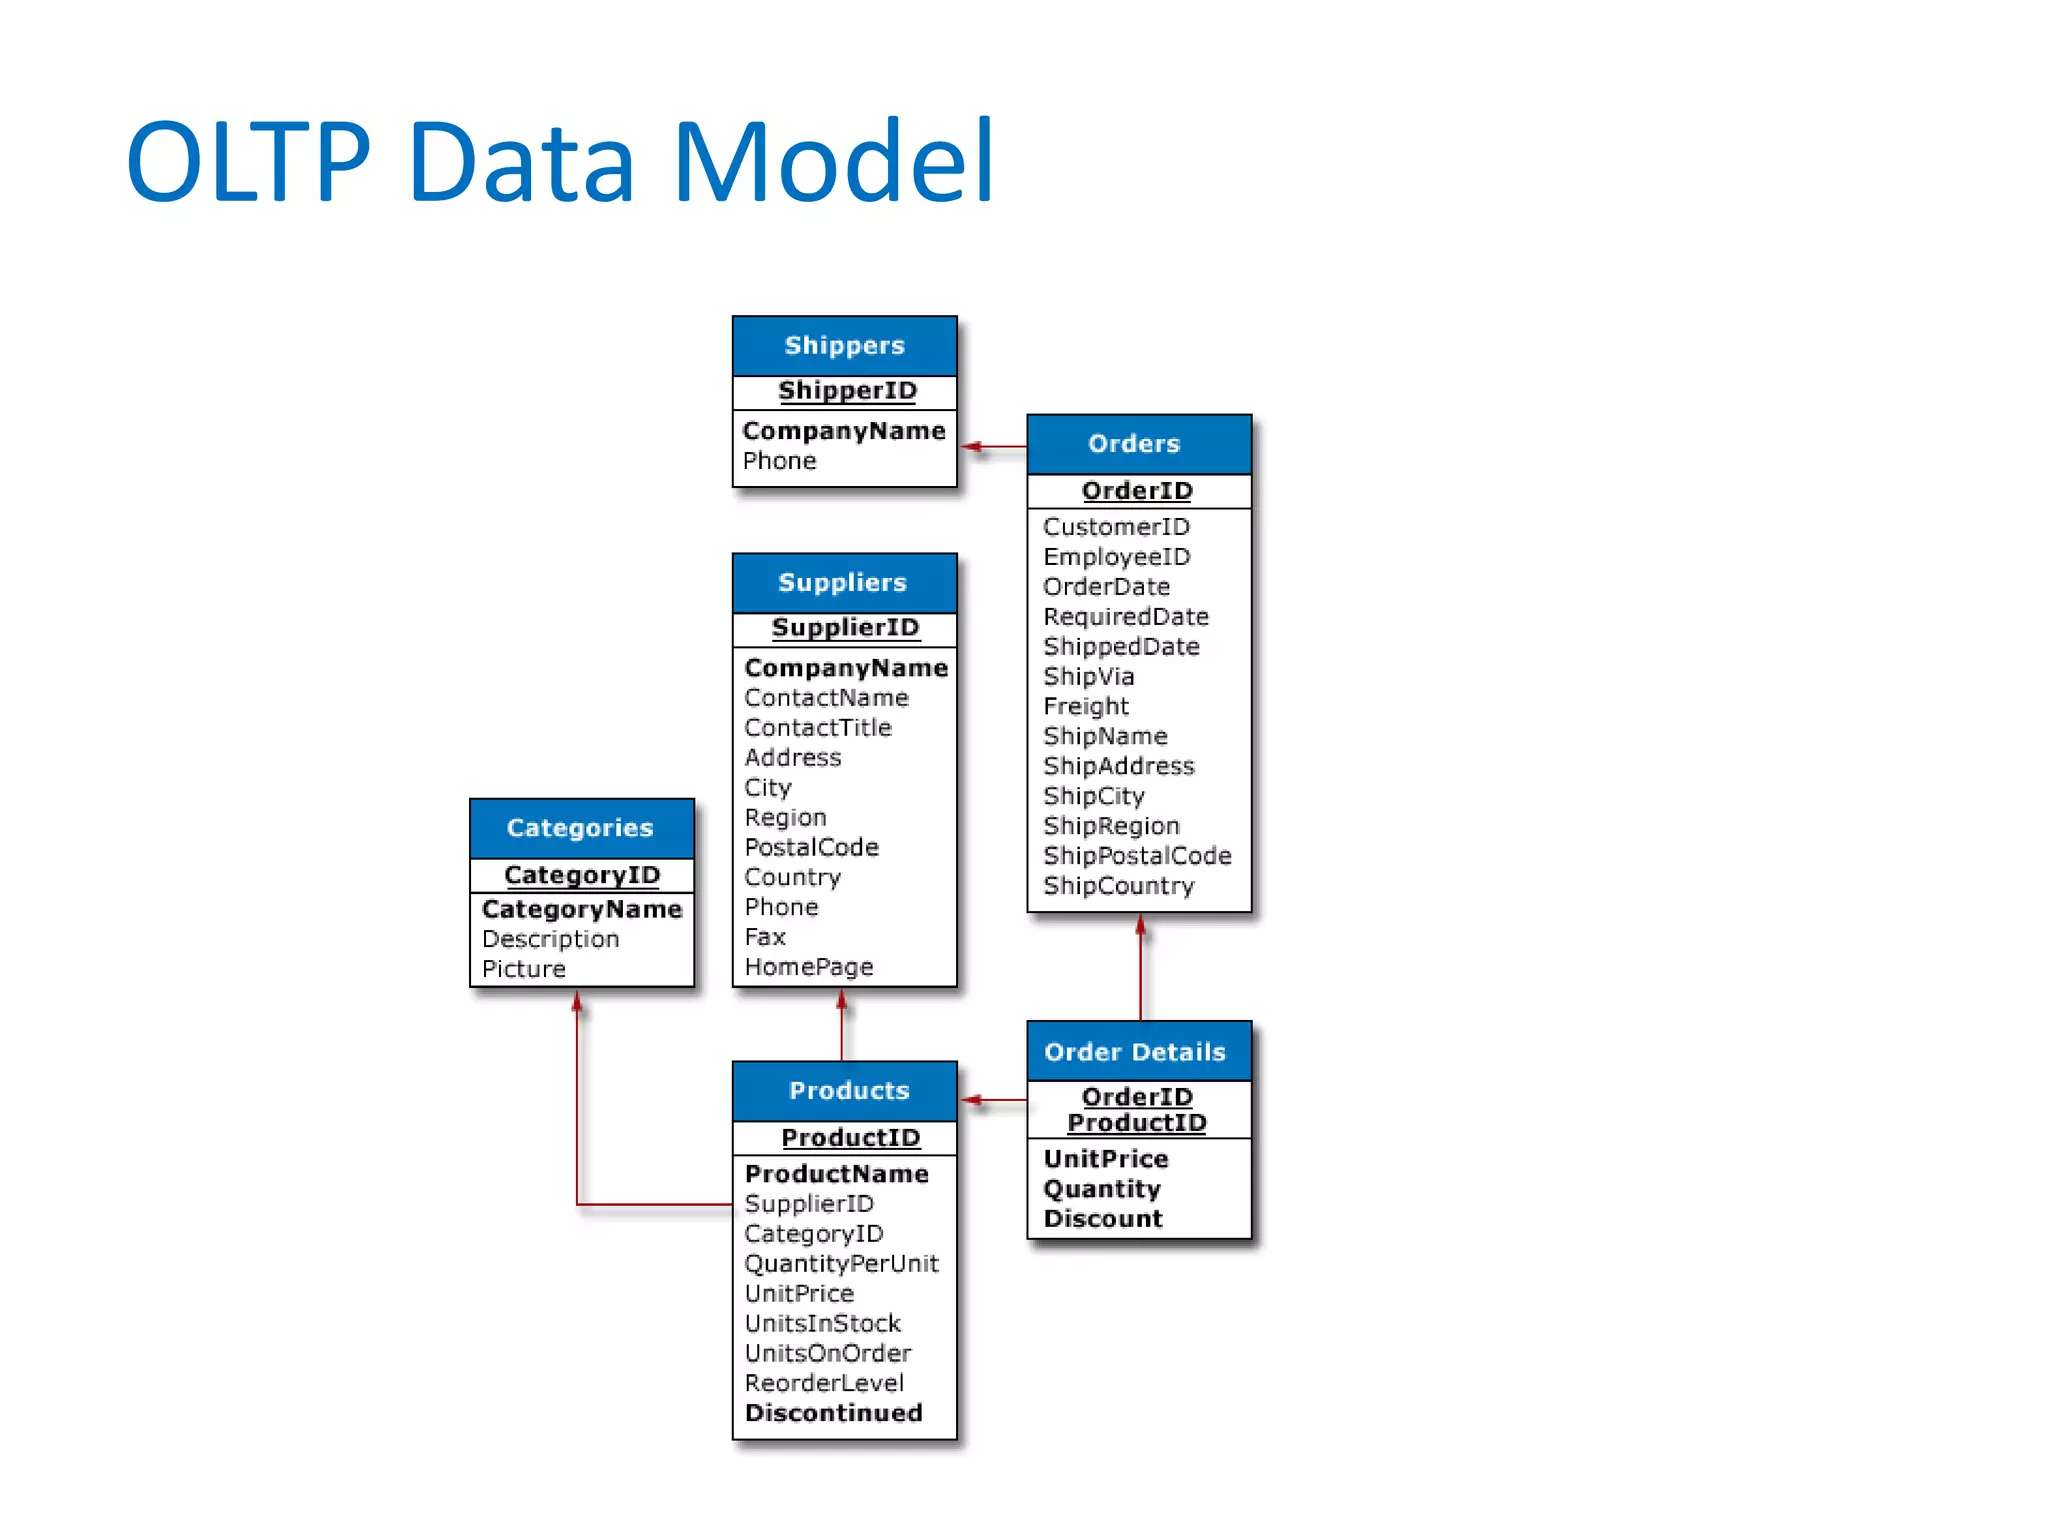
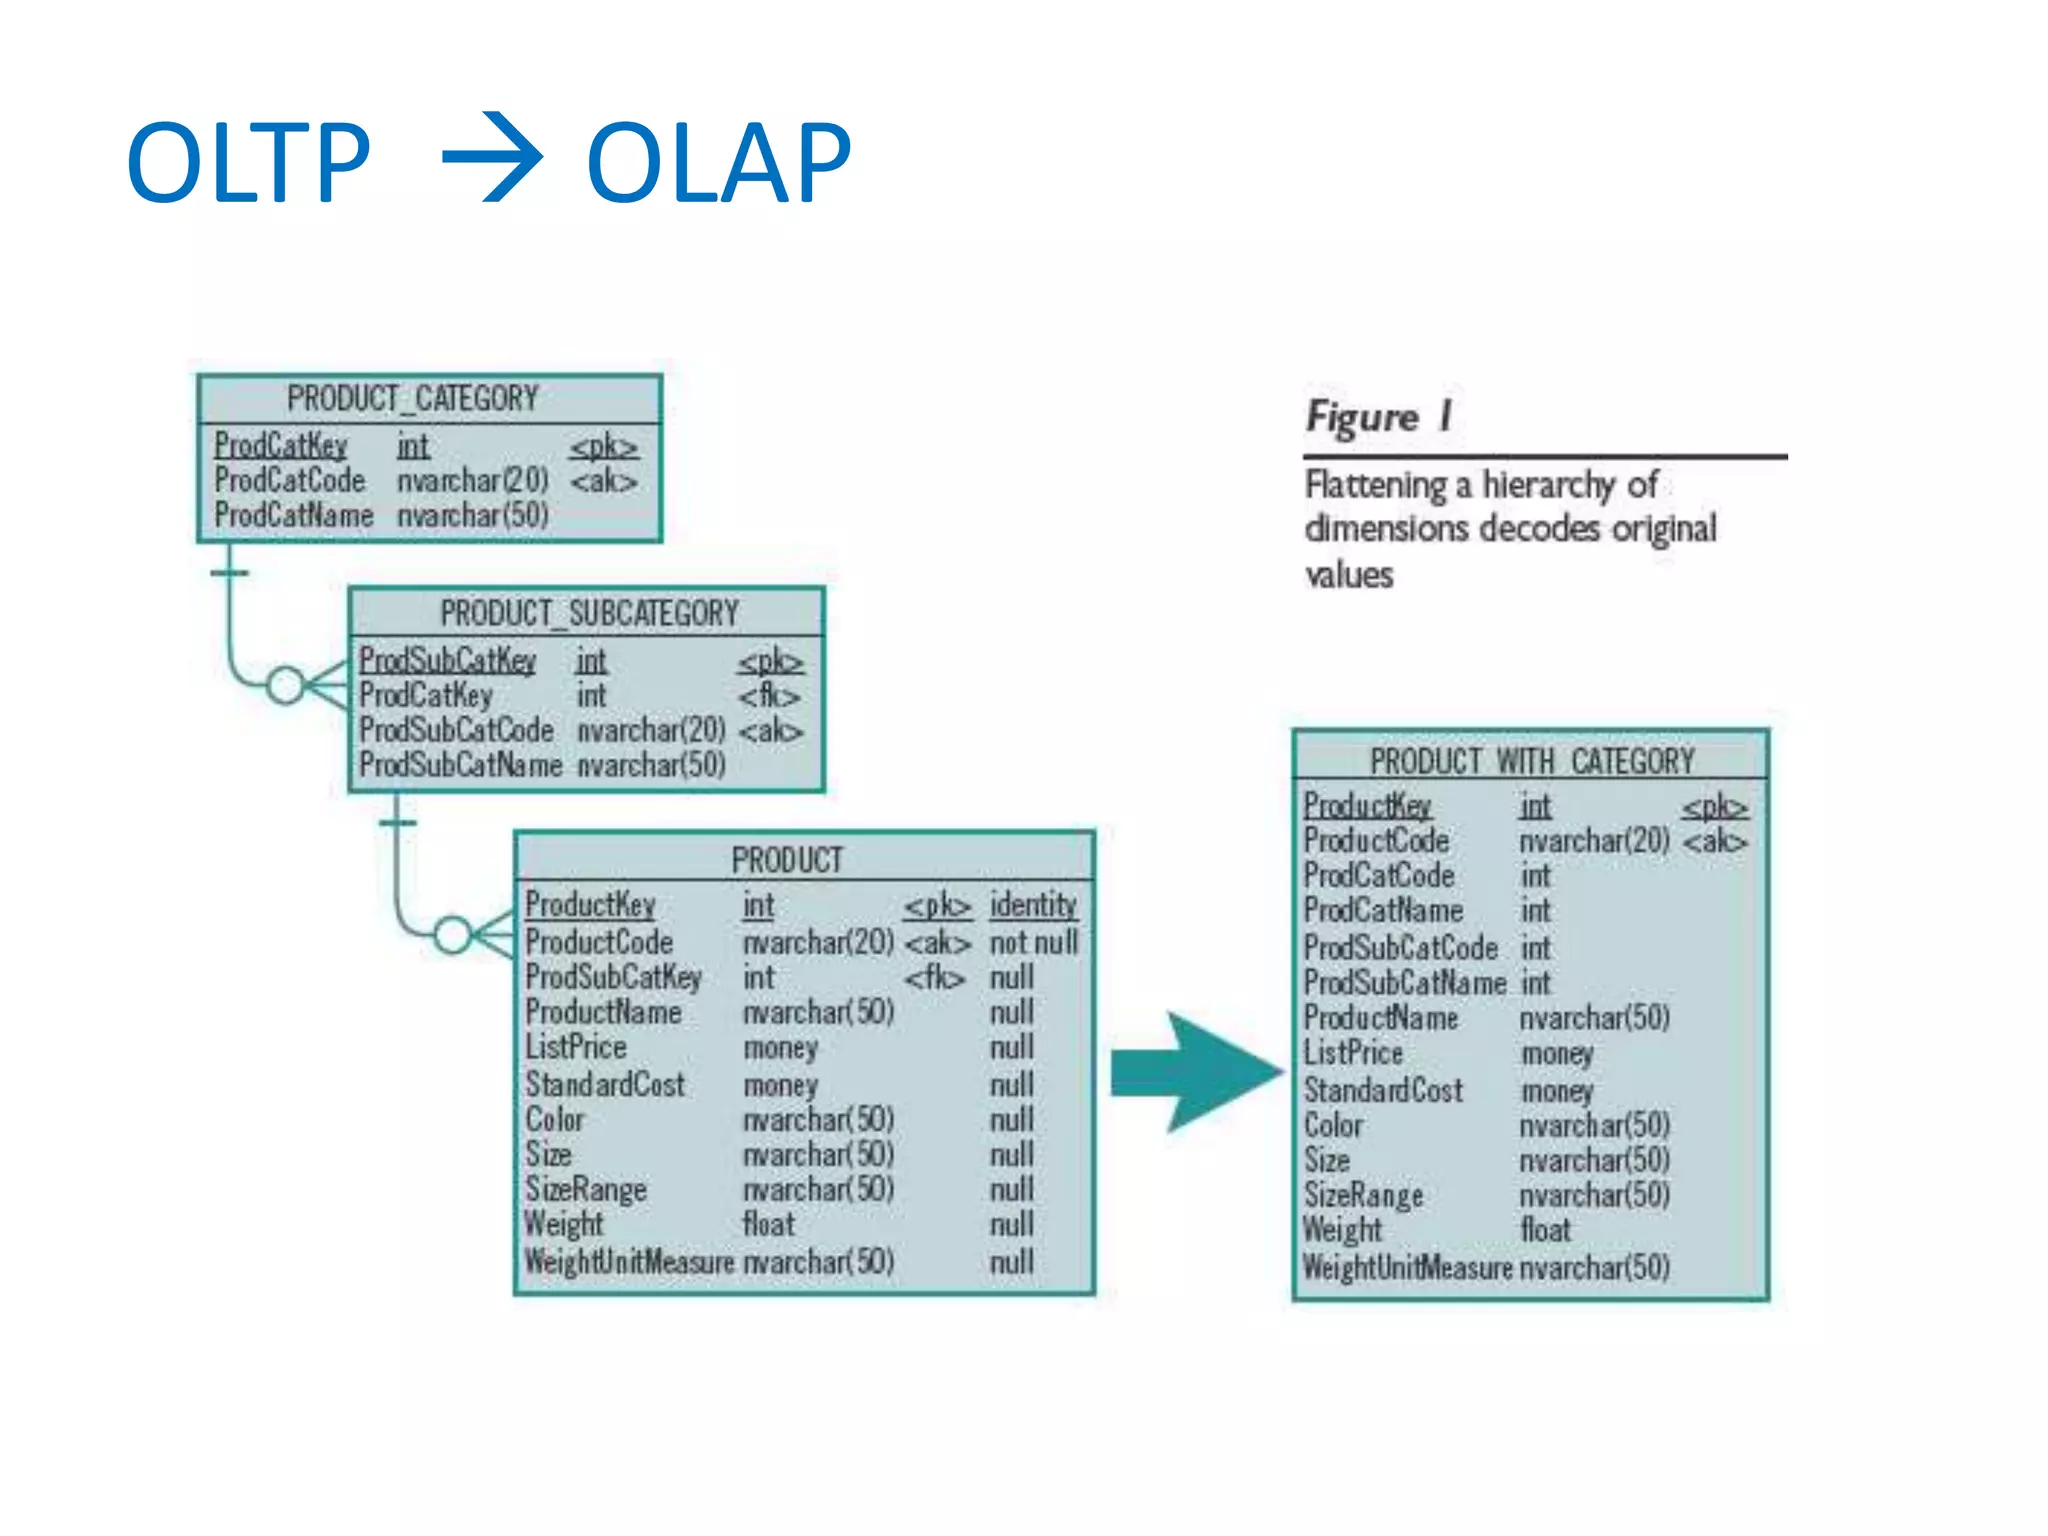

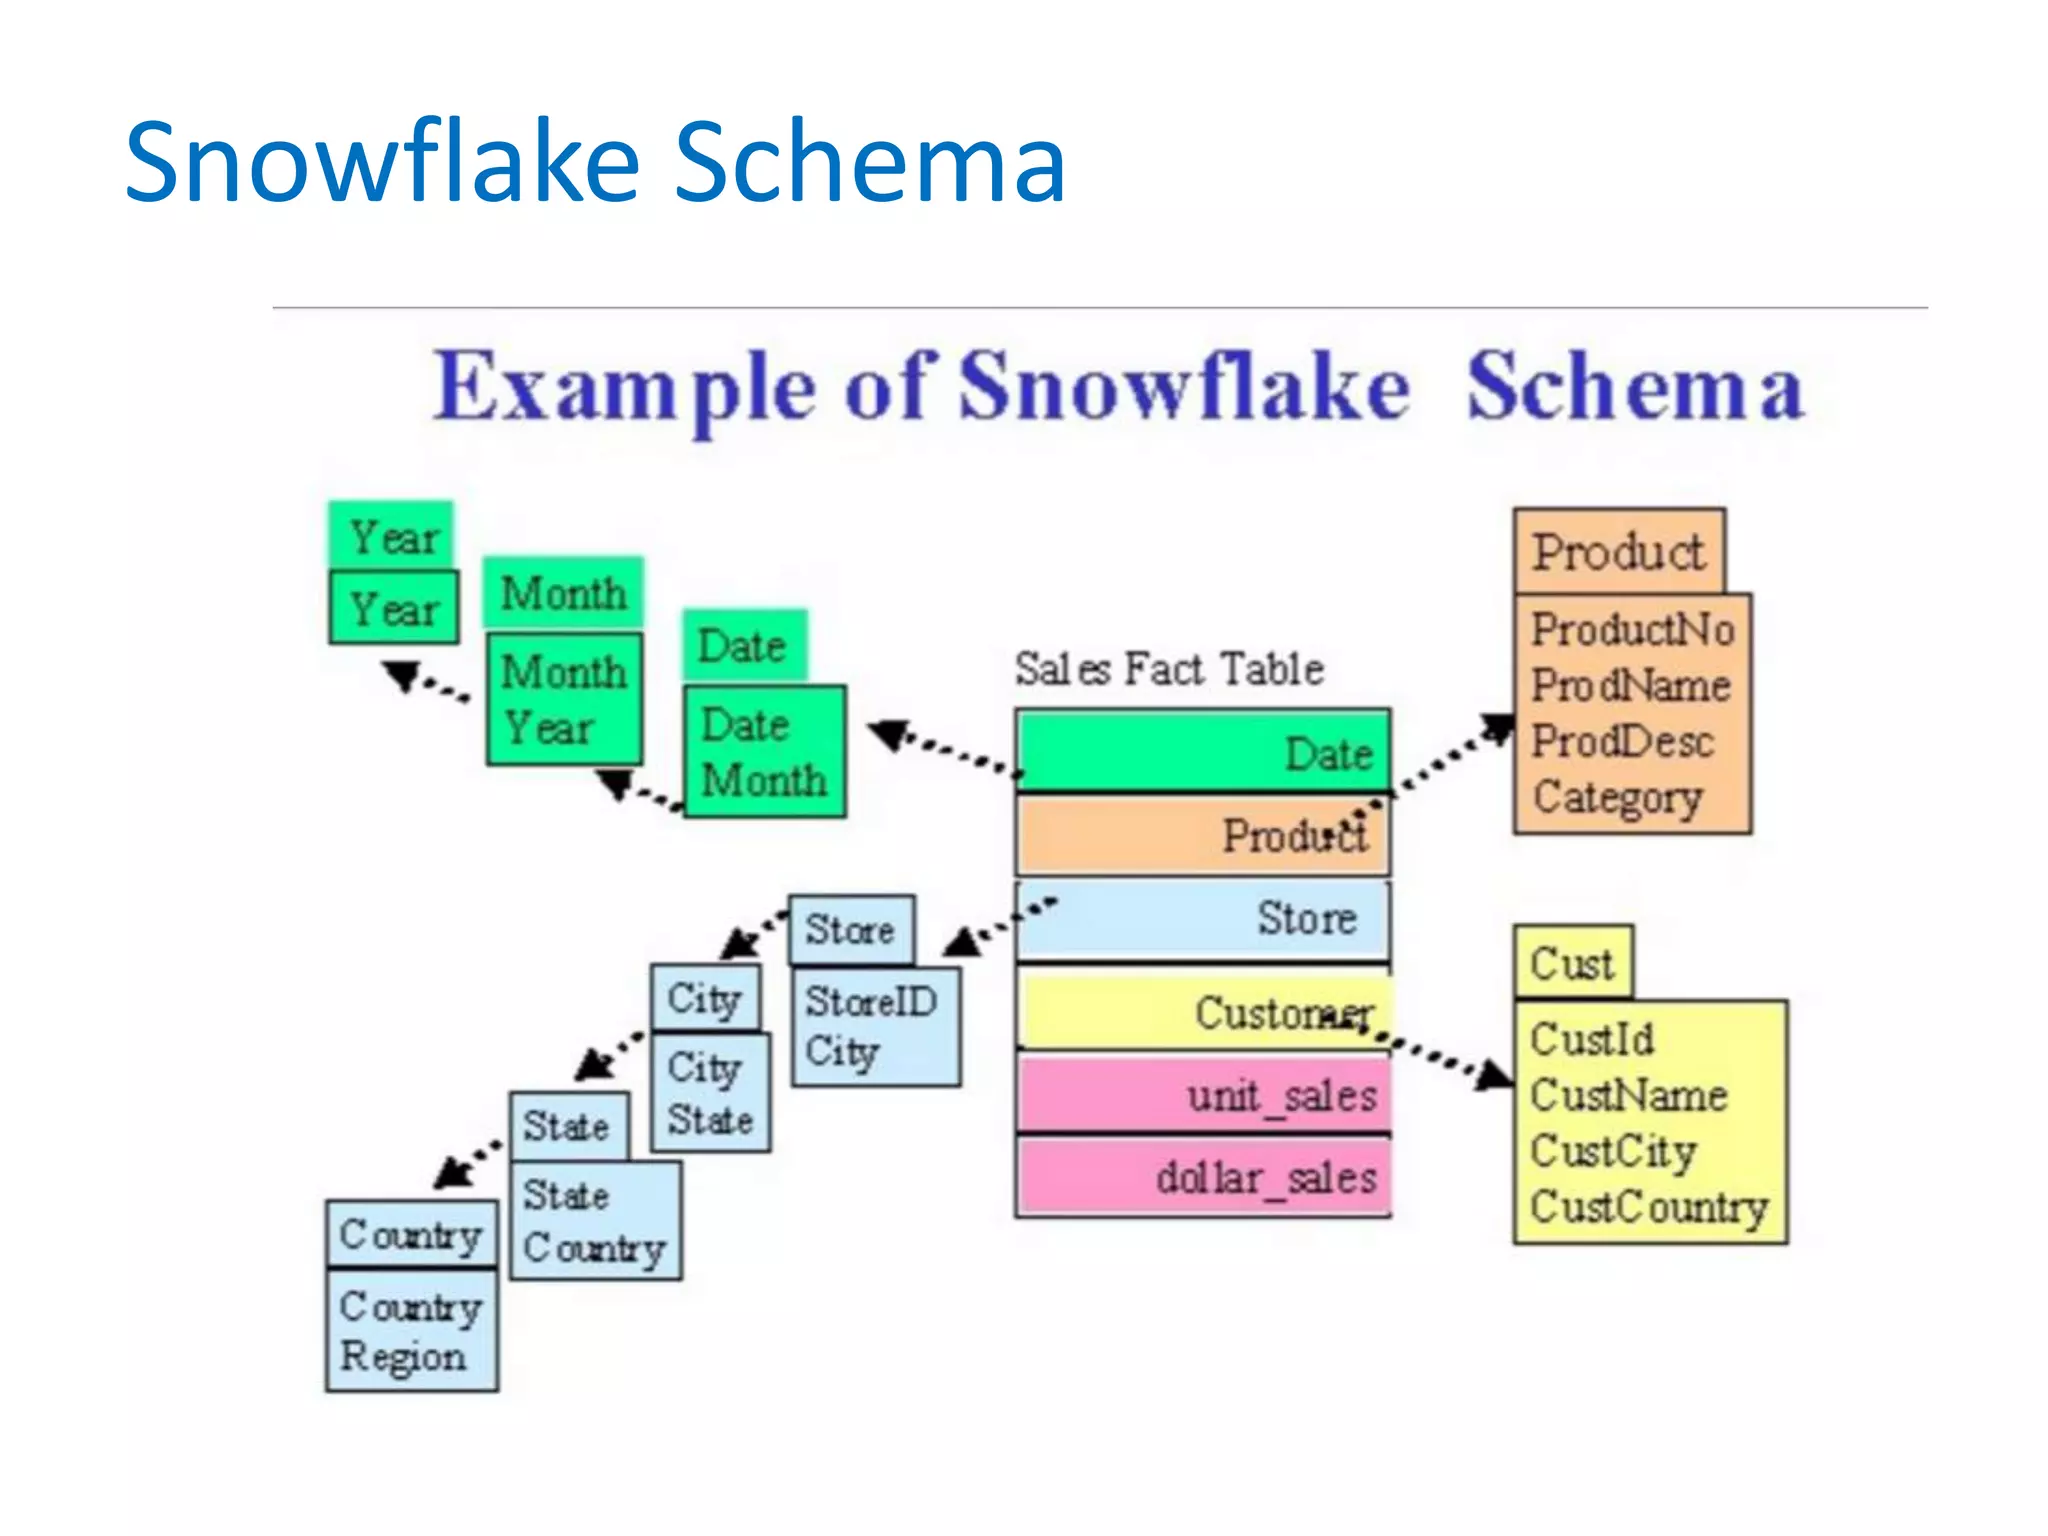
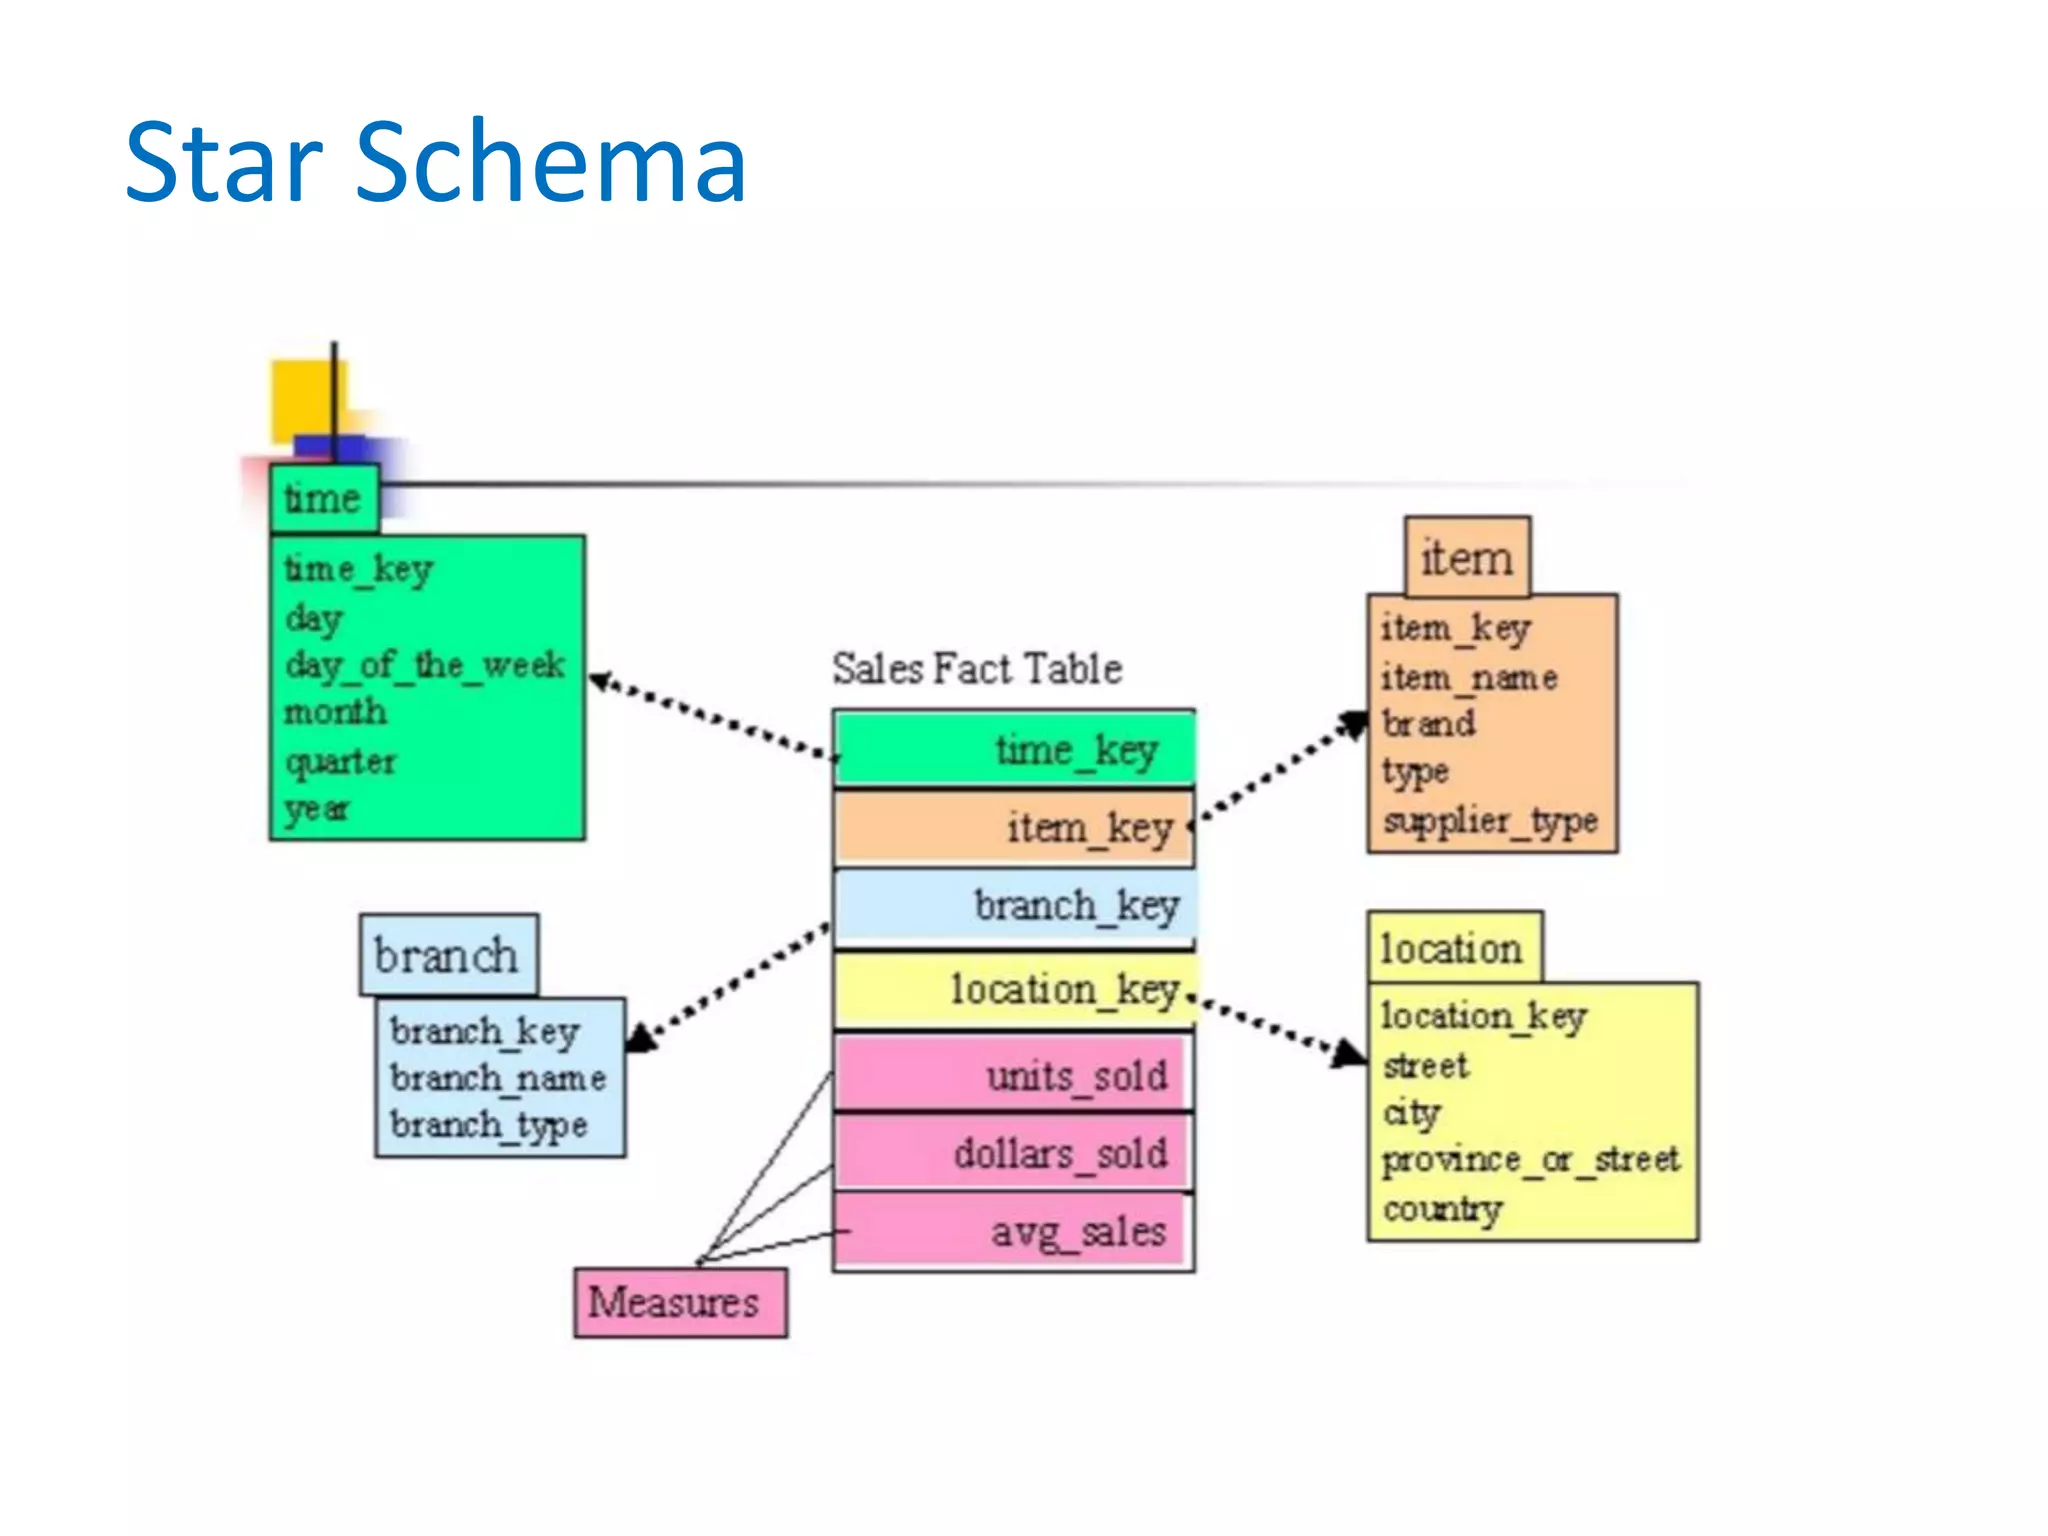

This document provides an overview of key concepts related to data warehousing including: - It defines data warehousing and lists some of its key components like dimensional data modeling, star and snowflake schemas, and slowly changing dimensions. - It also discusses conceptual, logical, and physical data models and how they relate to each other. - Finally, it briefly introduces the concepts of data integrity, OLAP, and different OLAP server types like MOLAP, ROLAP, and HOLAP.


