Download to read offline
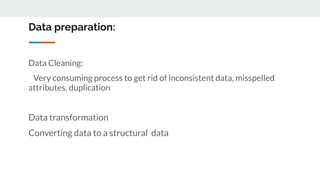
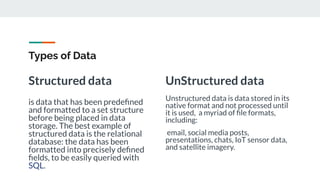
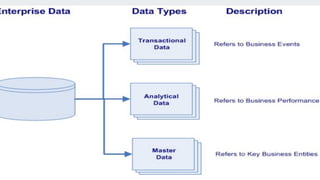
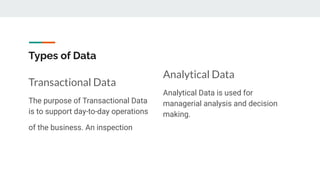
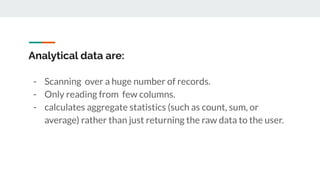
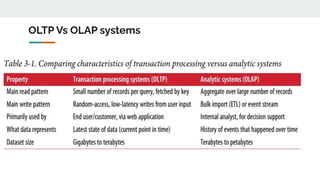


The document provides an overview of data analysis, detailing its types, roles, and key concepts such as data preparation, structured and unstructured data, and the differences between OLTP and OLAP systems. It emphasizes the importance of analytical tools and methods in transforming data into actionable insights for decision-making, including the use of data warehouses and summary tables for efficient data handling. Additionally, it discusses challenges and strategies for data visualization and embedding in SaaS applications.