The document outlines a Salesforce-based project called 'Help in Need,' aimed at improving customer relationship management for a service organization. It describes the business's need for a platform that manages customer and service data, allowing users to order various assistance services while automating notifications and payments. The project emphasizes analytical reporting to enhance decision-making and optimize service delivery based on customer demands.
Introduction to the Salesforce project by Siddharth Chaudhary for Help in Need, focusing on data analytics.
Discussion on the importance of data analysis in CRM; introduction of Help in Need to provide various services for managing daily activities.
Details on customer data management, order processes, and services offered; information architecture including customers, workers, services, and orders.
Information on order details and business rules ensuring customer data collection and order processing in Salesforce.
Technical overview of workflow rules for order confirmation and error validation in service requests.
Overview of Salesforce tabs for managing services, orders, and generating reports; highlighting business benefits like analytical targeting.
Visual examples of Salesforce pages, including order processing and email confirmation templates.
Details on customer and worker record types created in Salesforce, showcasing data entries for both.
Information on custom objects created for services and orders in Salesforce with associated costs.
Discussion on validation rules for order date entries and formulae for calculating service costs.
Process of importing data and utilizing reports and dashboards for business insights and performance analysis.
Conclusions drawn from reports, emphasizing the role of Salesforce in enhancing business performance and customer relations.
SALESFORCE PROJECT
On
HELP inNEED
By:Siddharth Chaudhary
X16137001
MSc in Data Analytics
National College of Ireland
2.
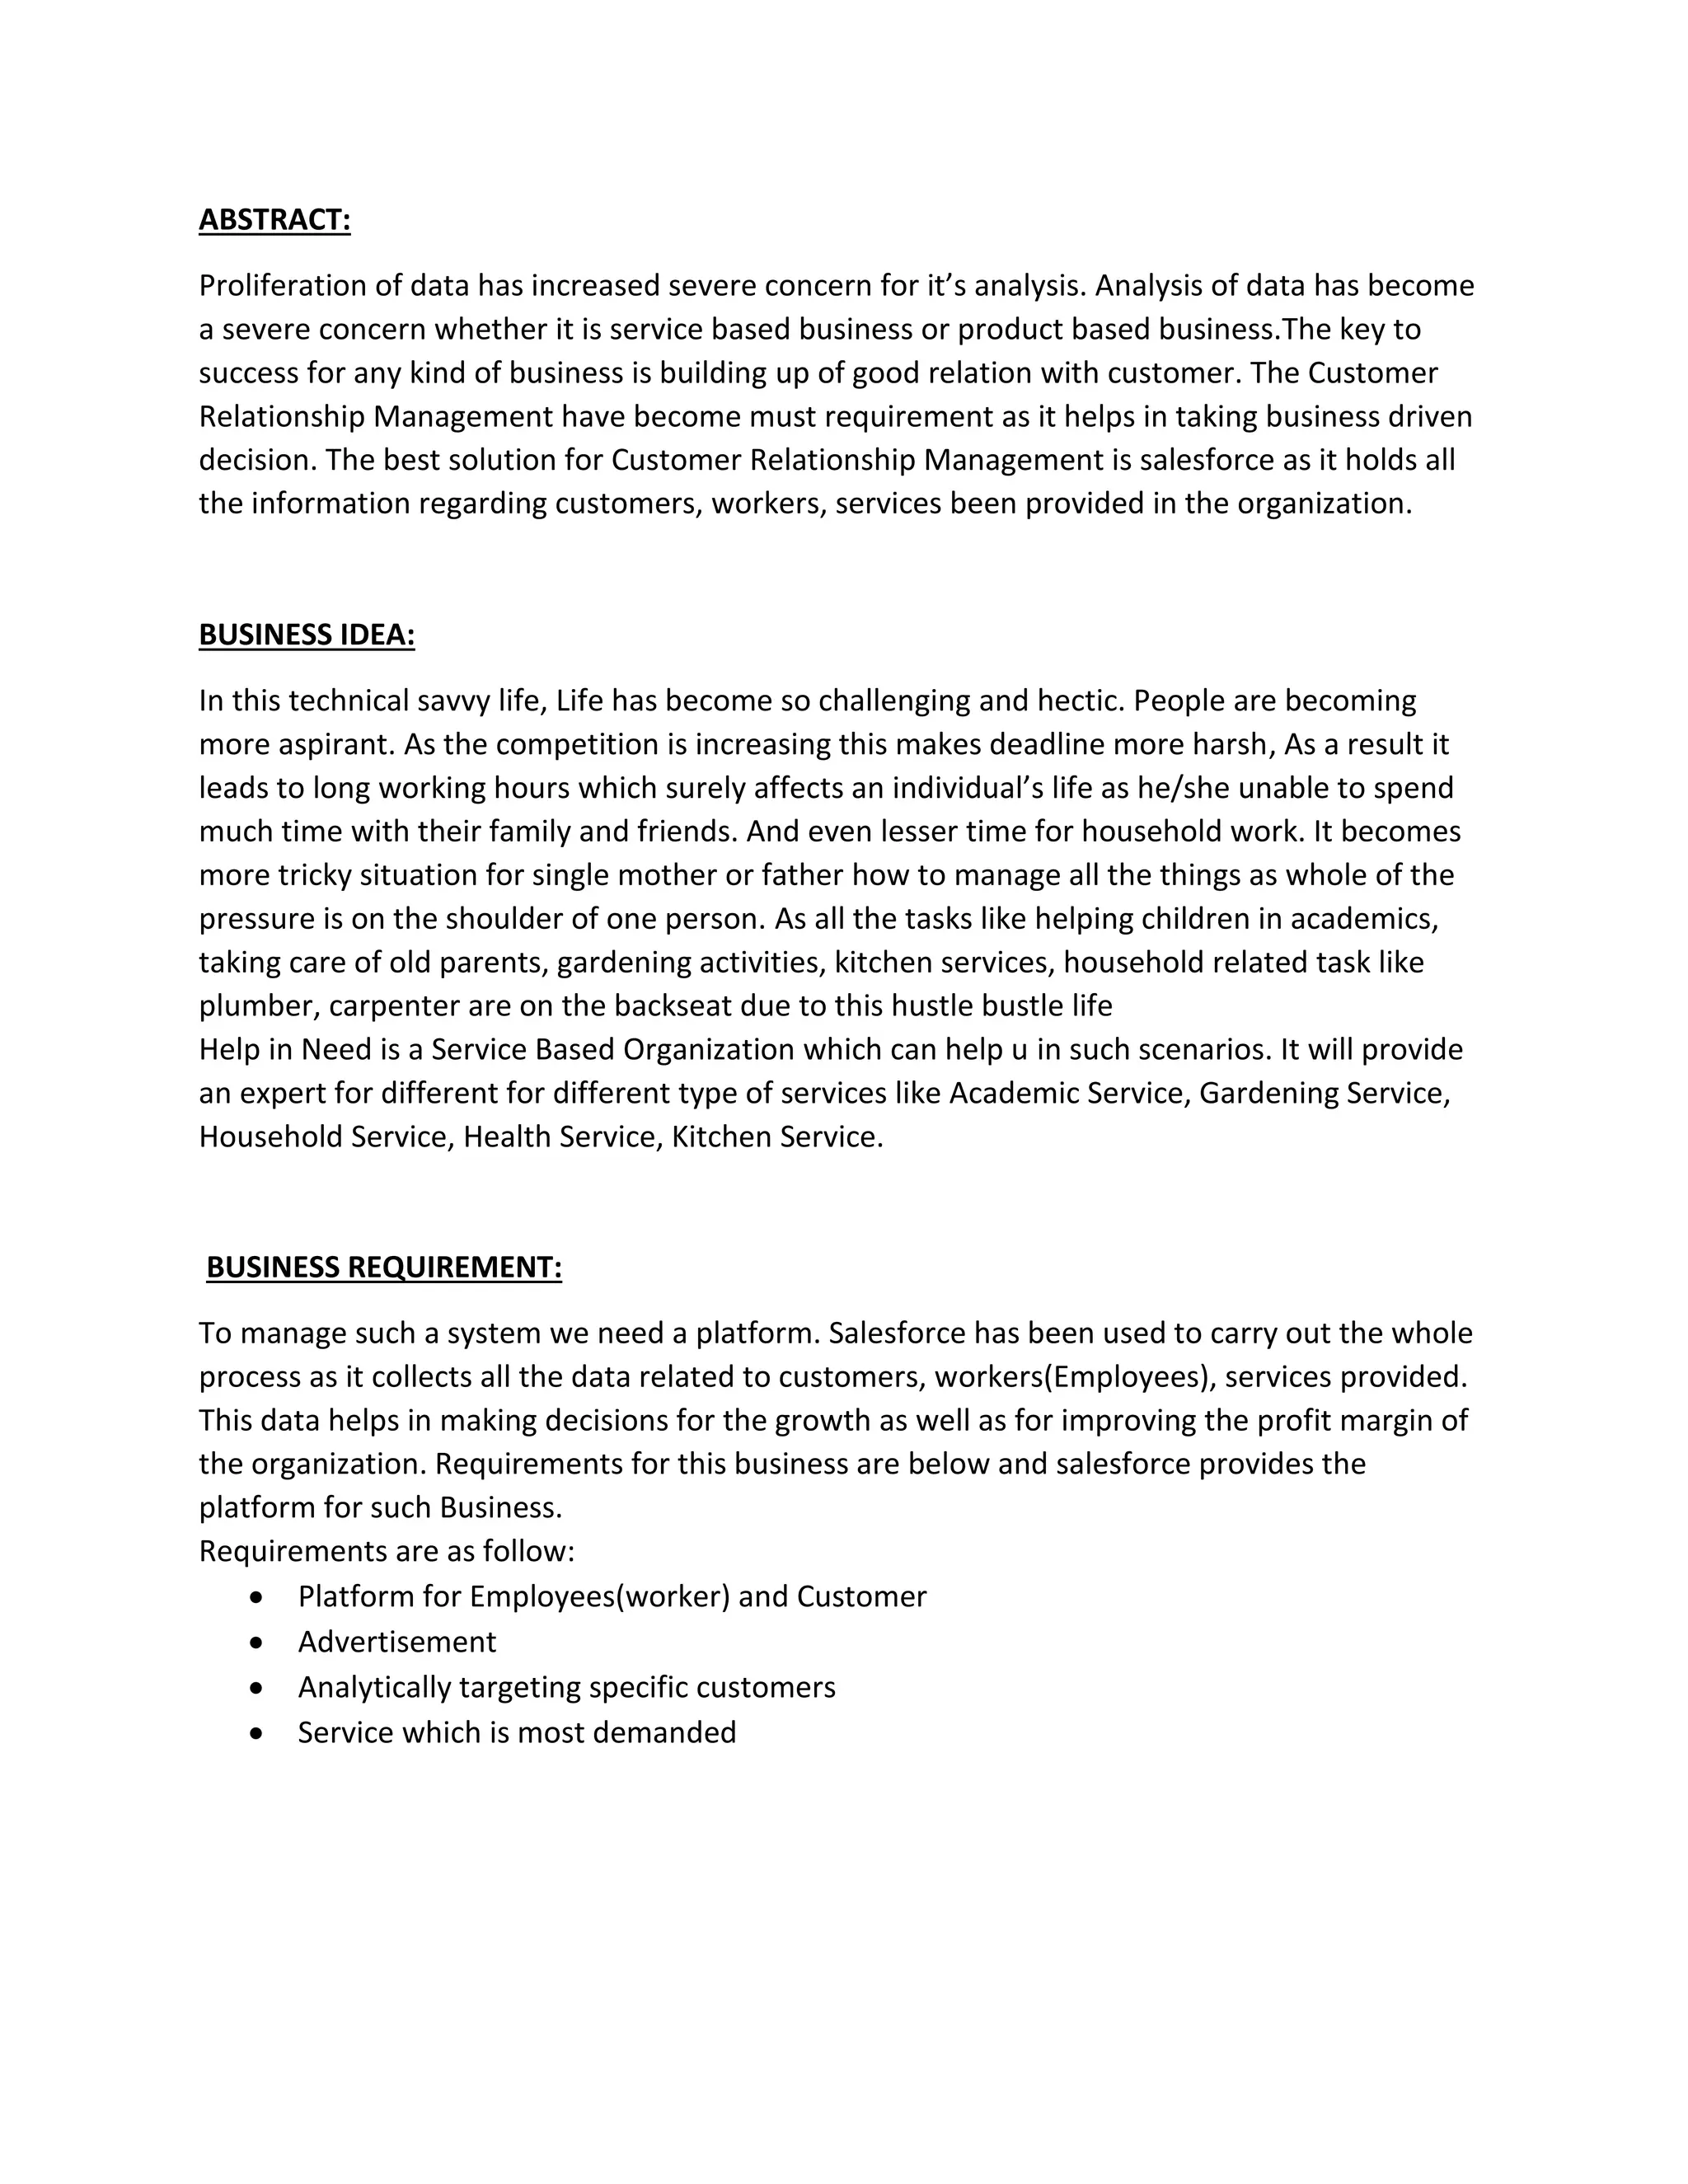
ABSTRACT:
Proliferation of datahas increased severe concern for it’s analysis. Analysis of data has become
a severe concern whether it is service based business or product based business.The key to
success for any kind of business is building up of good relation with customer. The Customer
Relationship Management have become must requirement as it helps in taking business driven
decision. The best solution for Customer Relationship Management is salesforce as it holds all
the information regarding customers, workers, services been provided in the organization.
BUSINESS IDEA:
In this technical savvy life, Life has become so challenging and hectic. People are becoming
more aspirant. As the competition is increasing this makes deadline more harsh, As a result it
leads to long working hours which surely affects an individual’s life as he/she unable to spend
much time with their family and friends. And even lesser time for household work. It becomes
more tricky situation for single mother or father how to manage all the things as whole of the
pressure is on the shoulder of one person. As all the tasks like helping children in academics,
taking care of old parents, gardening activities, kitchen services, household related task like
plumber, carpenter are on the backseat due to this hustle bustle life
Help in Need is a Service Based Organization which can help u in such scenarios. It will provide
an expert for different for different type of services like Academic Service, Gardening Service,
Household Service, Health Service, Kitchen Service.
BUSINESS REQUIREMENT:
To manage such a system we need a platform. Salesforce has been used to carry out the whole
process as it collects all the data related to customers, workers(Employees), services provided.
This data helps in making decisions for the growth as well as for improving the profit margin of
the organization. Requirements for this business are below and salesforce provides the
platform for such Business.
Requirements are as follow:
• Platform for Employees(worker) and Customer
• Advertisement
• Analytically targeting specific customers
• Service which is most demanded
3.
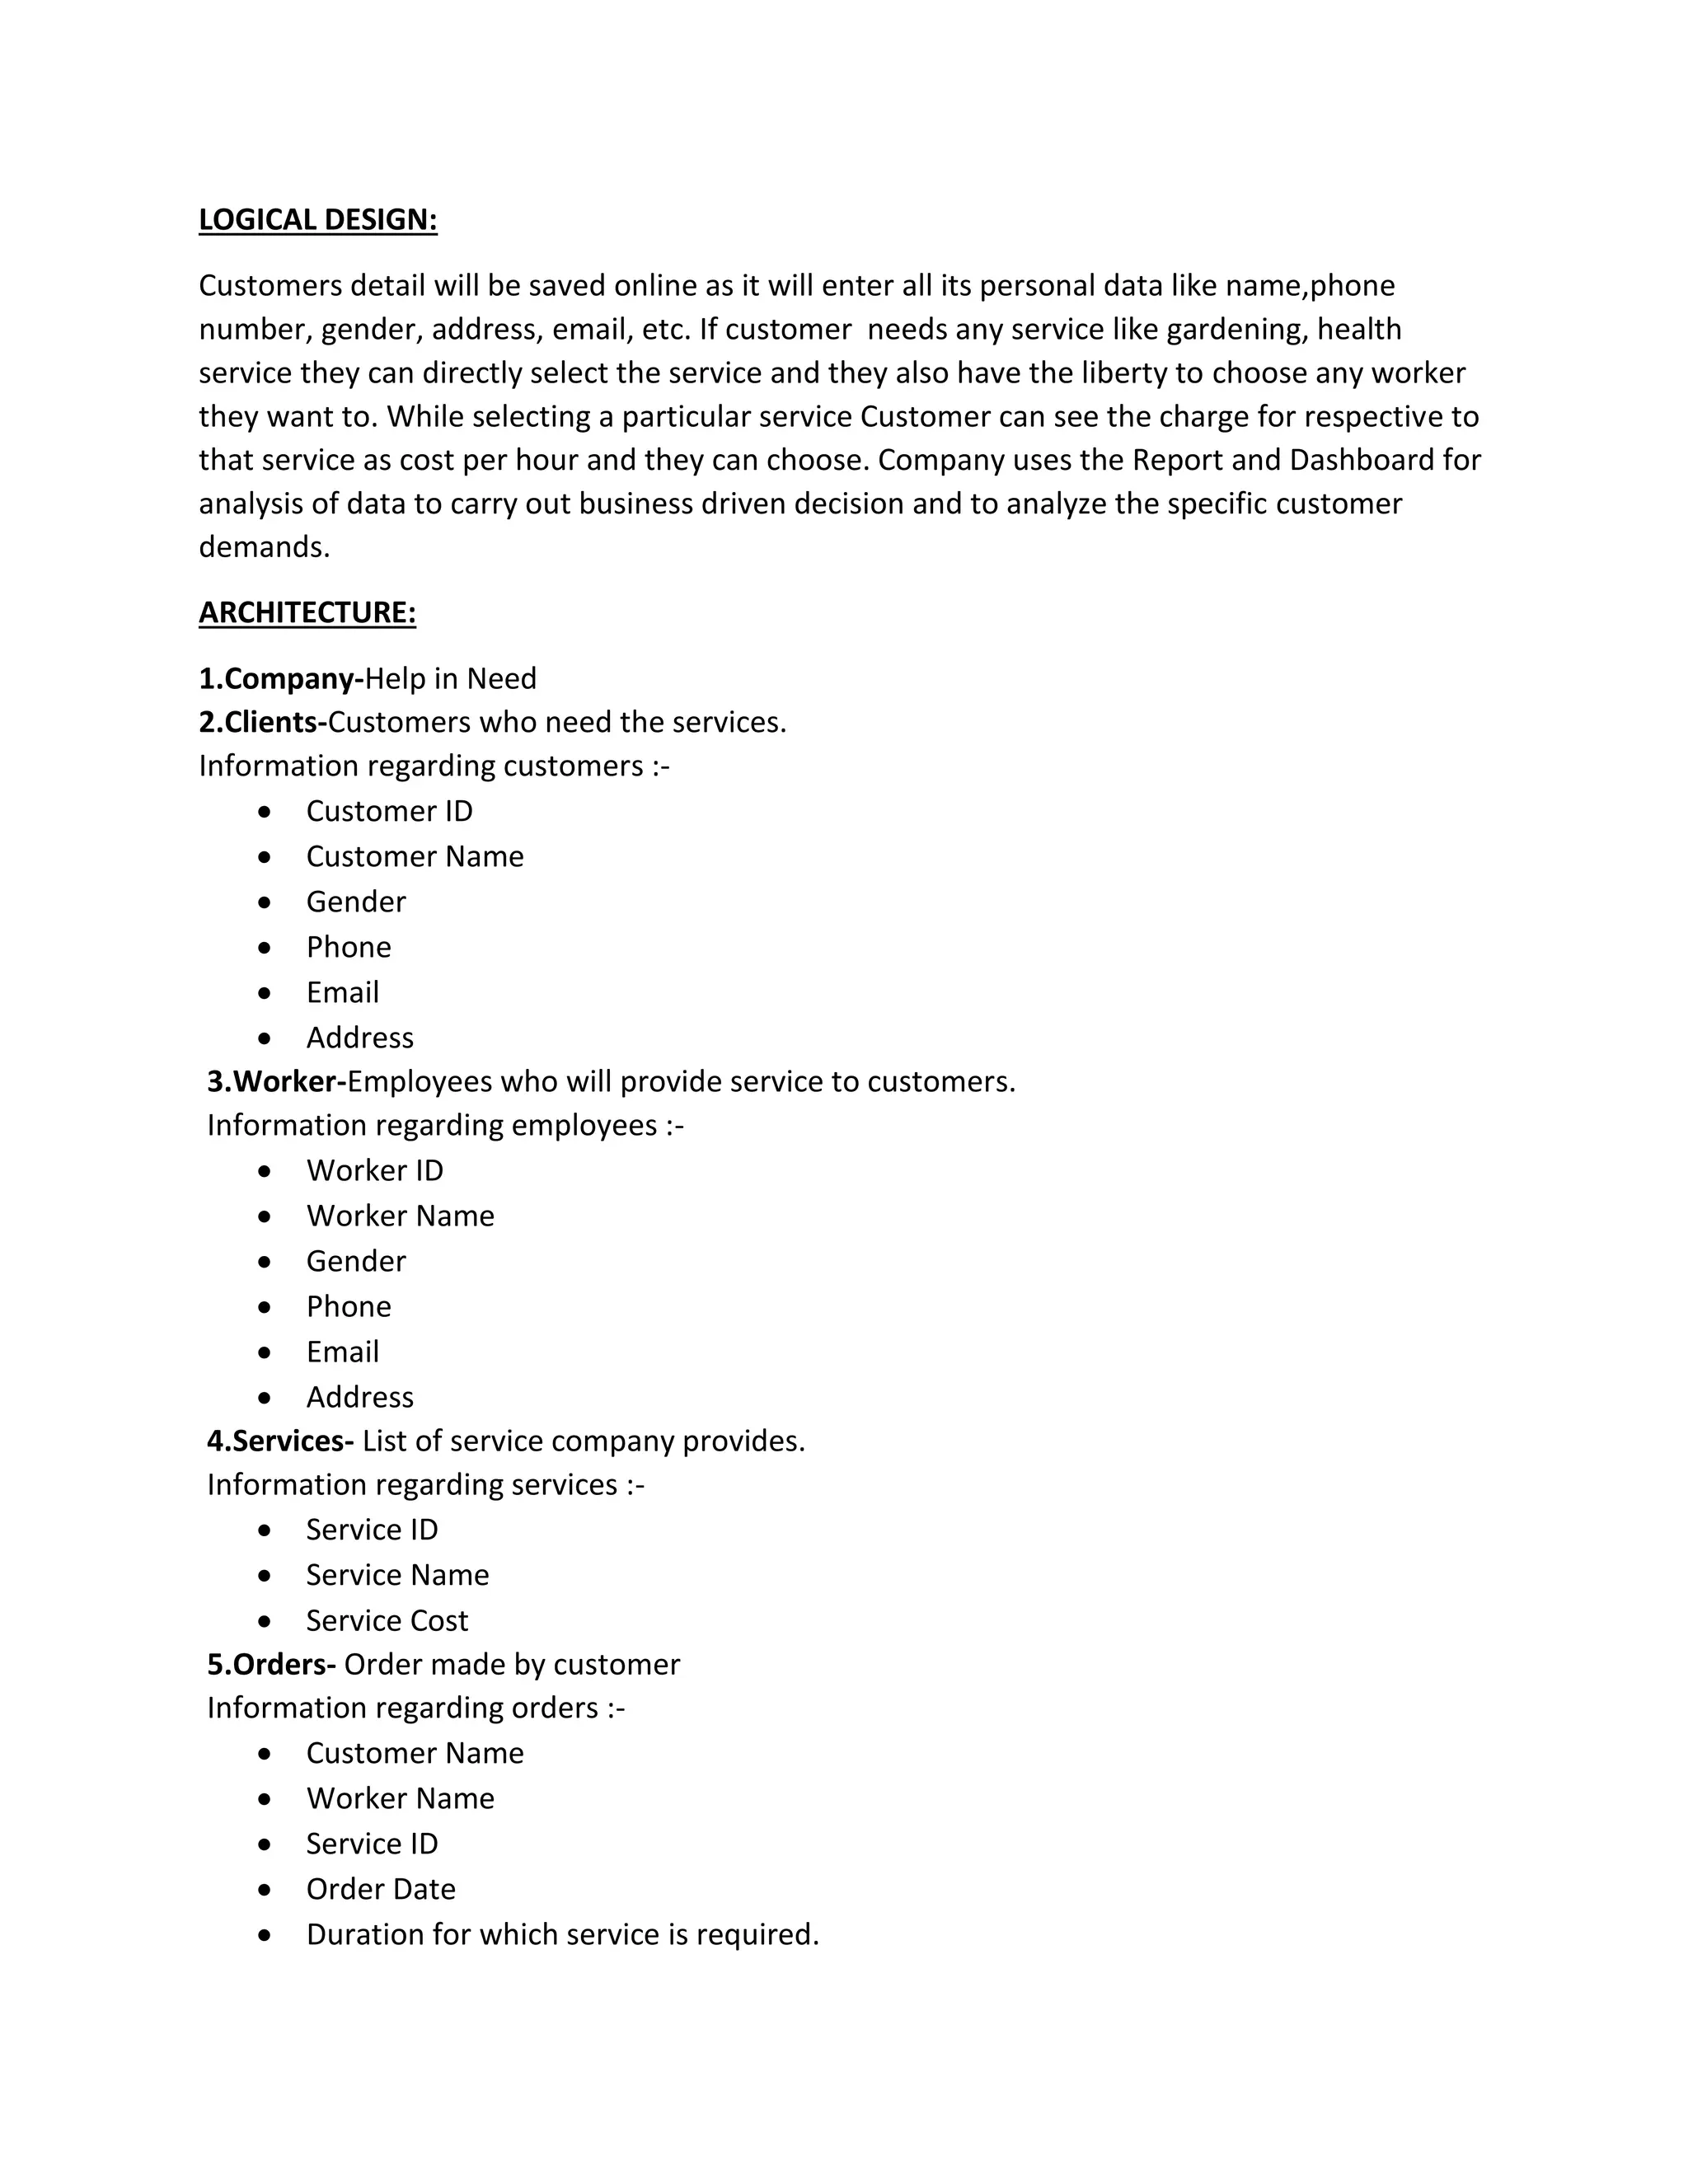
LOGICAL DESIGN:
Customers detailwill be saved online as it will enter all its personal data like name,phone
number, gender, address, email, etc. If customer needs any service like gardening, health
service they can directly select the service and they also have the liberty to choose any worker
they want to. While selecting a particular service Customer can see the charge for respective to
that service as cost per hour and they can choose. Company uses the Report and Dashboard for
analysis of data to carry out business driven decision and to analyze the specific customer
demands.
ARCHITECTURE:
1.Company-Help in Need
2.Clients-Customers who need the services.
Information regarding customers :-
• Customer ID
• Customer Name
• Gender
• Phone
• Email
• Address
3.Worker-Employees who will provide service to customers.
Information regarding employees :-
• Worker ID
• Worker Name
• Gender
• Phone
• Email
• Address
4.Services- List of service company provides.
Information regarding services :-
• Service ID
• Service Name
• Service Cost
5.Orders- Order made by customer
Information regarding orders :-
• Customer Name
• Worker Name
• Service ID
• Order Date
• Duration for which service is required.
4.
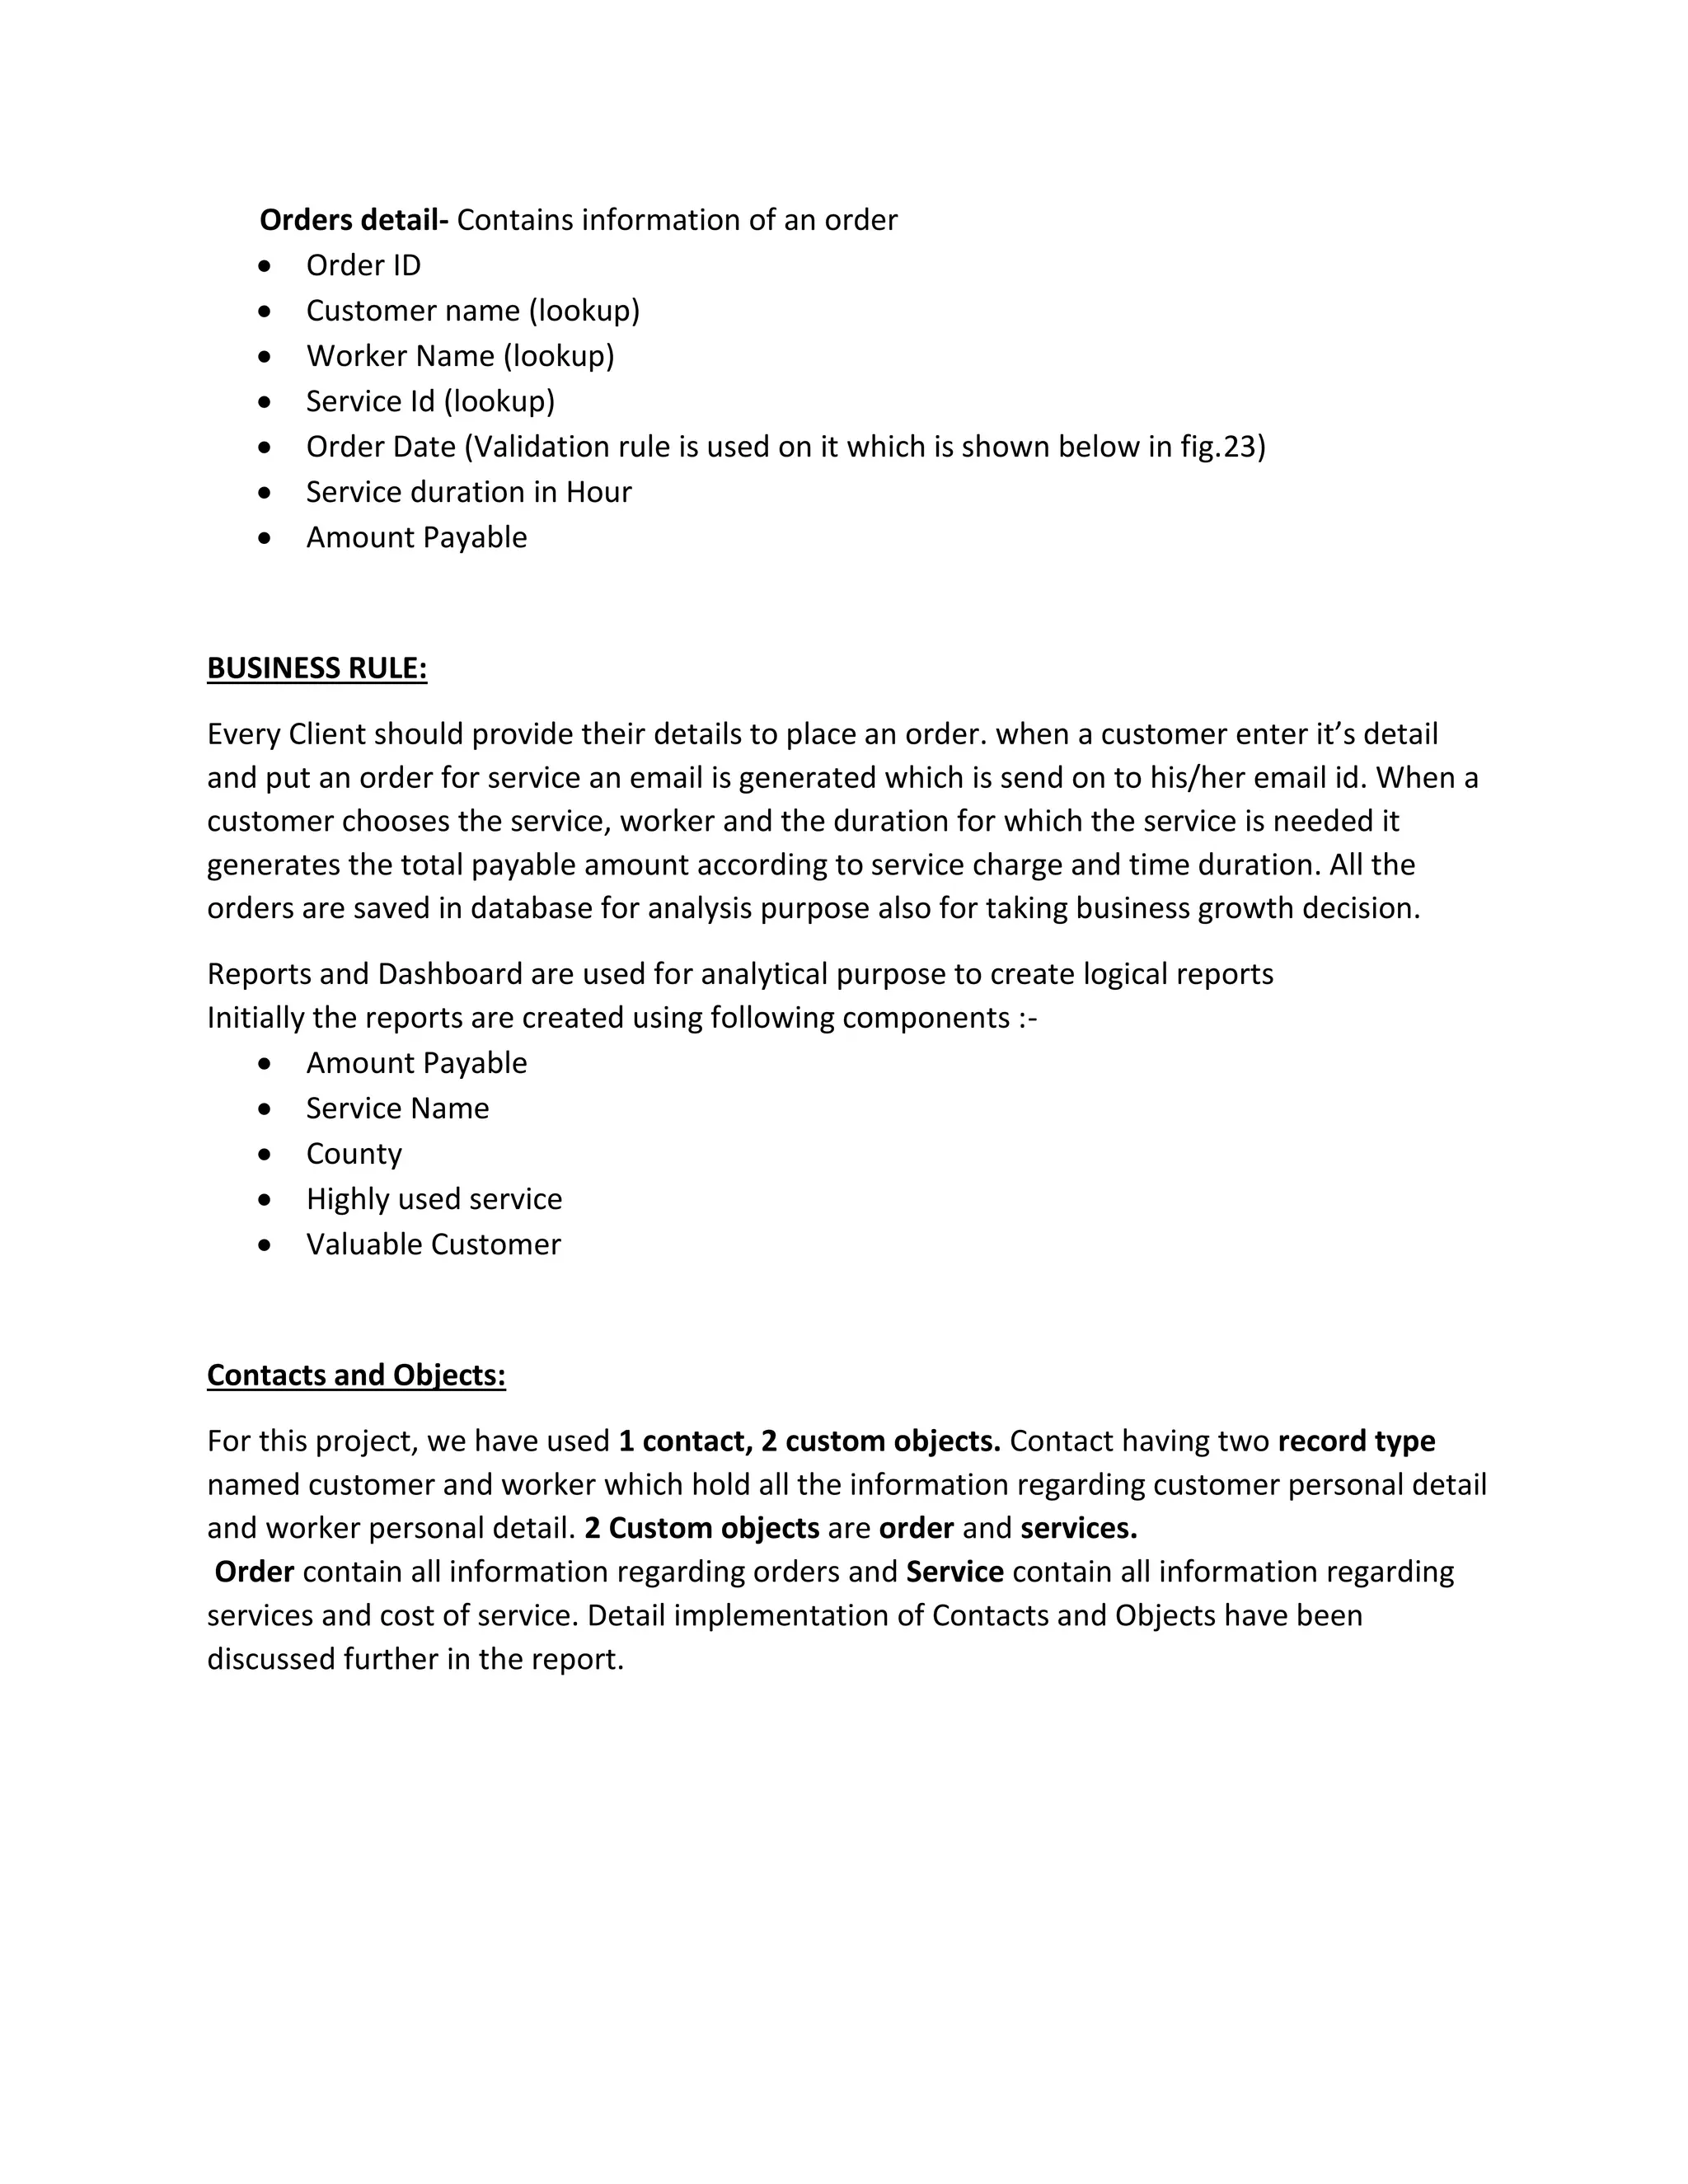
Orders detail- Containsinformation of an order
• Order ID
• Customer name (lookup)
• Worker Name (lookup)
• Service Id (lookup)
• Order Date (Validation rule is used on it which is shown below in fig.23)
• Service duration in Hour
• Amount Payable
BUSINESS RULE:
Every Client should provide their details to place an order. when a customer enter it’s detail
and put an order for service an email is generated which is send on to his/her email id. When a
customer chooses the service, worker and the duration for which the service is needed it
generates the total payable amount according to service charge and time duration. All the
orders are saved in database for analysis purpose also for taking business growth decision.
Reports and Dashboard are used for analytical purpose to create logical reports
Initially the reports are created using following components :-
• Amount Payable
• Service Name
• County
• Highly used service
• Valuable Customer
Contacts and Objects:
For this project, we have used 1 contact, 2 custom objects. Contact having two record type
named customer and worker which hold all the information regarding customer personal detail
and worker personal detail. 2 Custom objects are order and services.
Order contain all information regarding orders and Service contain all information regarding
services and cost of service. Detail implementation of Contacts and Objects have been
discussed further in the report.
5.
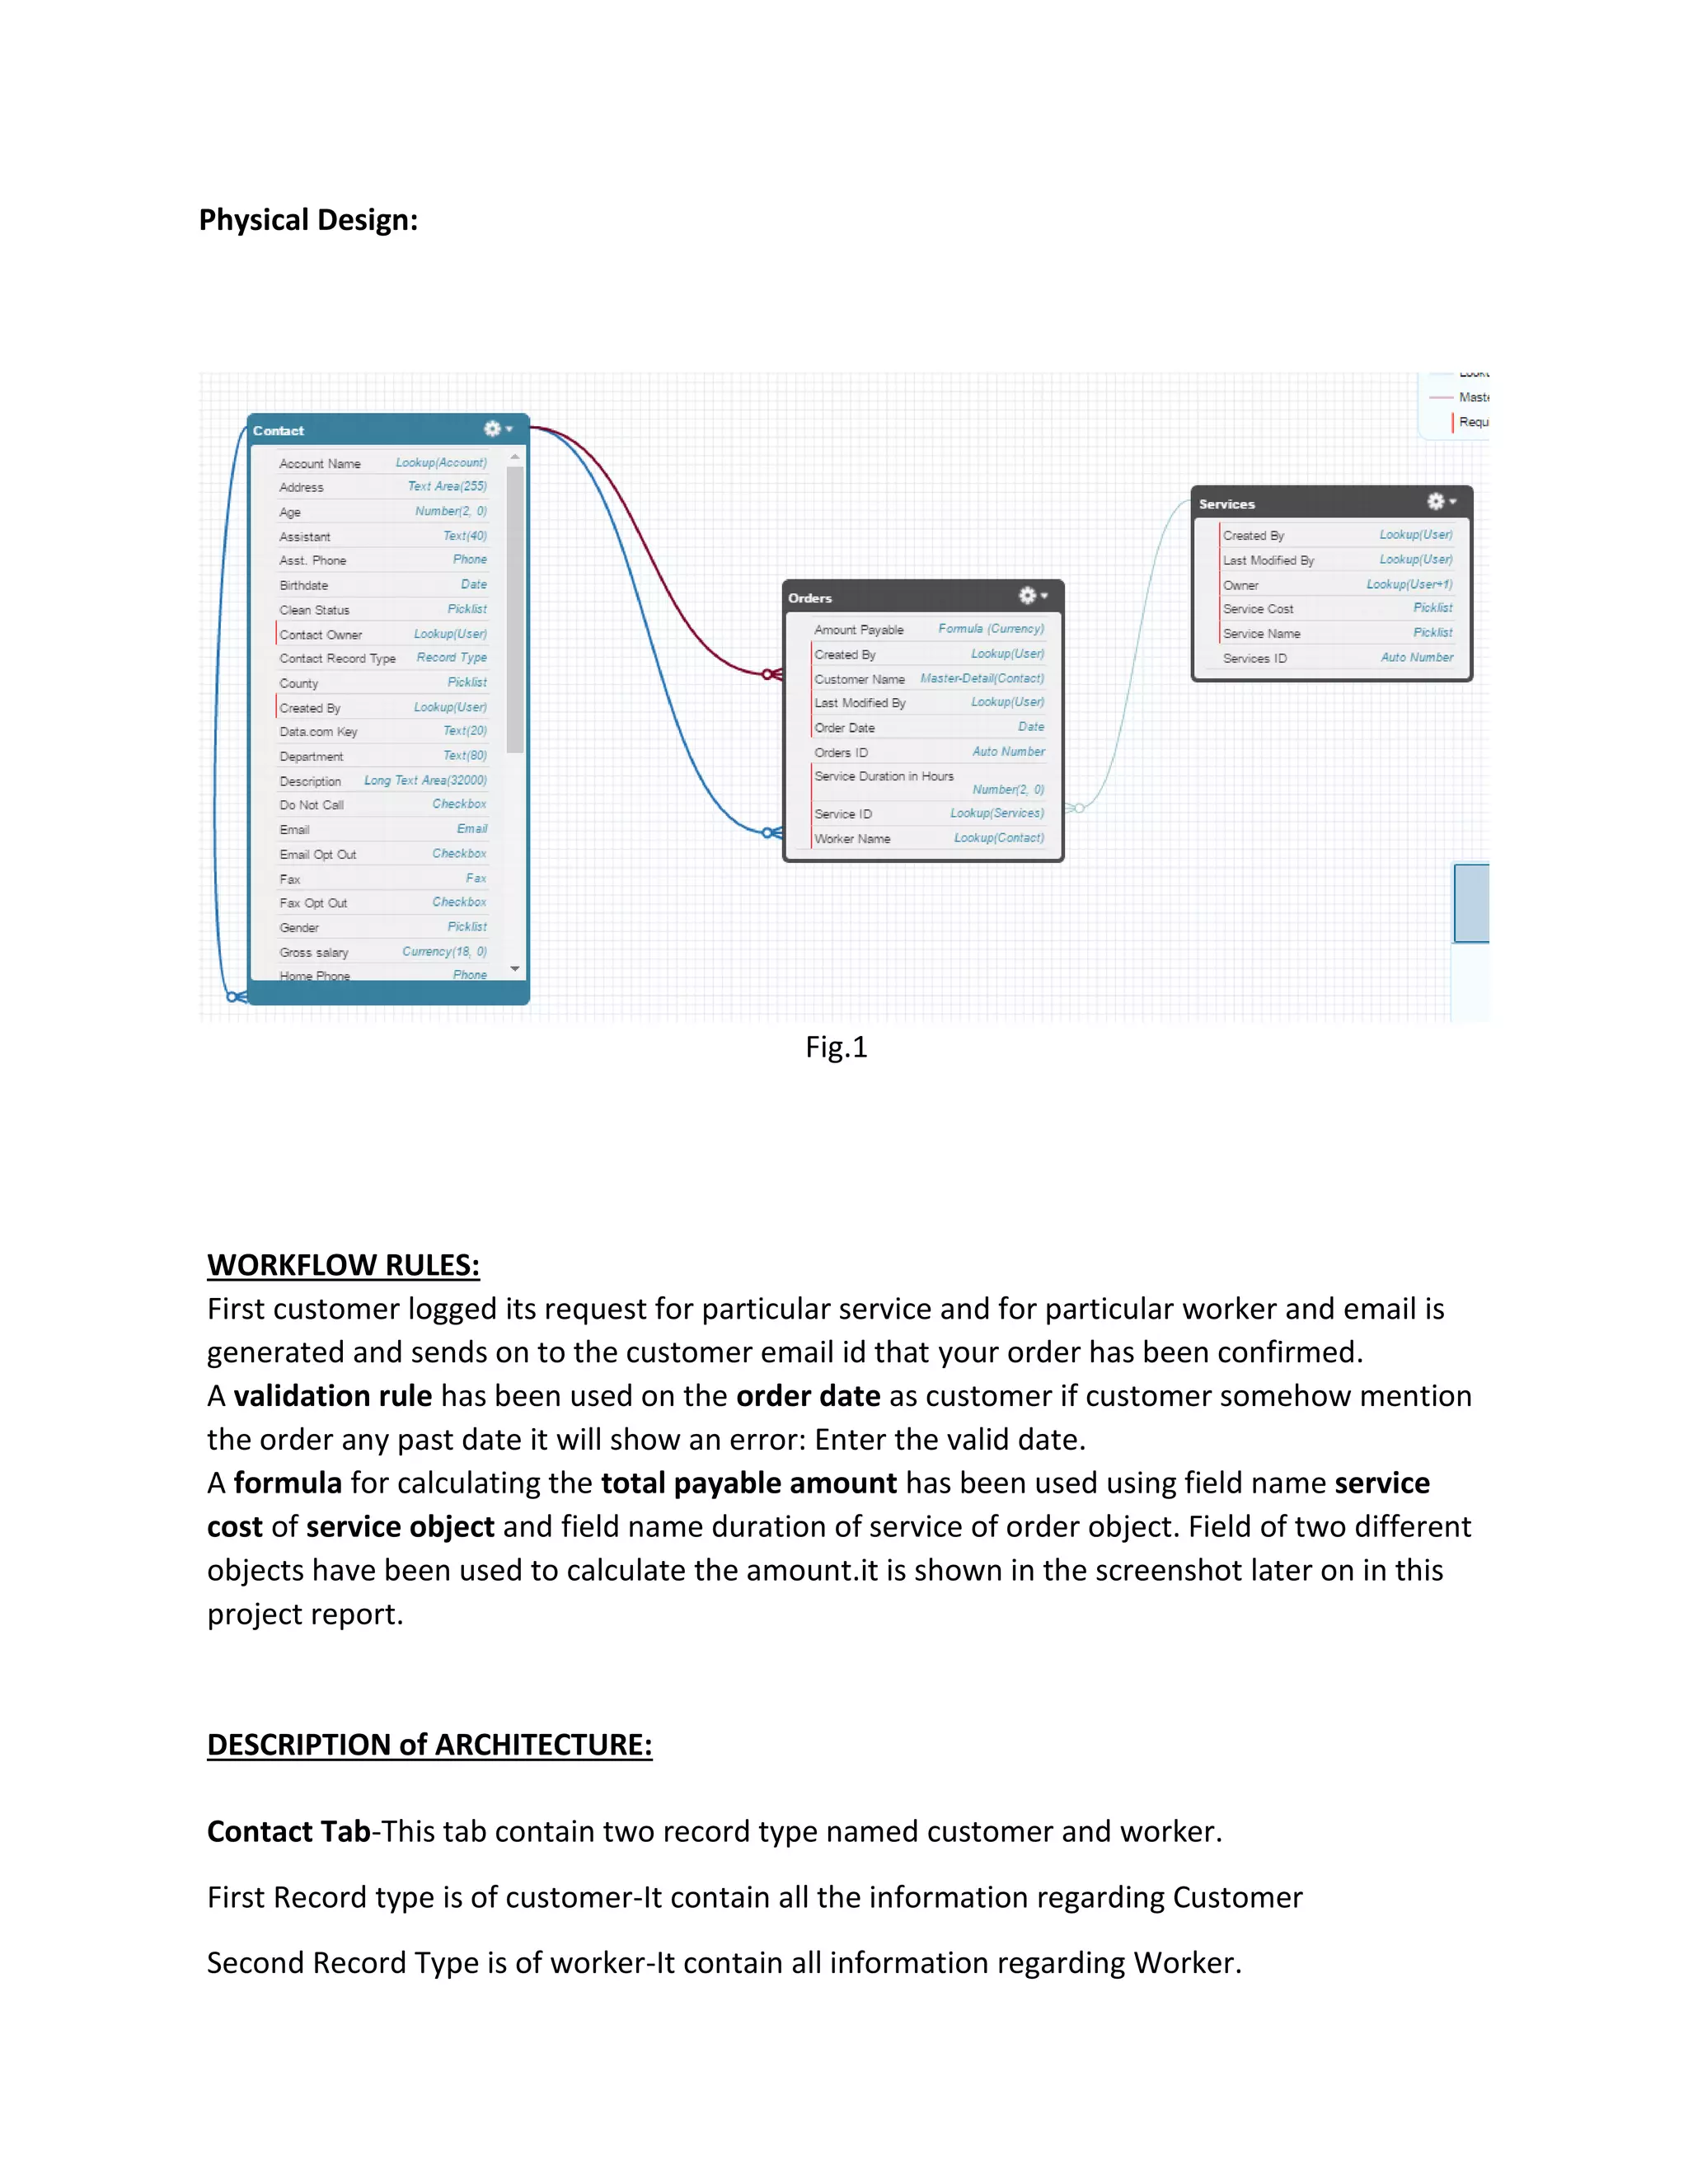
Physical Design:
Fig.1
WORKFLOW RULES:
Firstcustomer logged its request for particular service and for particular worker and email is
generated and sends on to the customer email id that your order has been confirmed.
A validation rule has been used on the order date as customer if customer somehow mention
the order any past date it will show an error: Enter the valid date.
A formula for calculating the total payable amount has been used using field name service
cost of service object and field name duration of service of order object. Field of two different
objects have been used to calculate the amount.it is shown in the screenshot later on in this
project report.
DESCRIPTION of ARCHITECTURE:
Contact Tab-This tab contain two record type named customer and worker.
First Record type is of customer-It contain all the information regarding Customer
Second Record Type is of worker-It contain all information regarding Worker.
6.
Order Tab-It consistthe detail of order of customer, Lookup of customer,worker and service is
done here and also formulae to calculate total payable amount is done here.
Service Tab-It contains detail of every service and cost of each service per hour.
Report Tab-Business Report are generated here
Dashboard Tab-Dashboard is used to visualize the generated report.
The process control flow is:
Customer-> Service-> Worker-> Service delivered
Customer->Duration of Service
Company-> Costumer-> opportunity
We need adequate amount of data to create report and visualization we have generated data
of 500 rows for each object using mockaroo.link of site http//mockaroo.com.This data is
loaded using setup-> import data option in setup tab which is shown later in this report.
BUSINESS benefits:
• Analytically Targeting Customer
• Generated report is used to analysis worker performance
• Dashboard is used to visualize the report for business driven decision
• Email is generated as customer makes any order, giving him assurance
• Validation can be set which help in smooth workflow
7.
SCREENSHOTS of thePROJECT
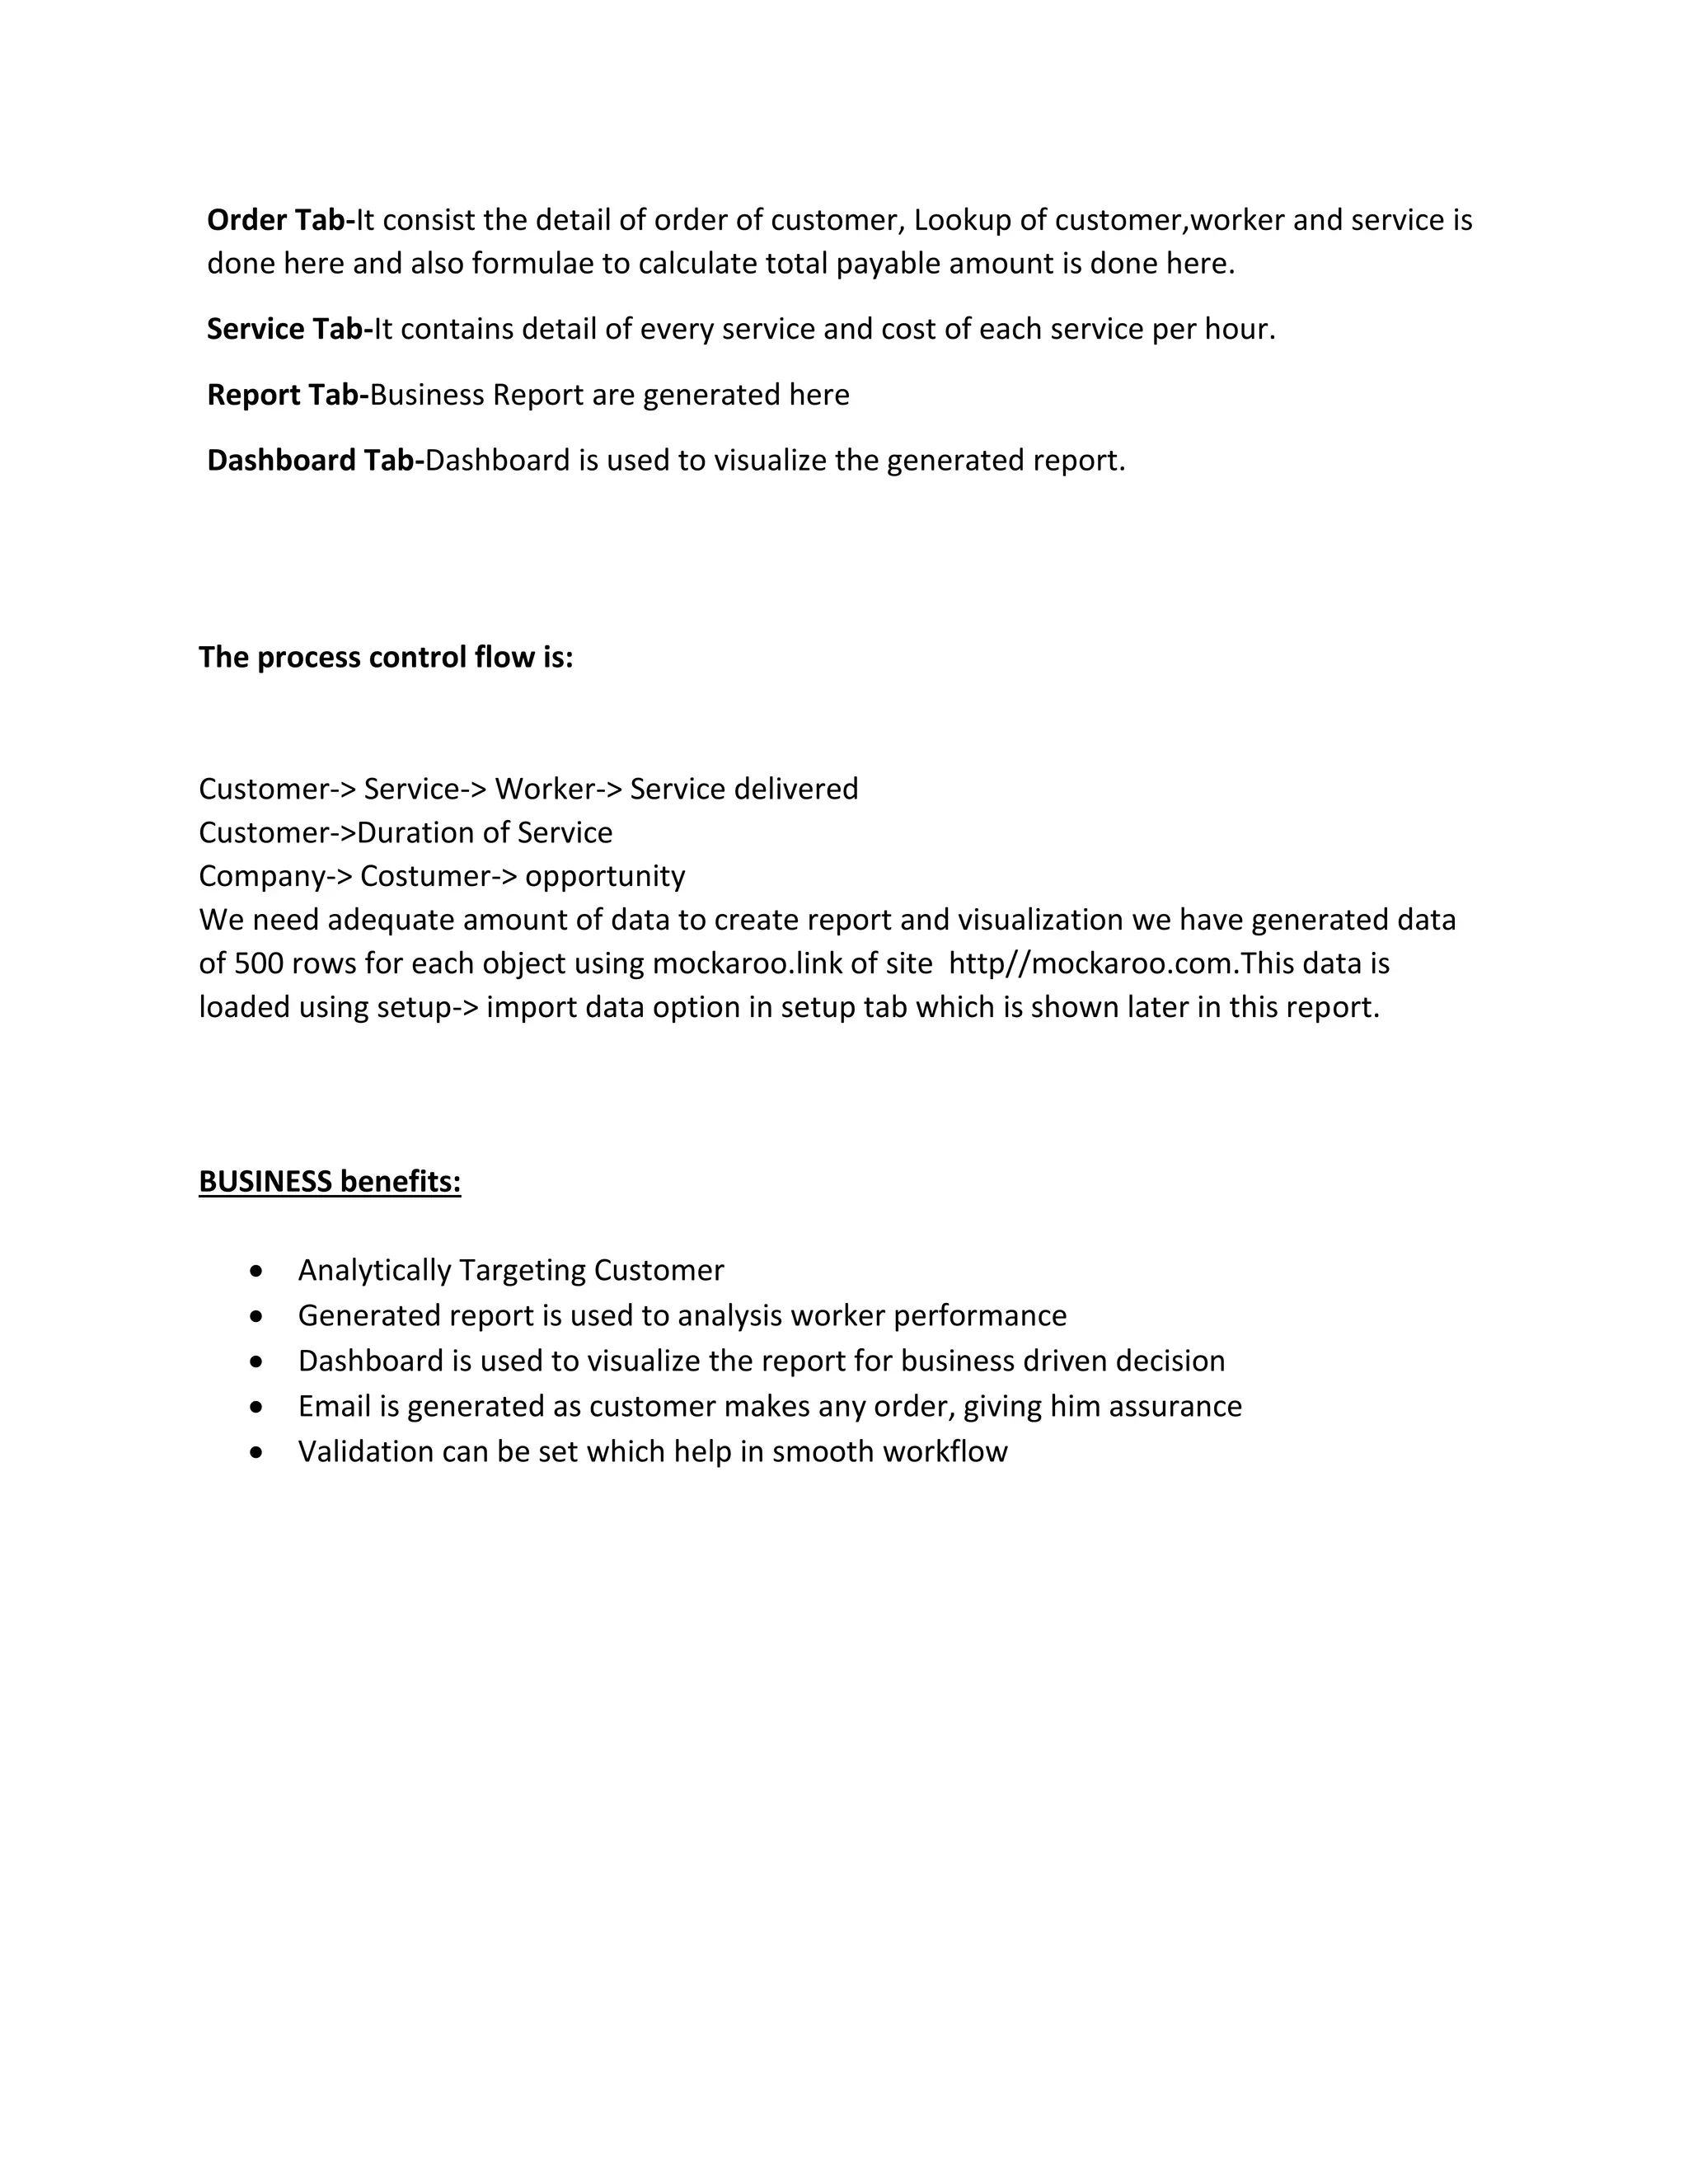
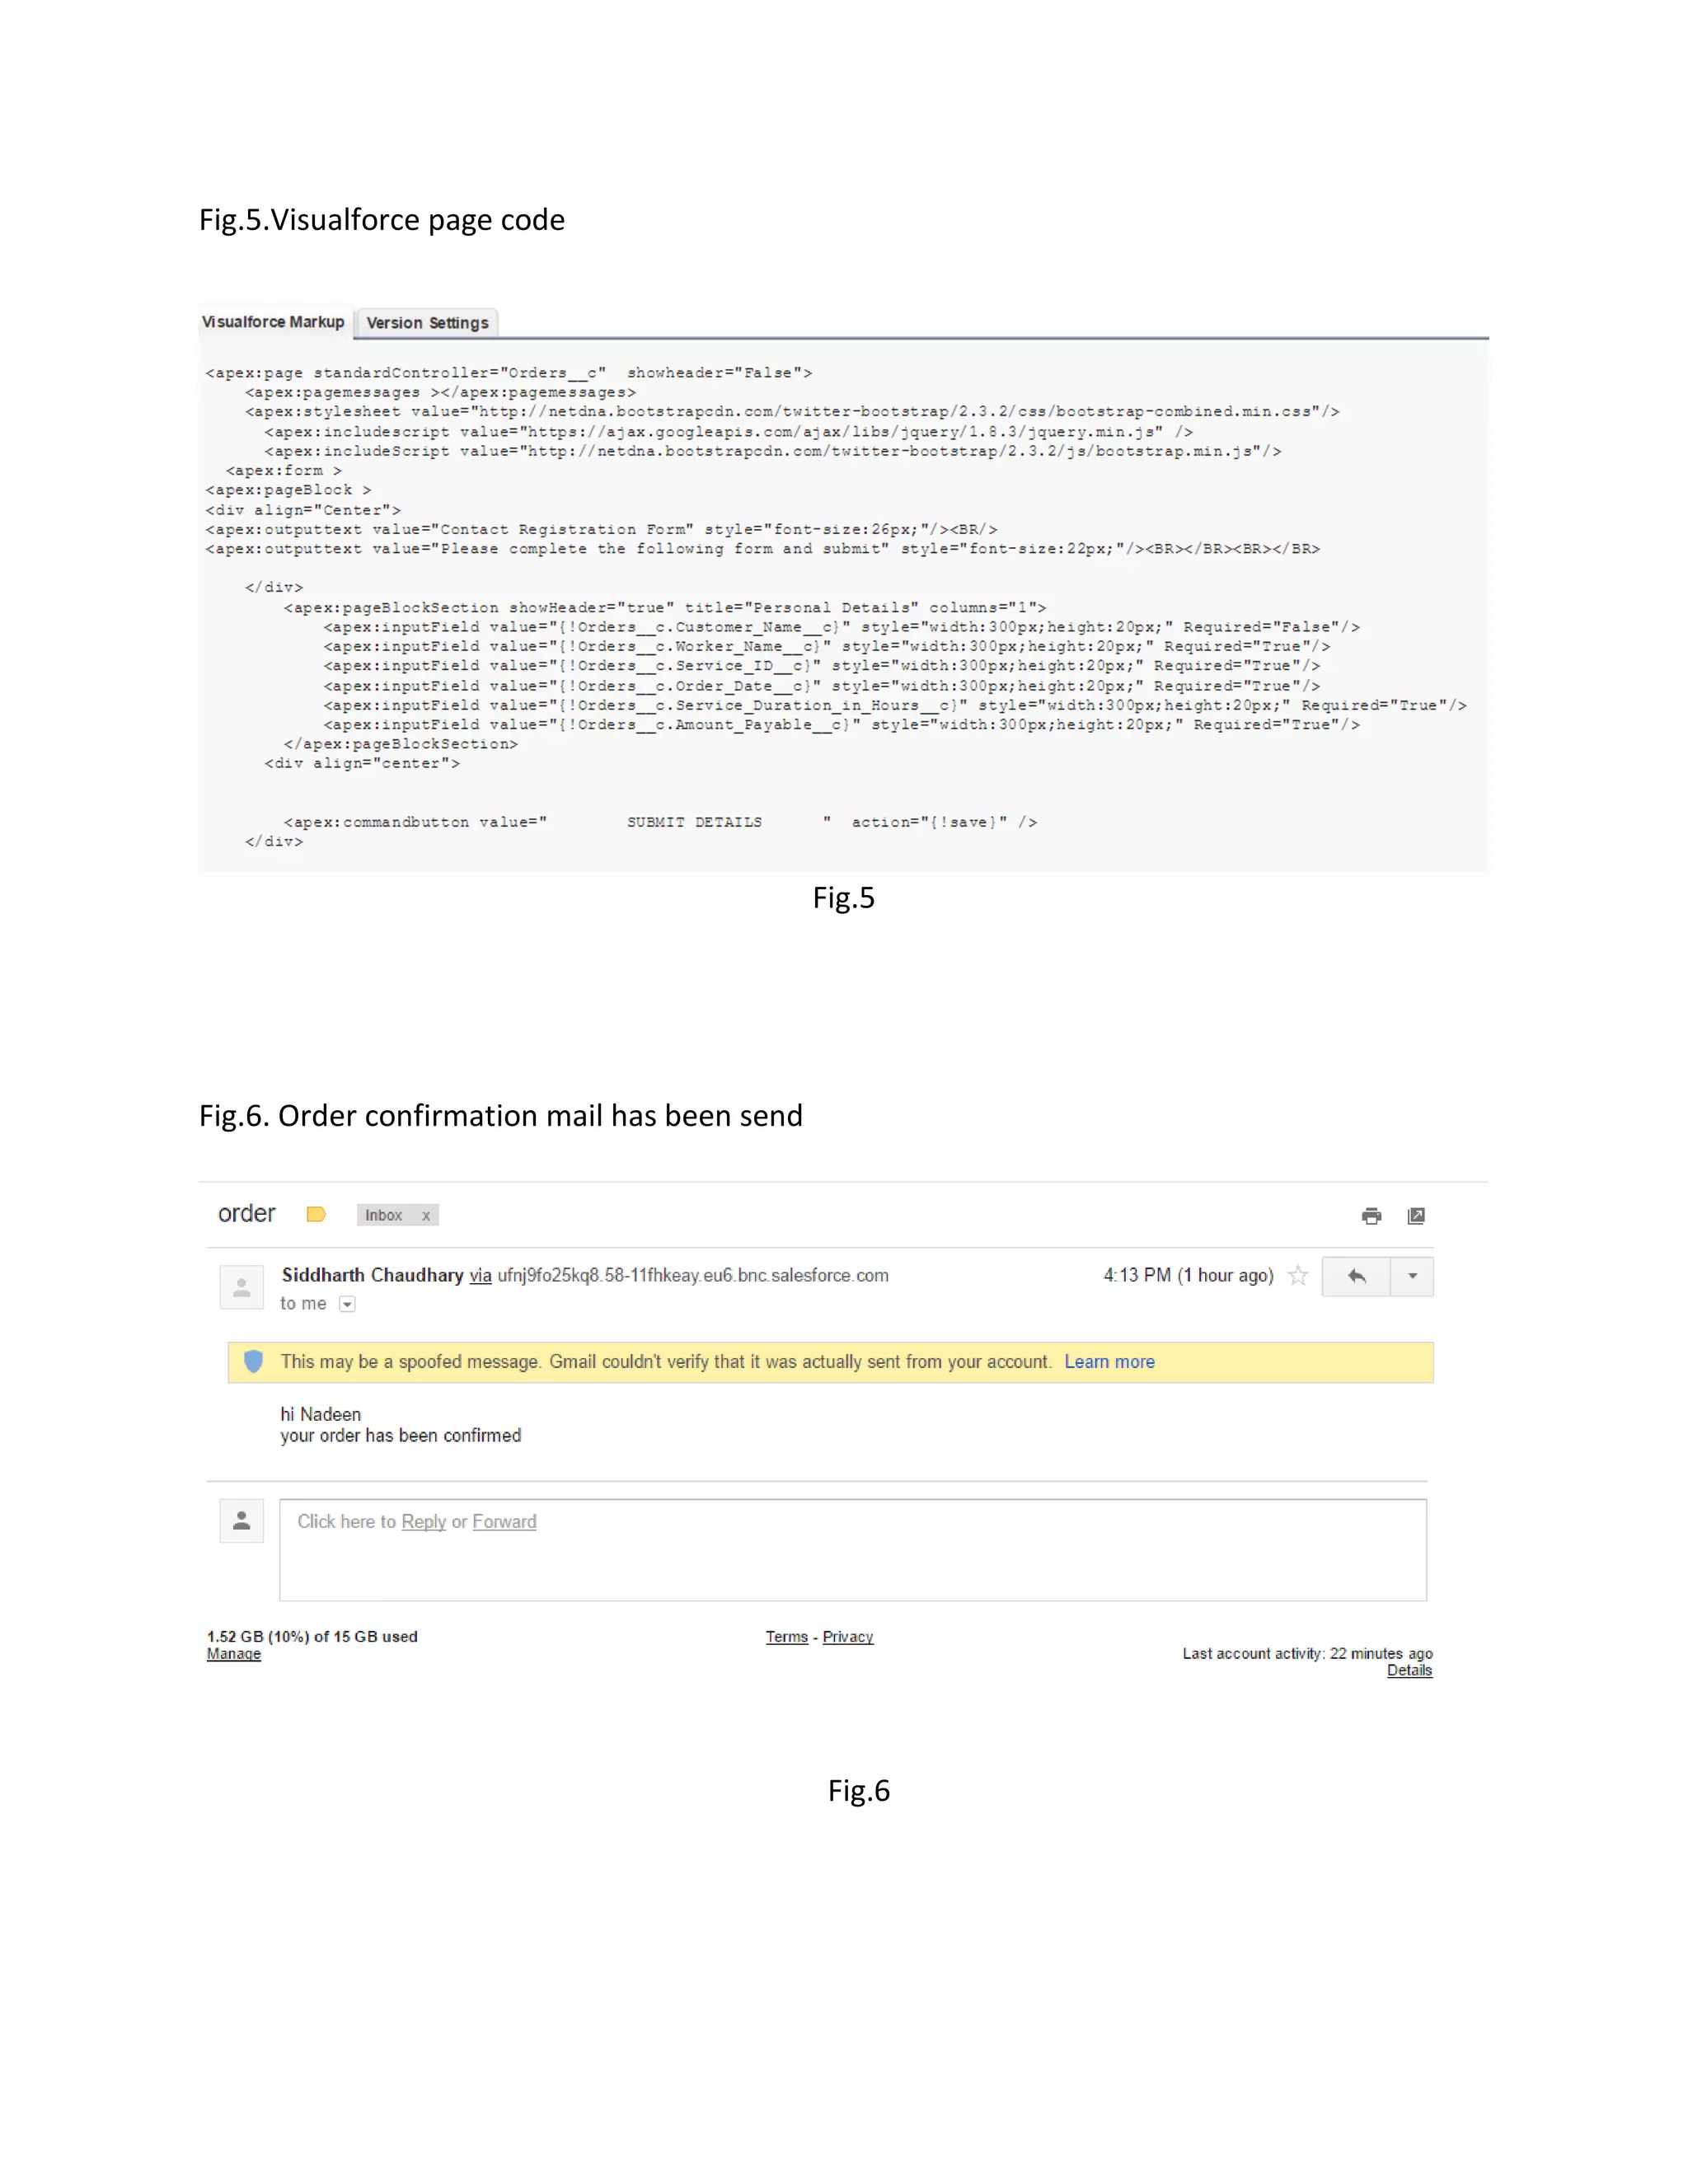
1.Visual Salesforce Page:
It is the enrolling page for customer Fig.1 as customer will click in field it will ask customer detail
as shown in fig.2. When customer will make an order an email will be generated and it will be
send on to its email id as shown in Fig.6,
Fig.1
Fig.2
8.
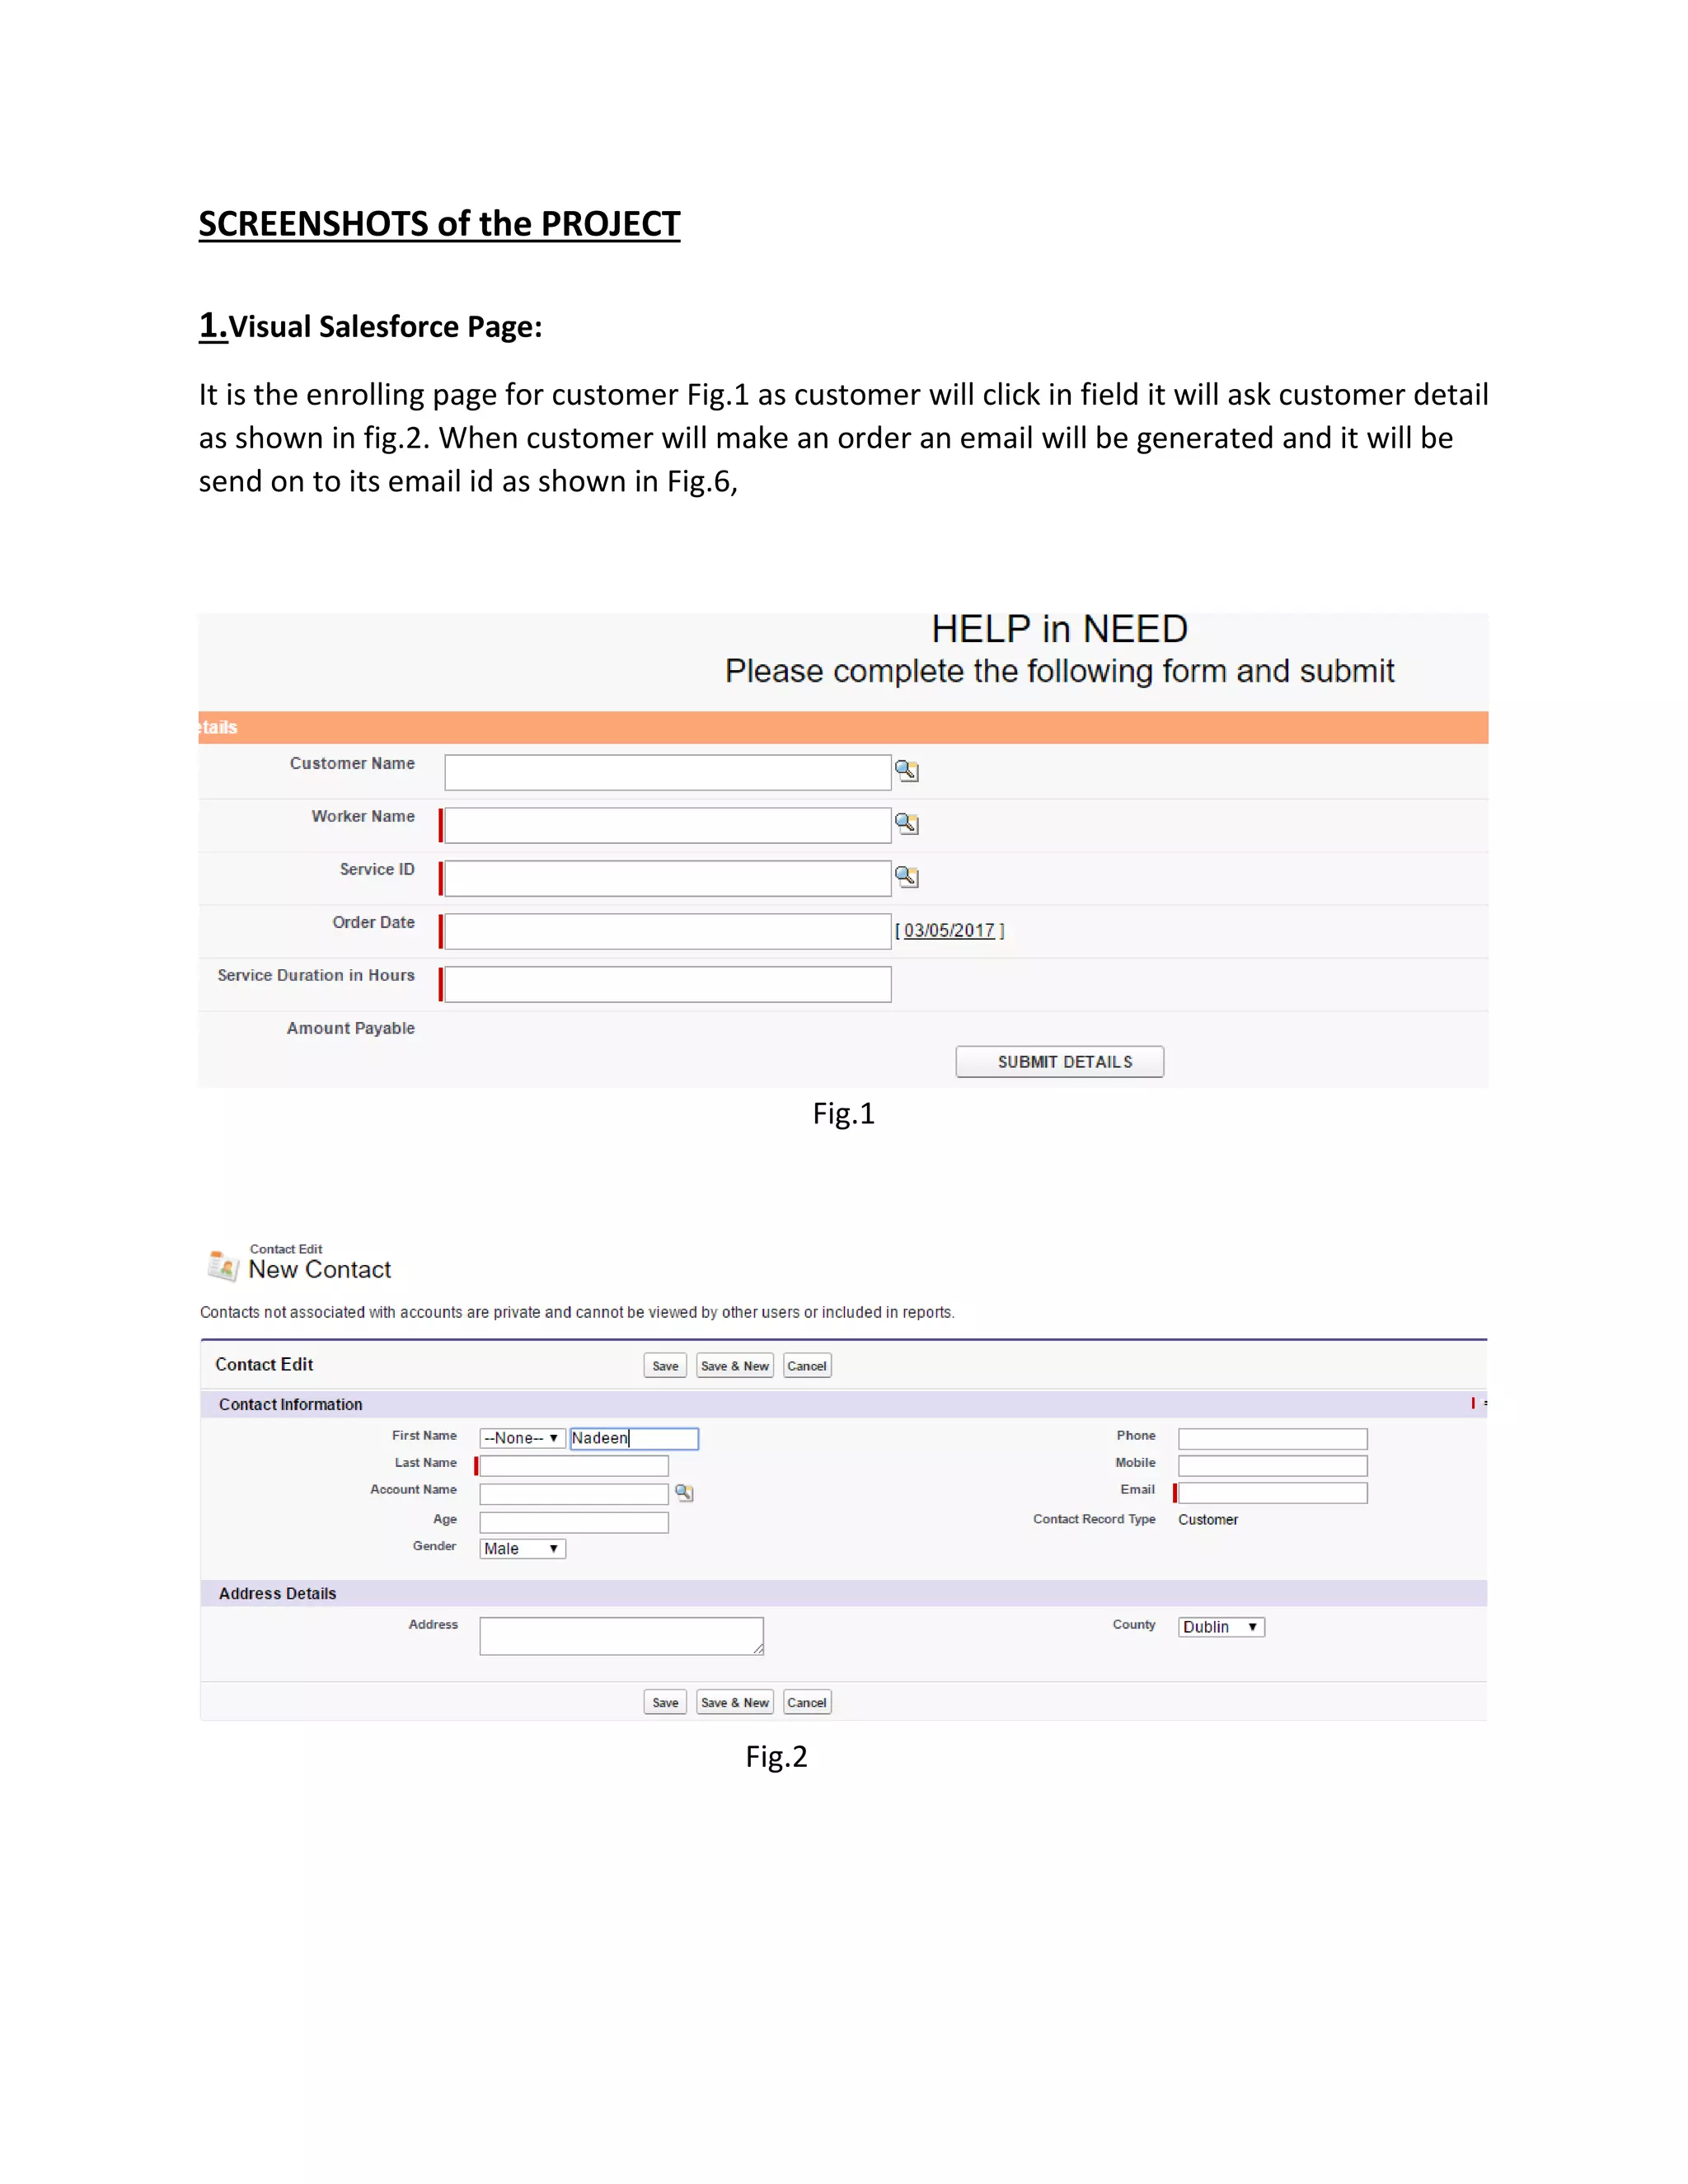
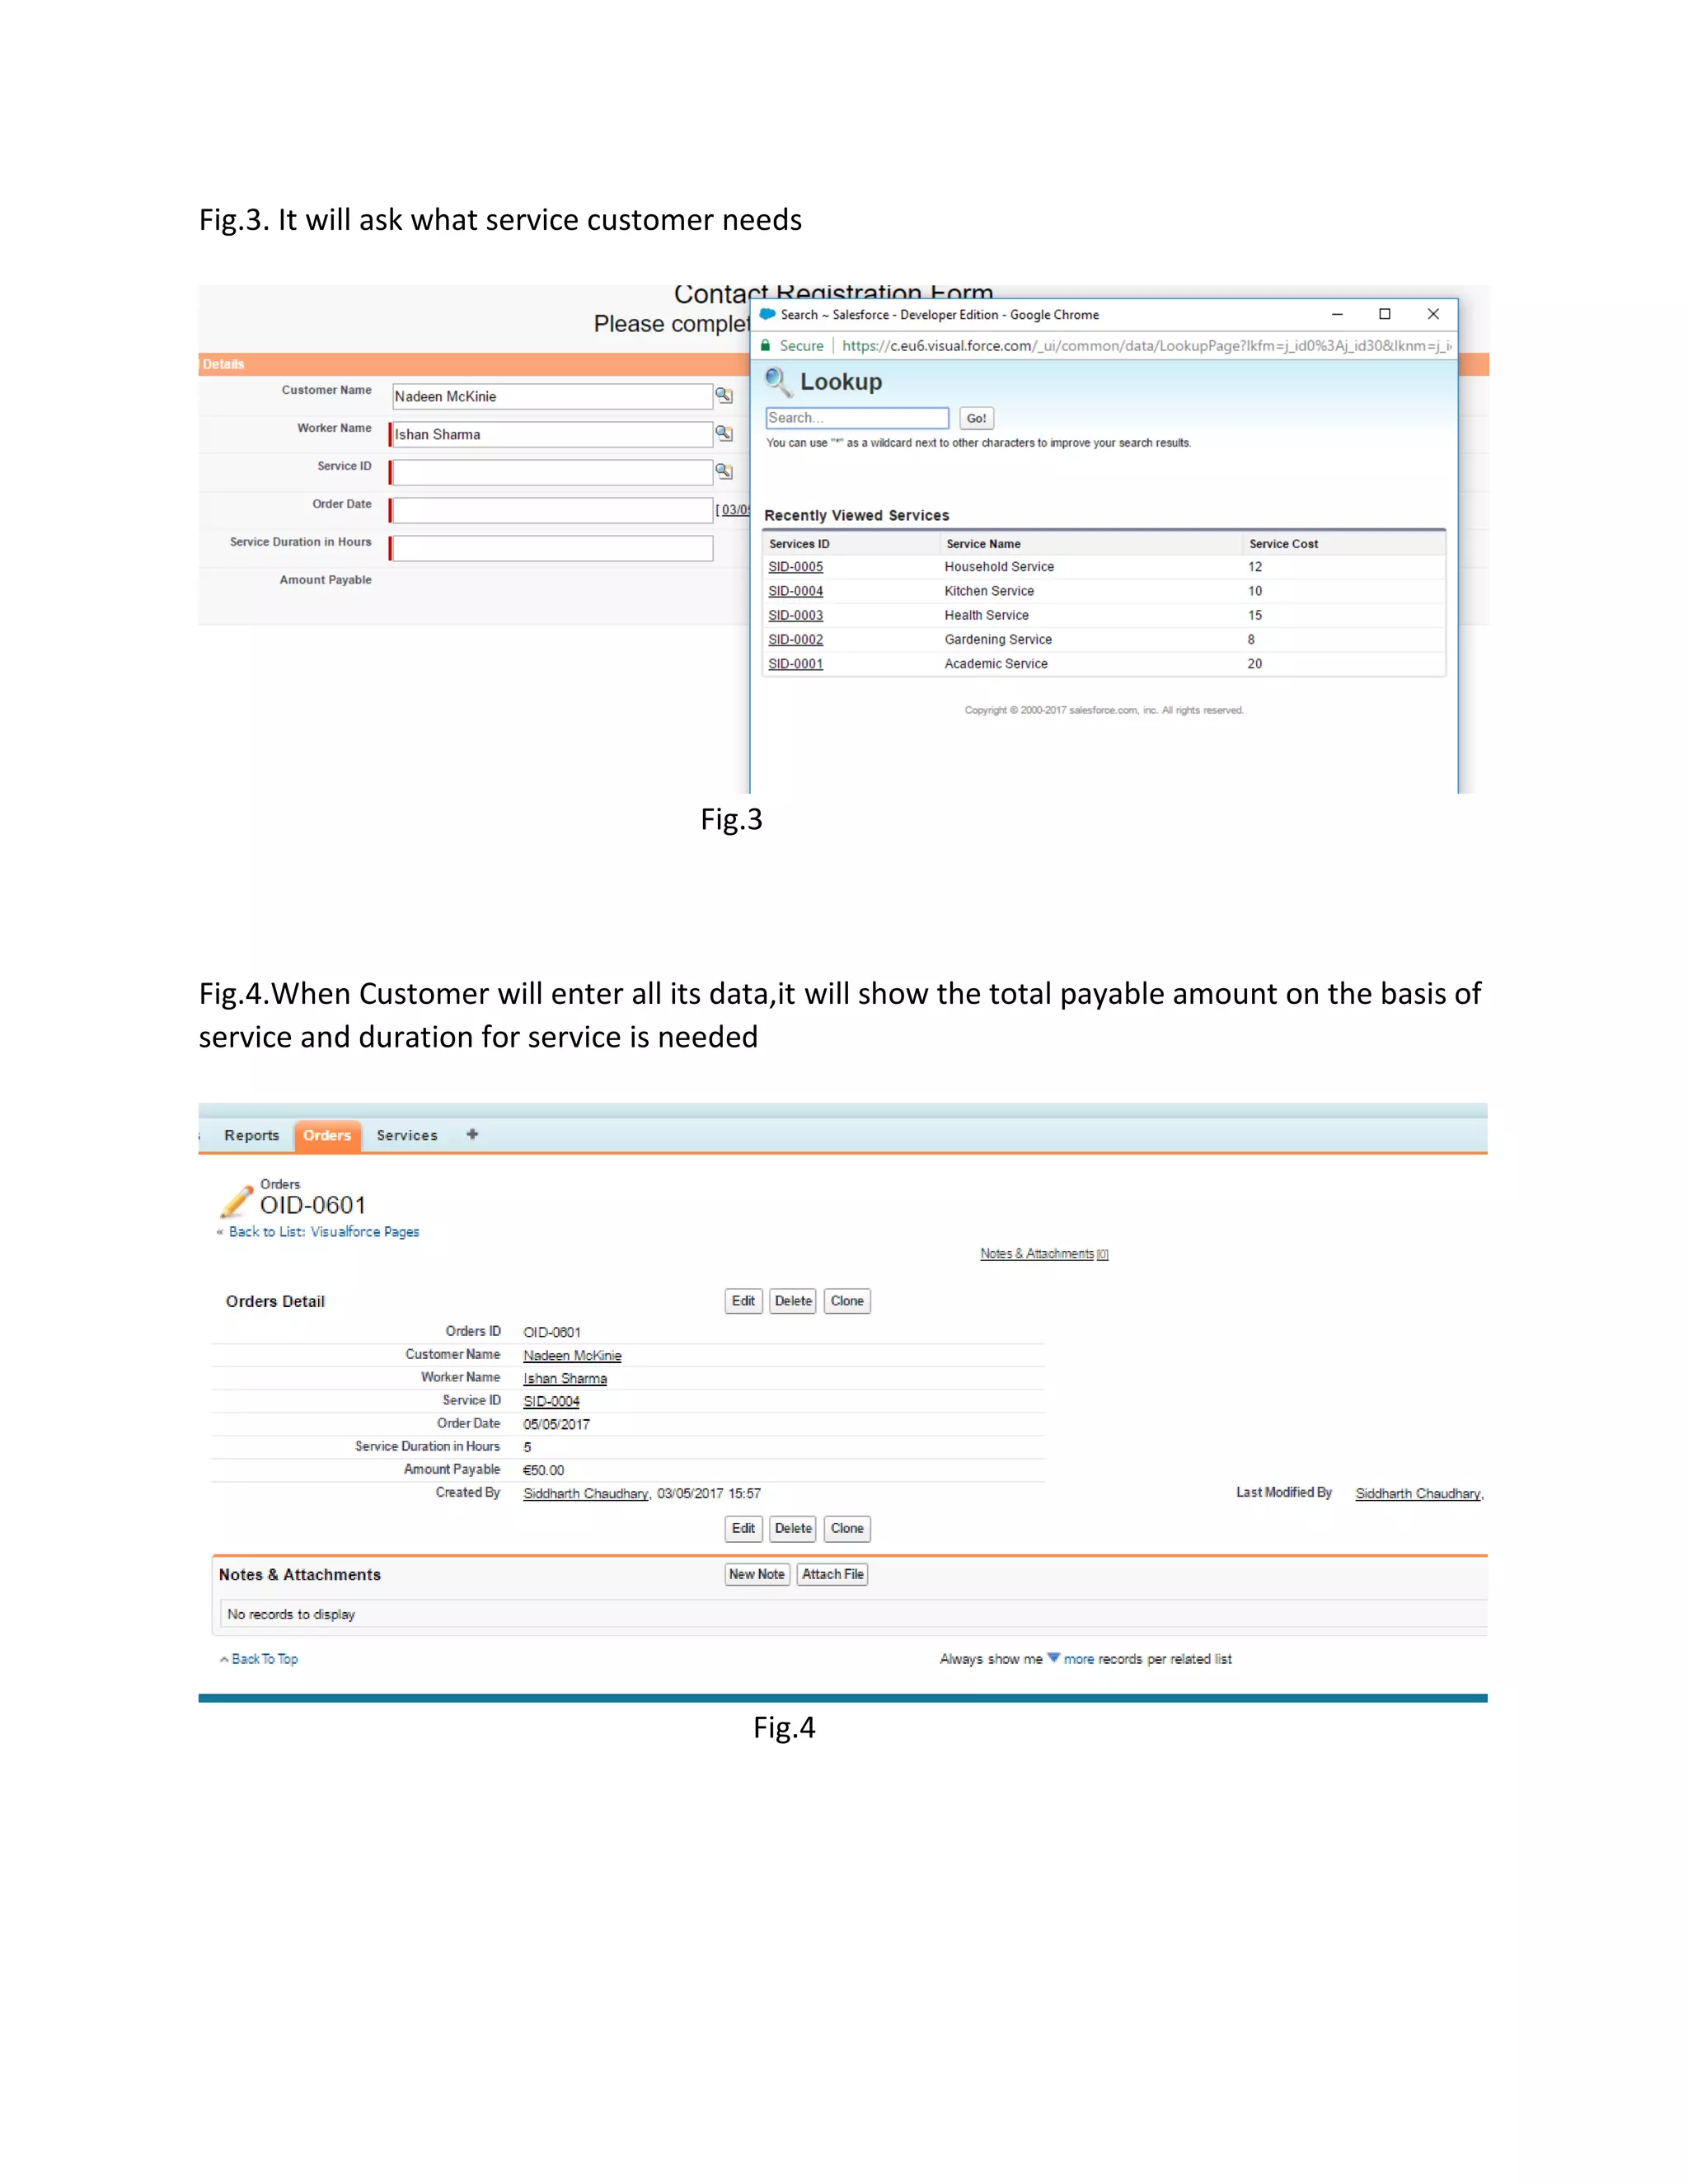
Fig.3. It willask what service customer needs
Fig.3
Fig.4.When Customer will enter all its data,it will show the total payable amount on the basis of
service and duration for service is needed
Fig.4
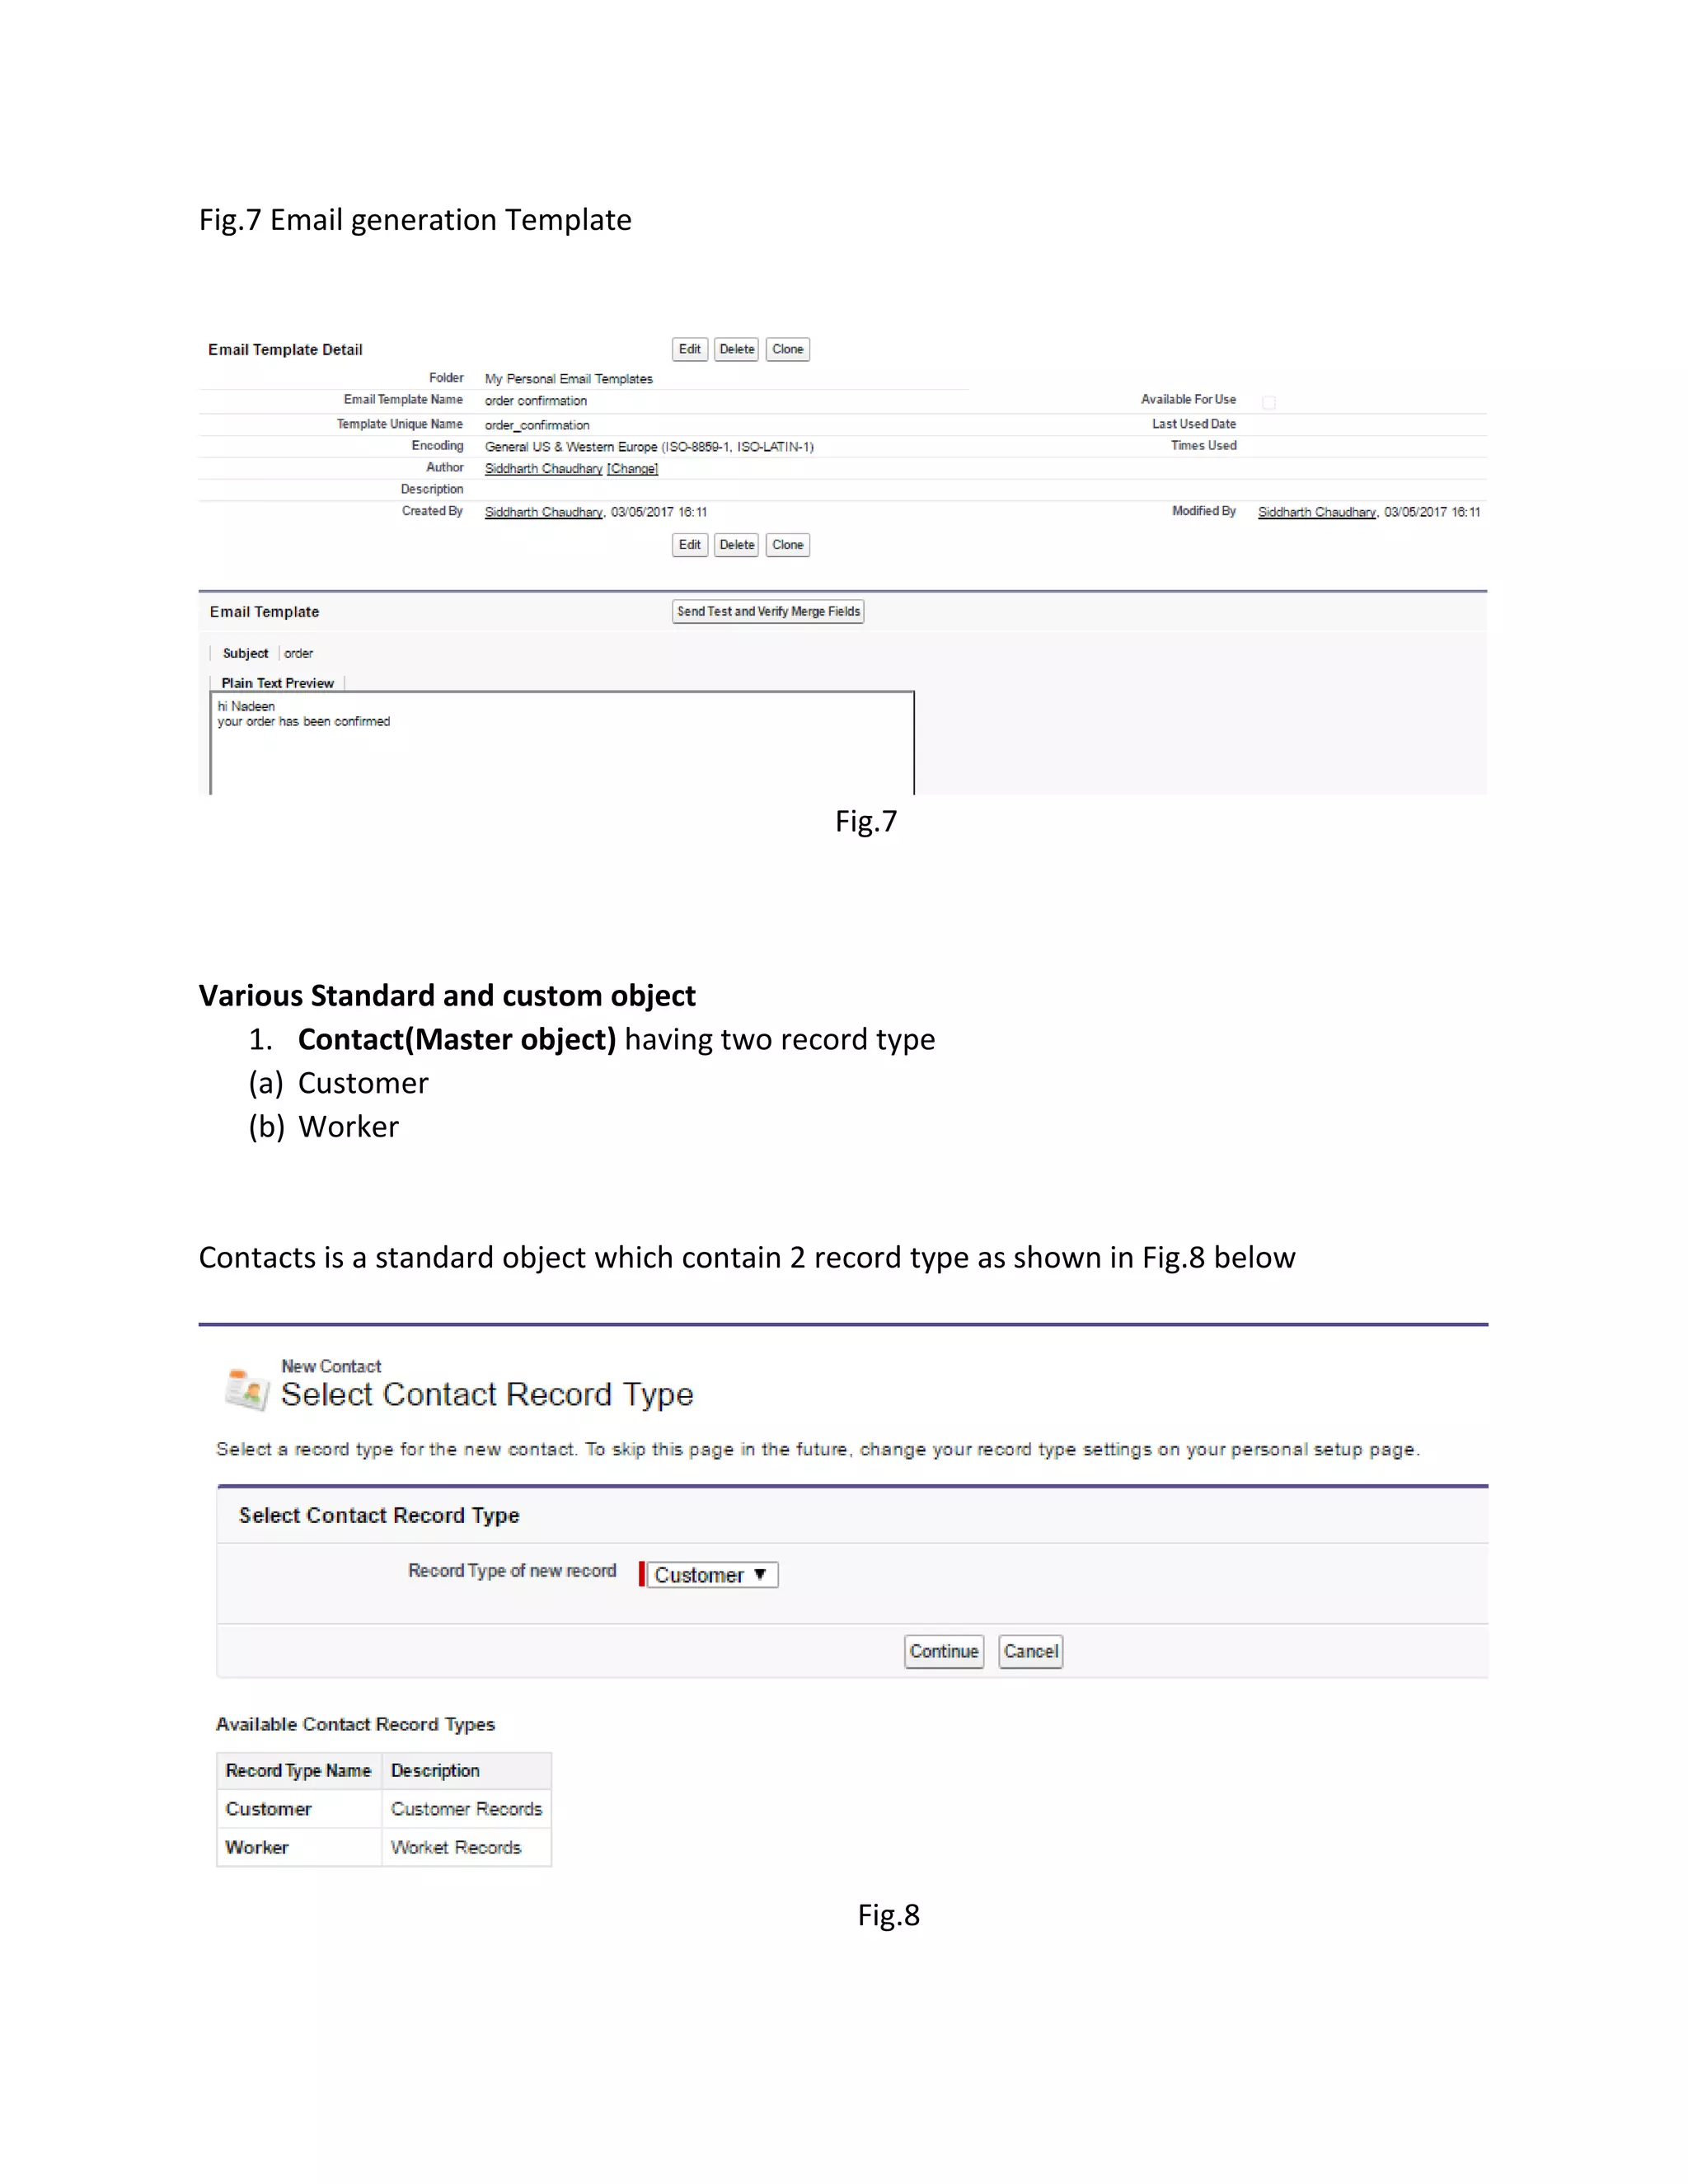
Fig.7 Email generationTemplate
Fig.7
Various Standard and custom object
1. Contact(Master object) having two record type
(a) Customer
(b) Worker
Contacts is a standard object which contain 2 record type as shown in Fig.8 below
Fig.8
11.
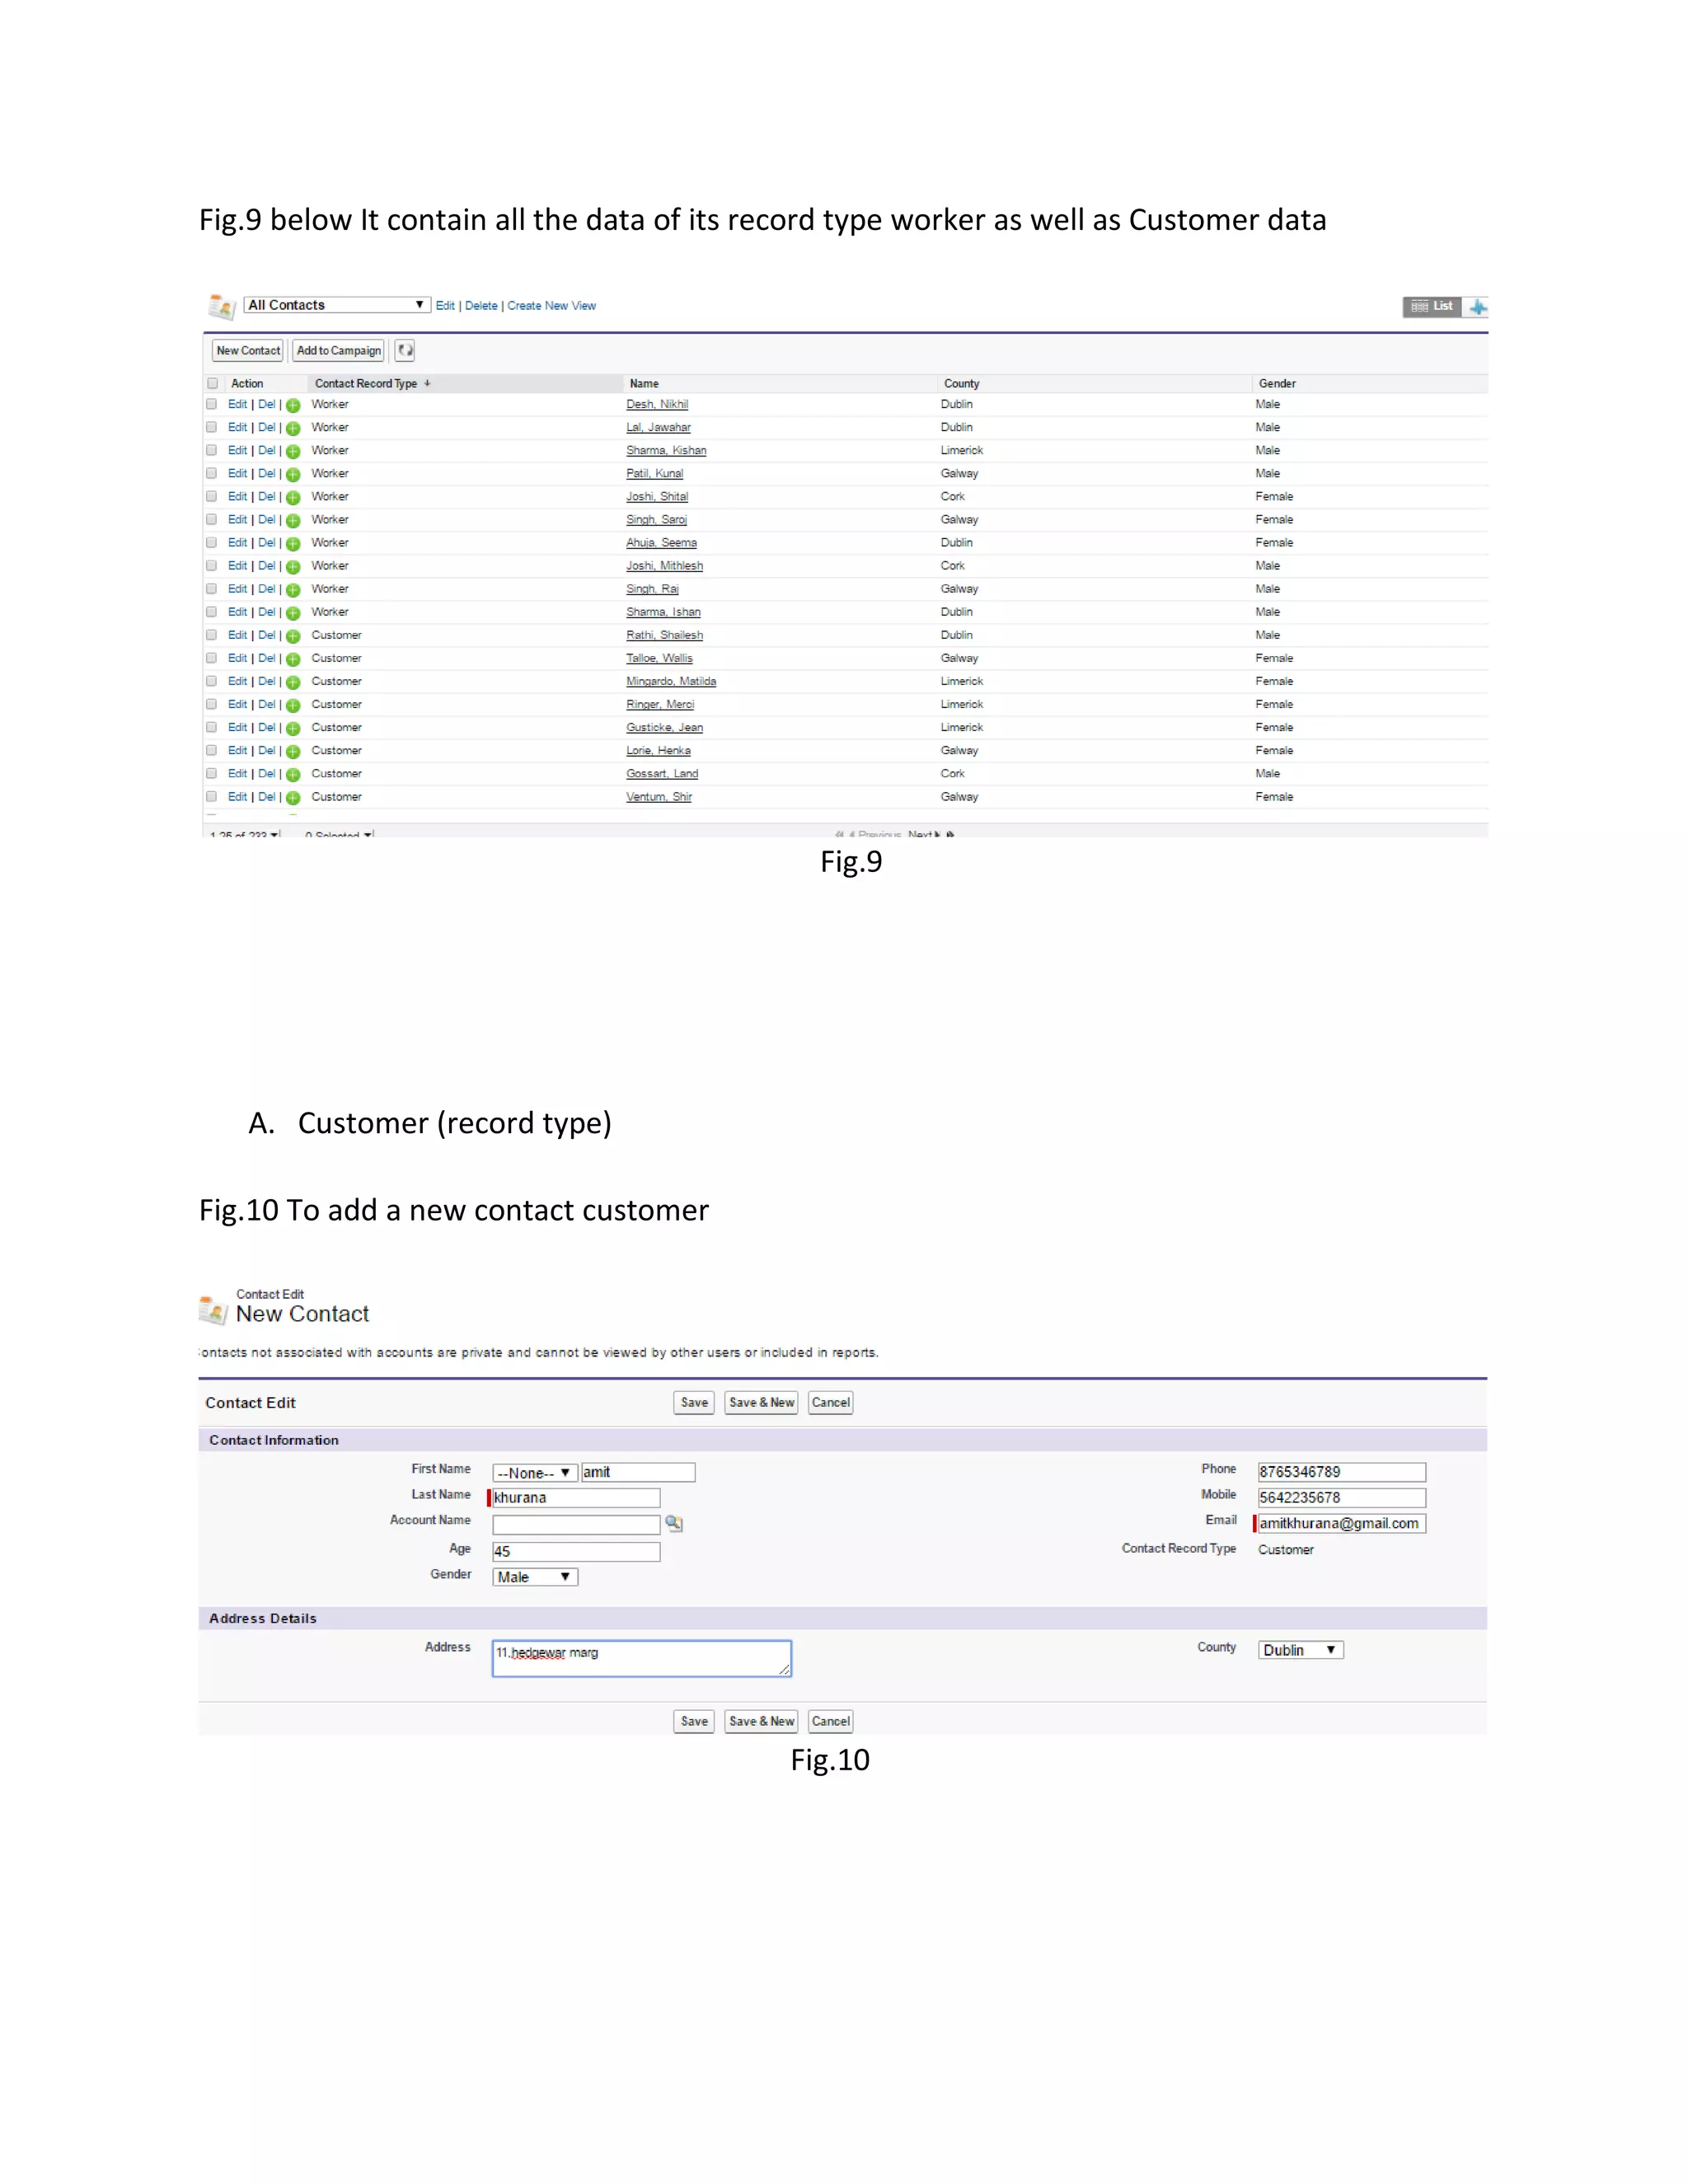
Fig.9 below Itcontain all the data of its record type worker as well as Customer data
Fig.9
A. Customer (record type)
Fig.10 To add a new contact customer
Fig.10
12.
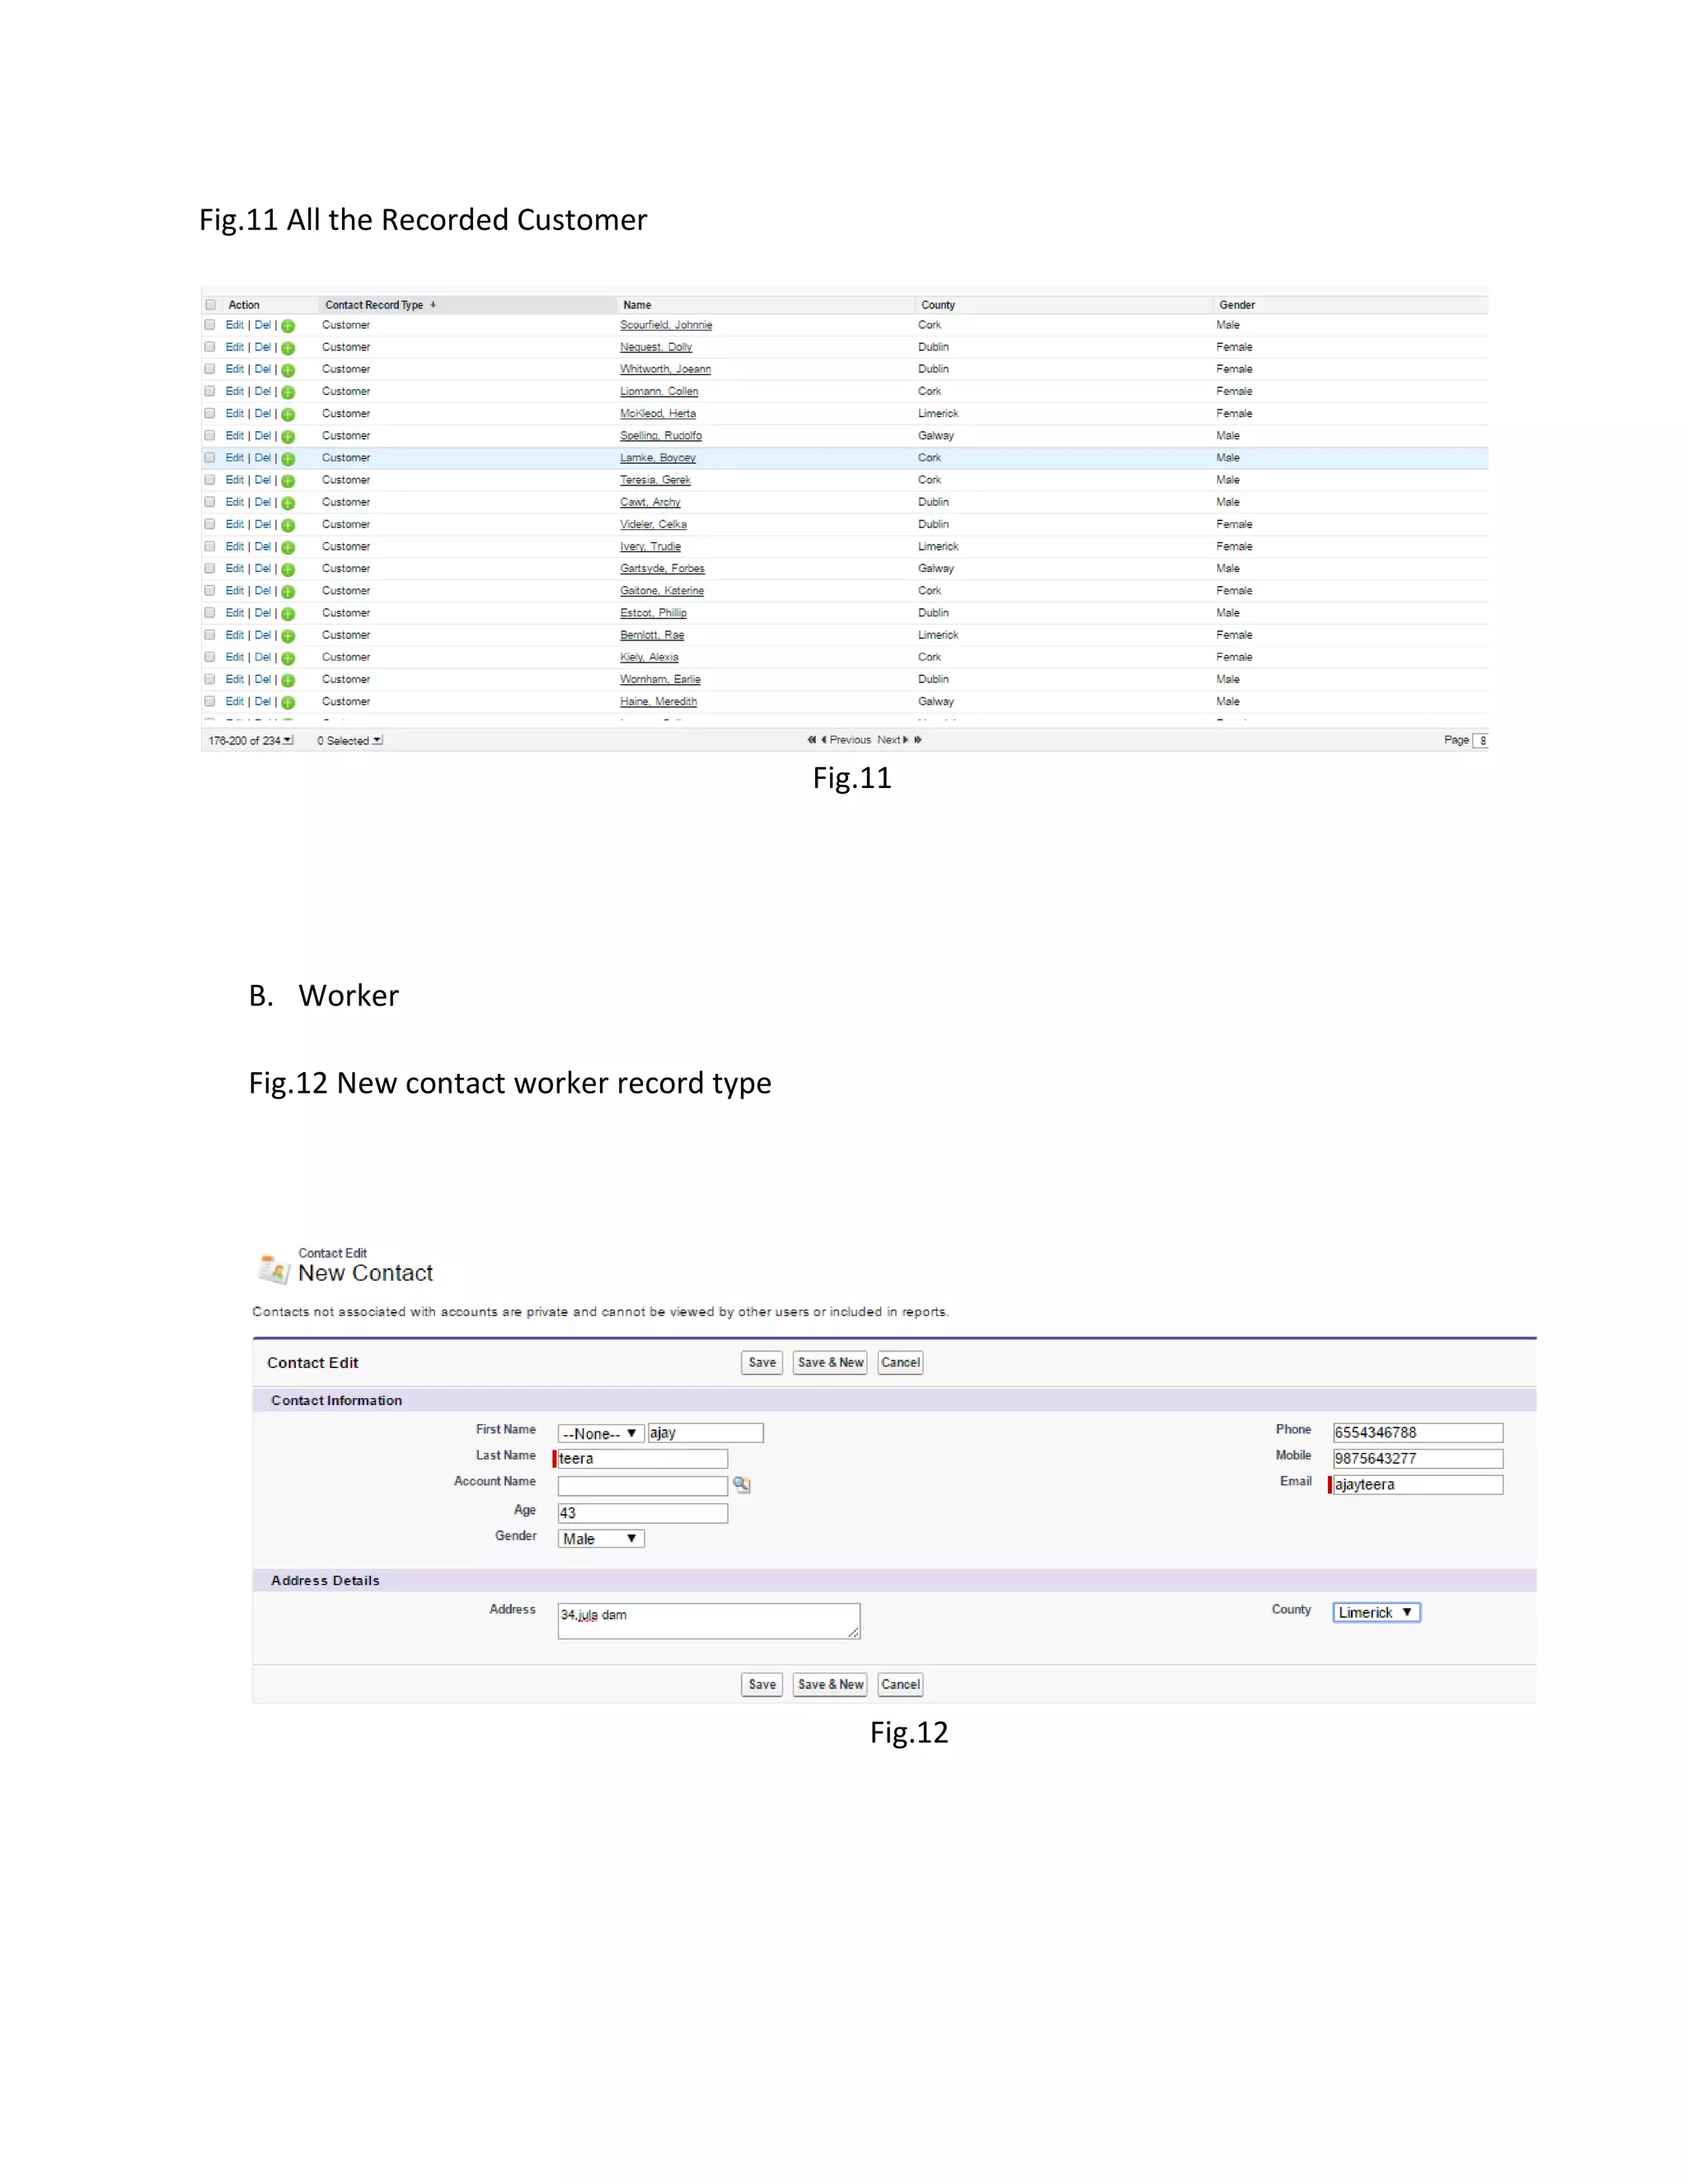
Fig.11 All theRecorded Customer
Fig.11
B. Worker
Fig.12 New contact worker record type
Fig.12
13.
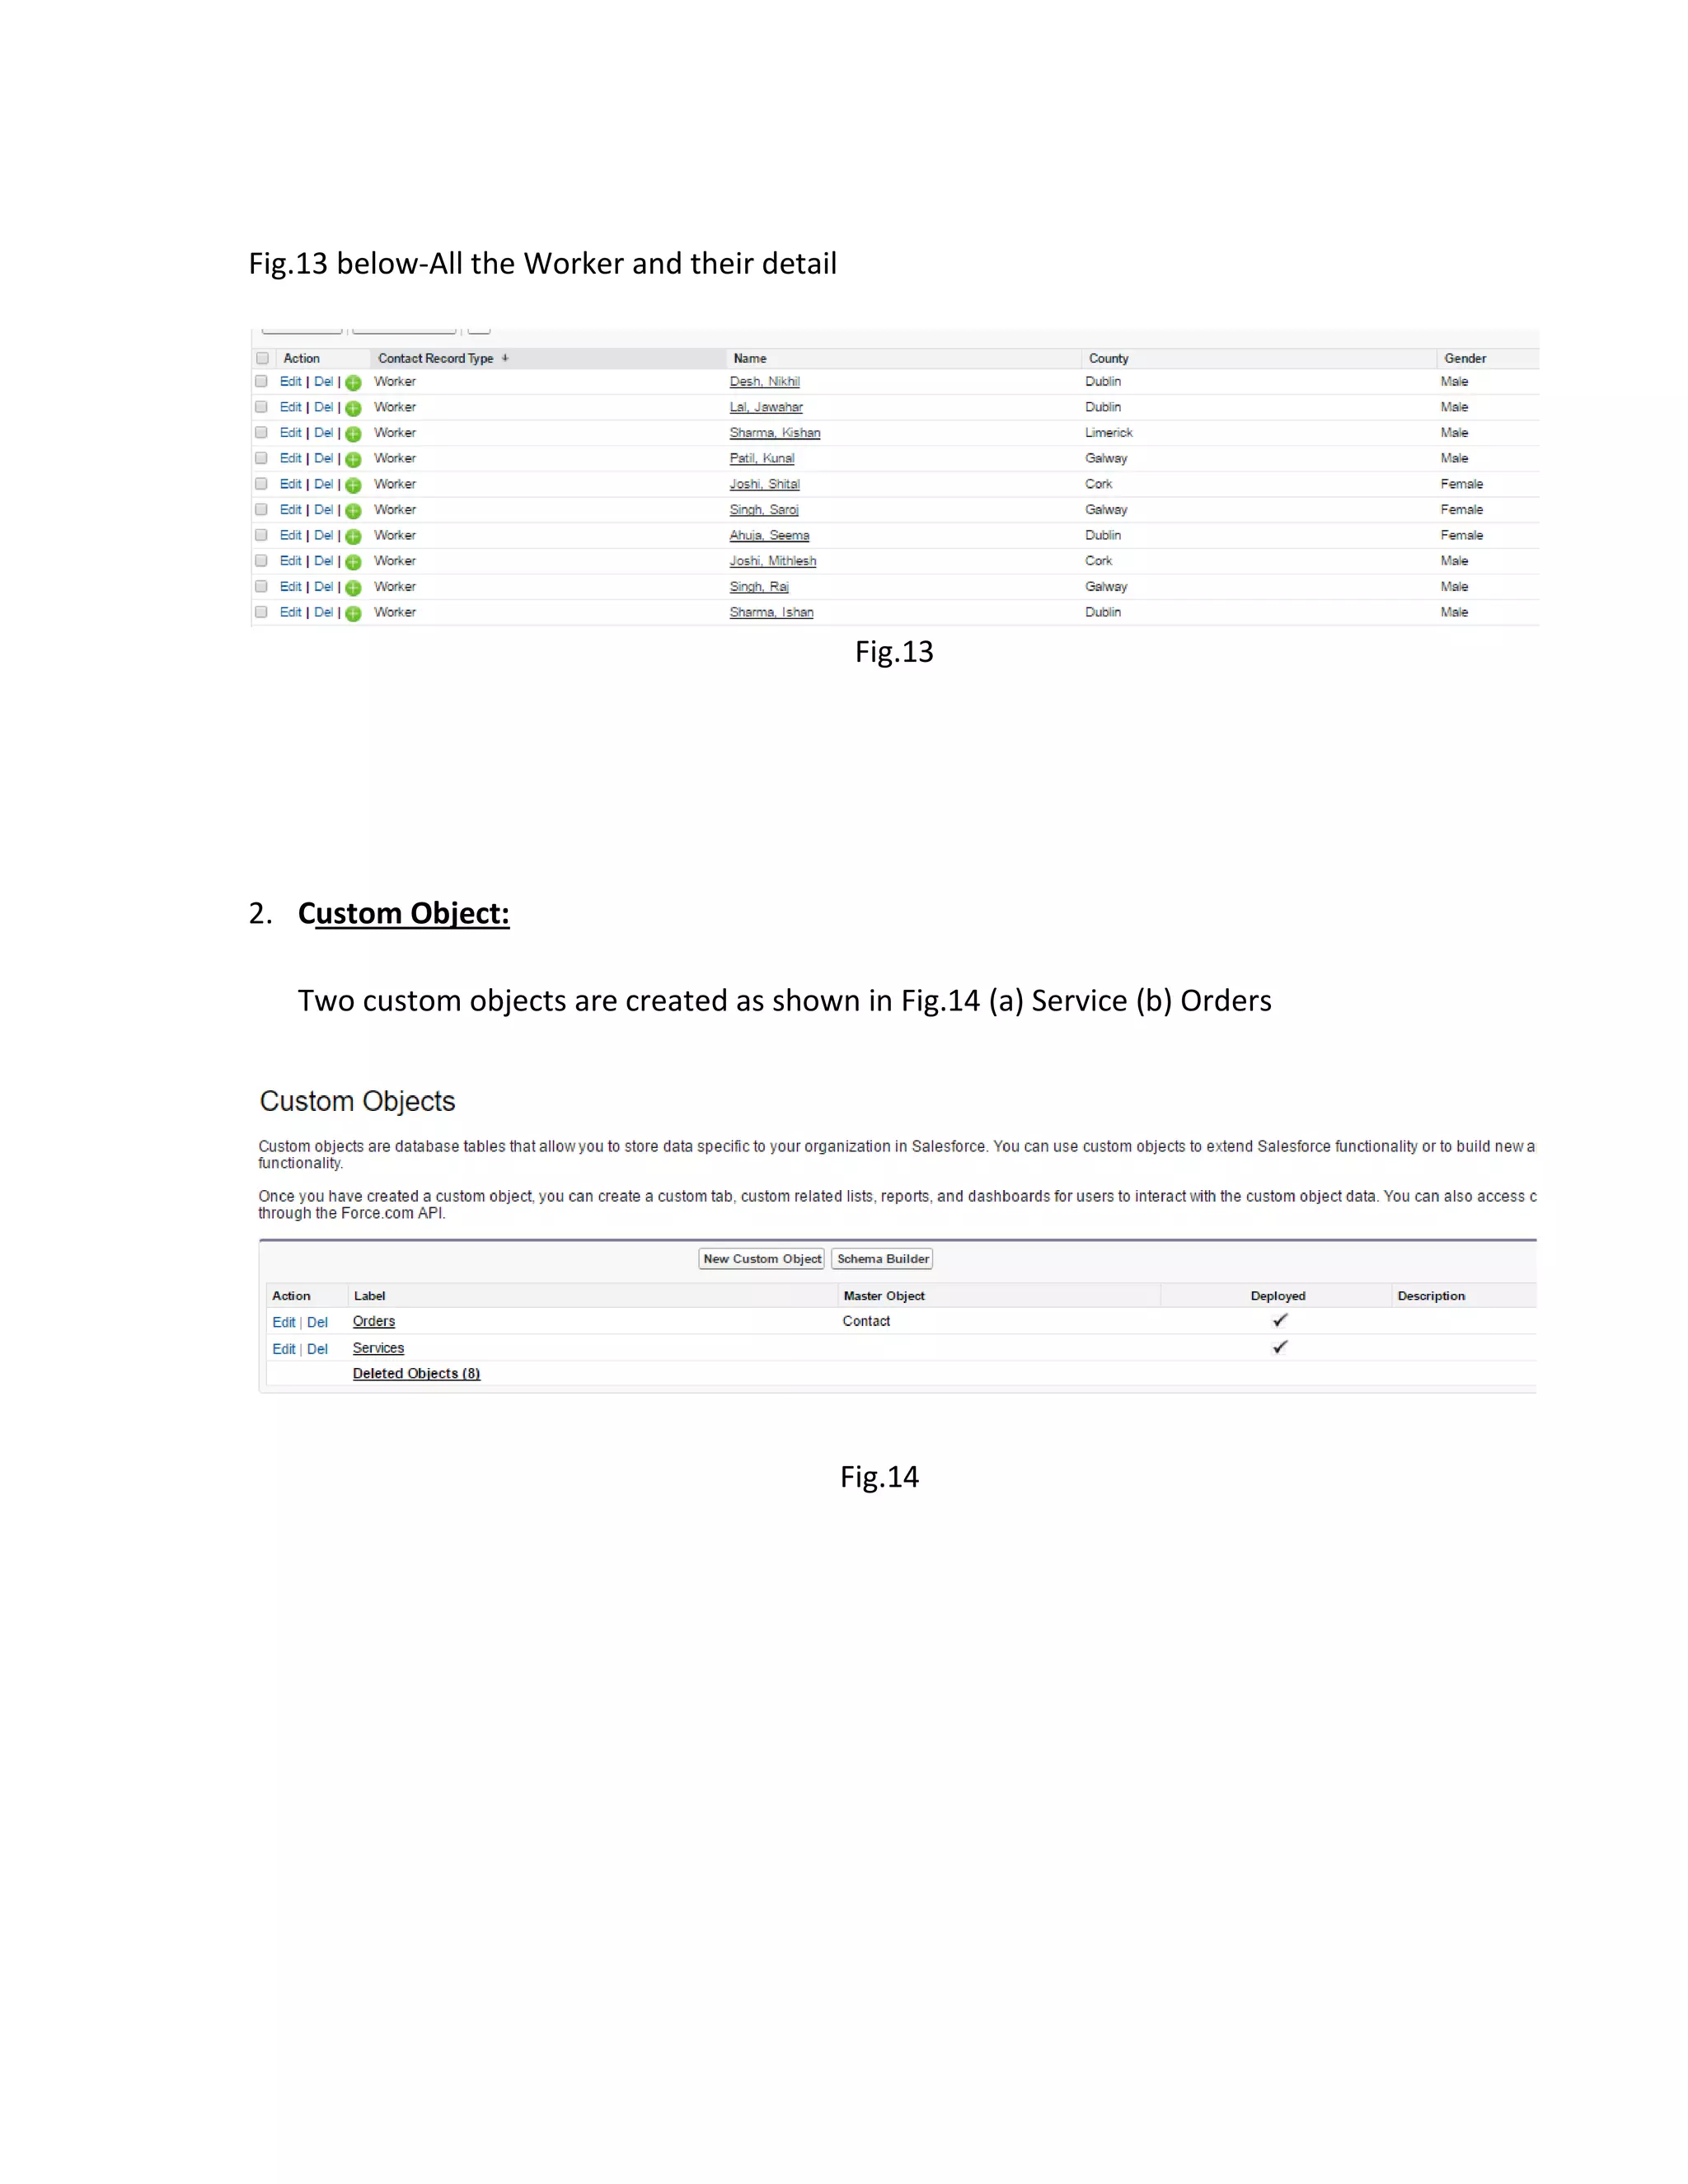
Fig.13 below-All theWorker and their detail
Fig.13
2. Custom Object:
Two custom objects are created as shown in Fig.14 (a) Service (b) Orders
Fig.14
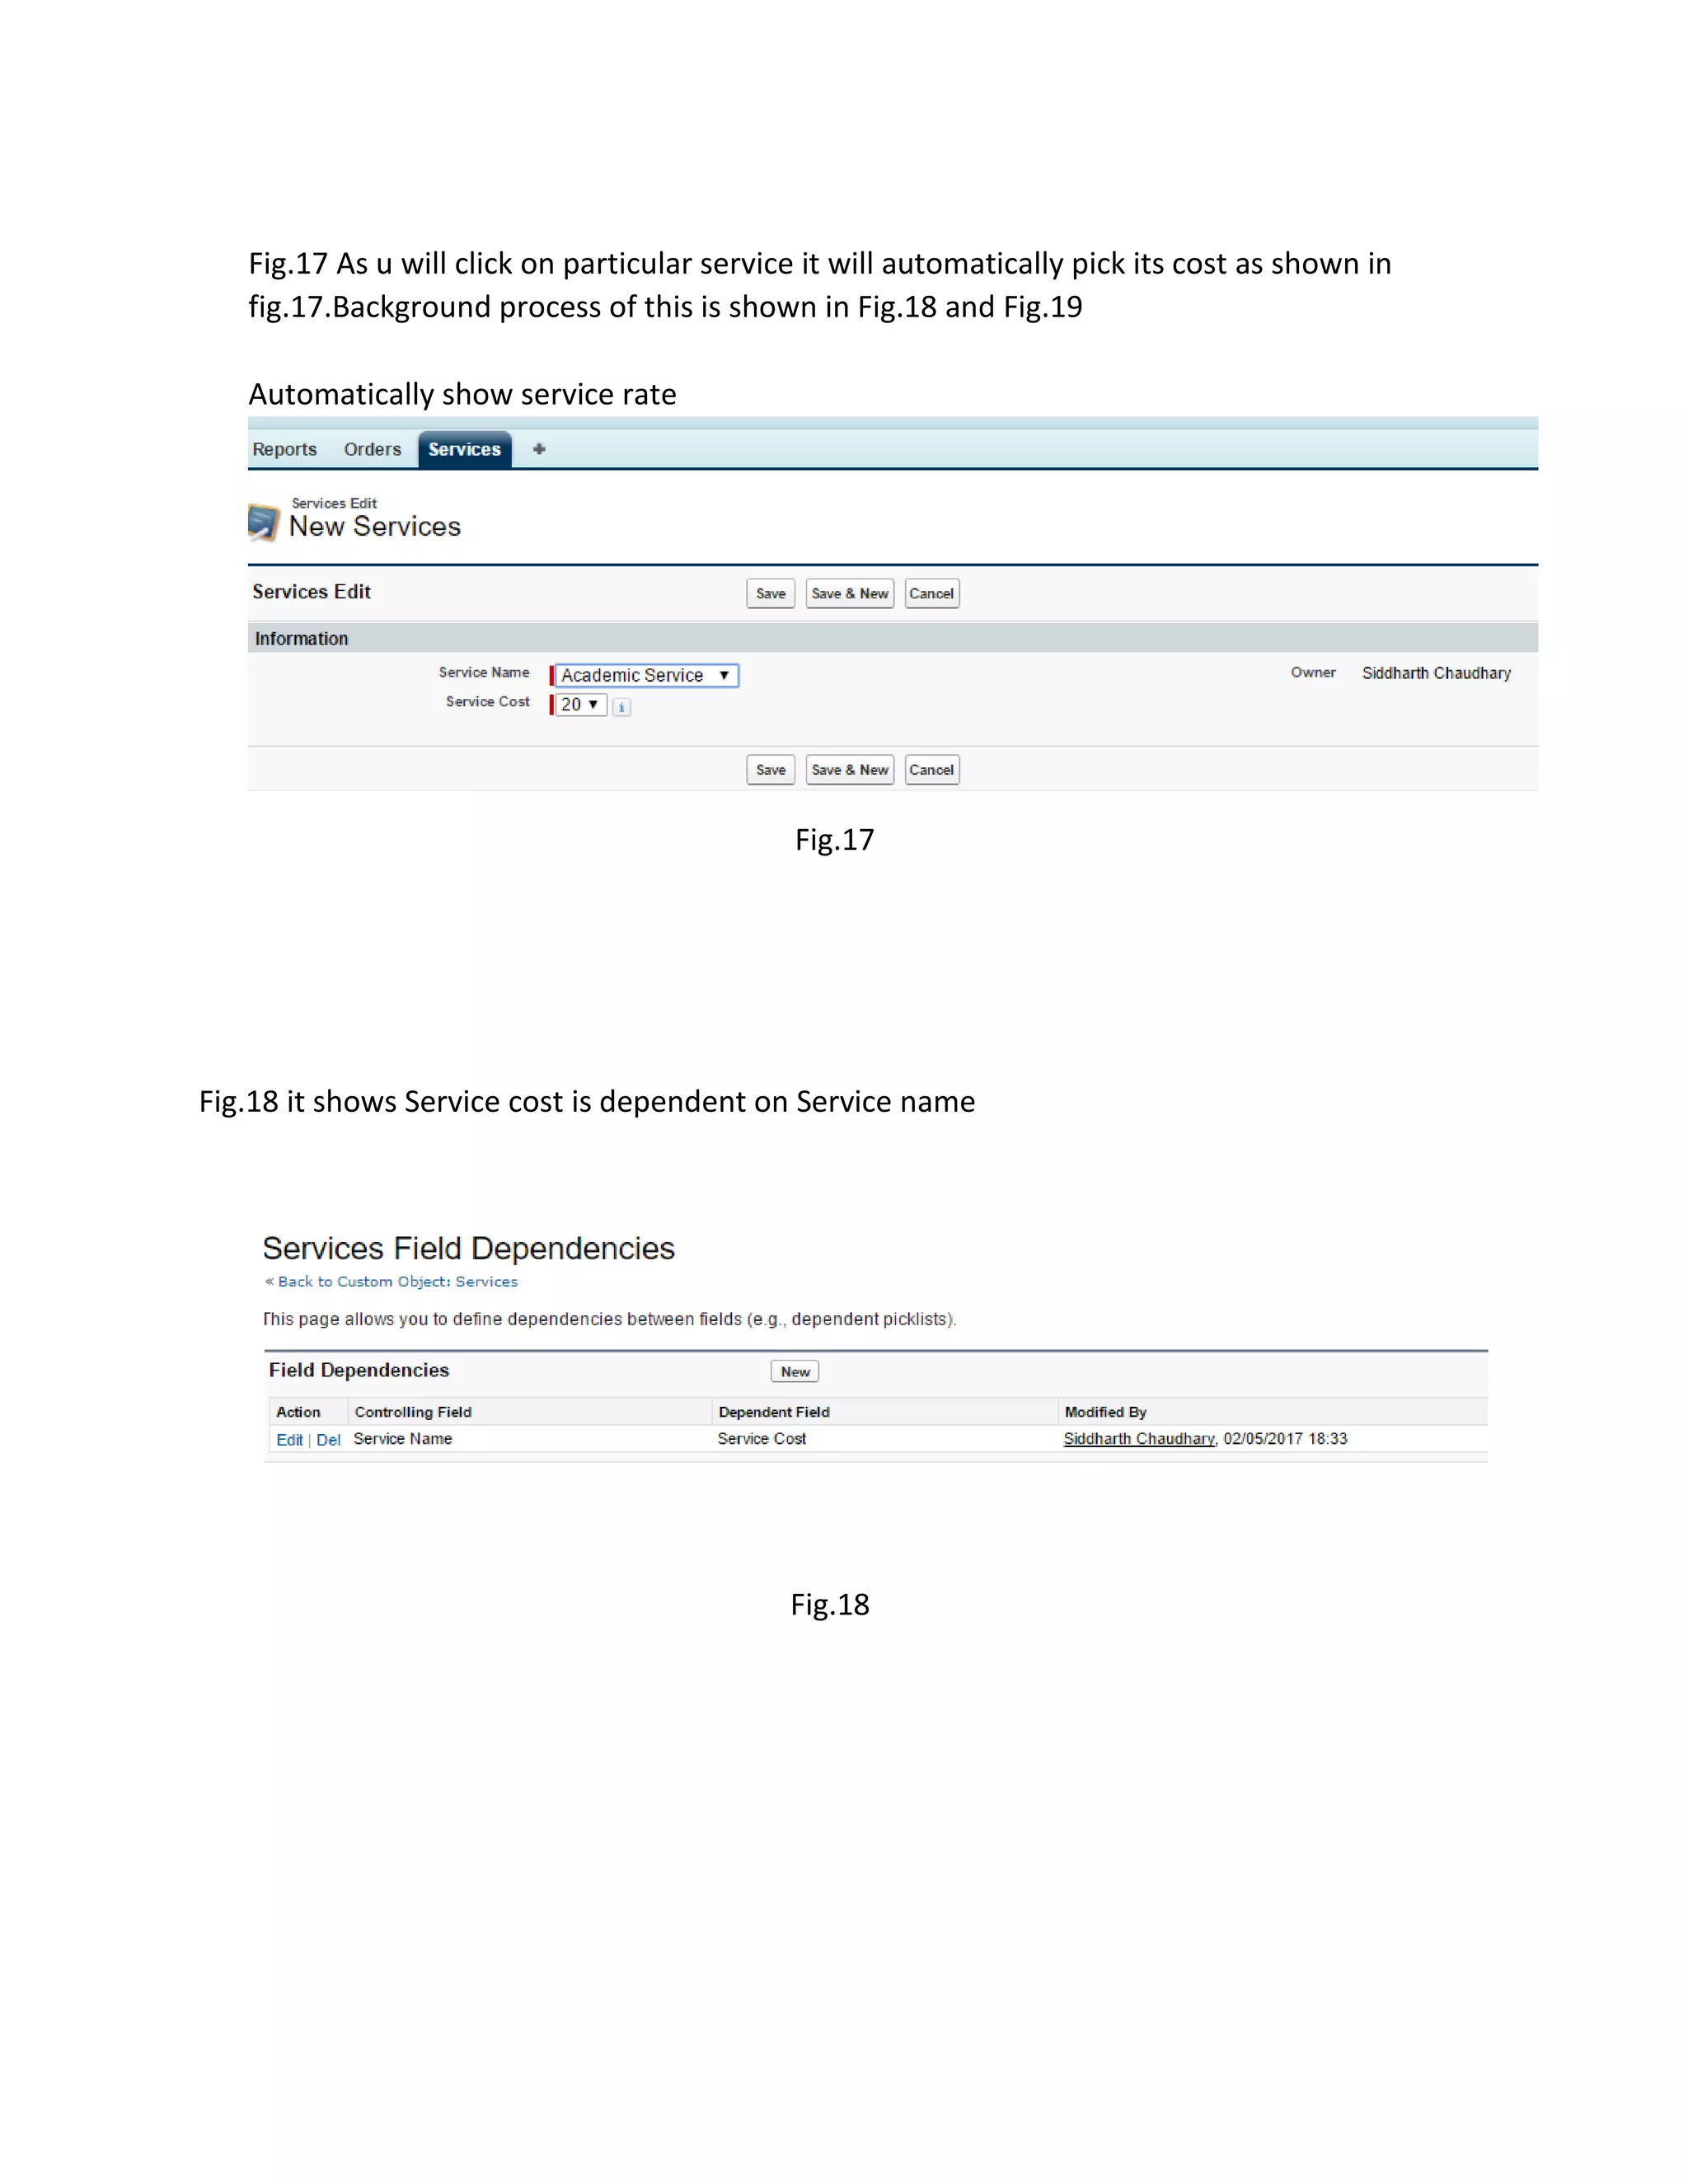
Fig.17 As uwill click on particular service it will automatically pick its cost as shown in
fig.17.Background process of this is shown in Fig.18 and Fig.19
Automatically show service rate
Fig.17
Fig.18 it shows Service cost is dependent on Service name
Fig.18
16.
Fig.19 below Itshows what is the included value for particular service.
Fig.19
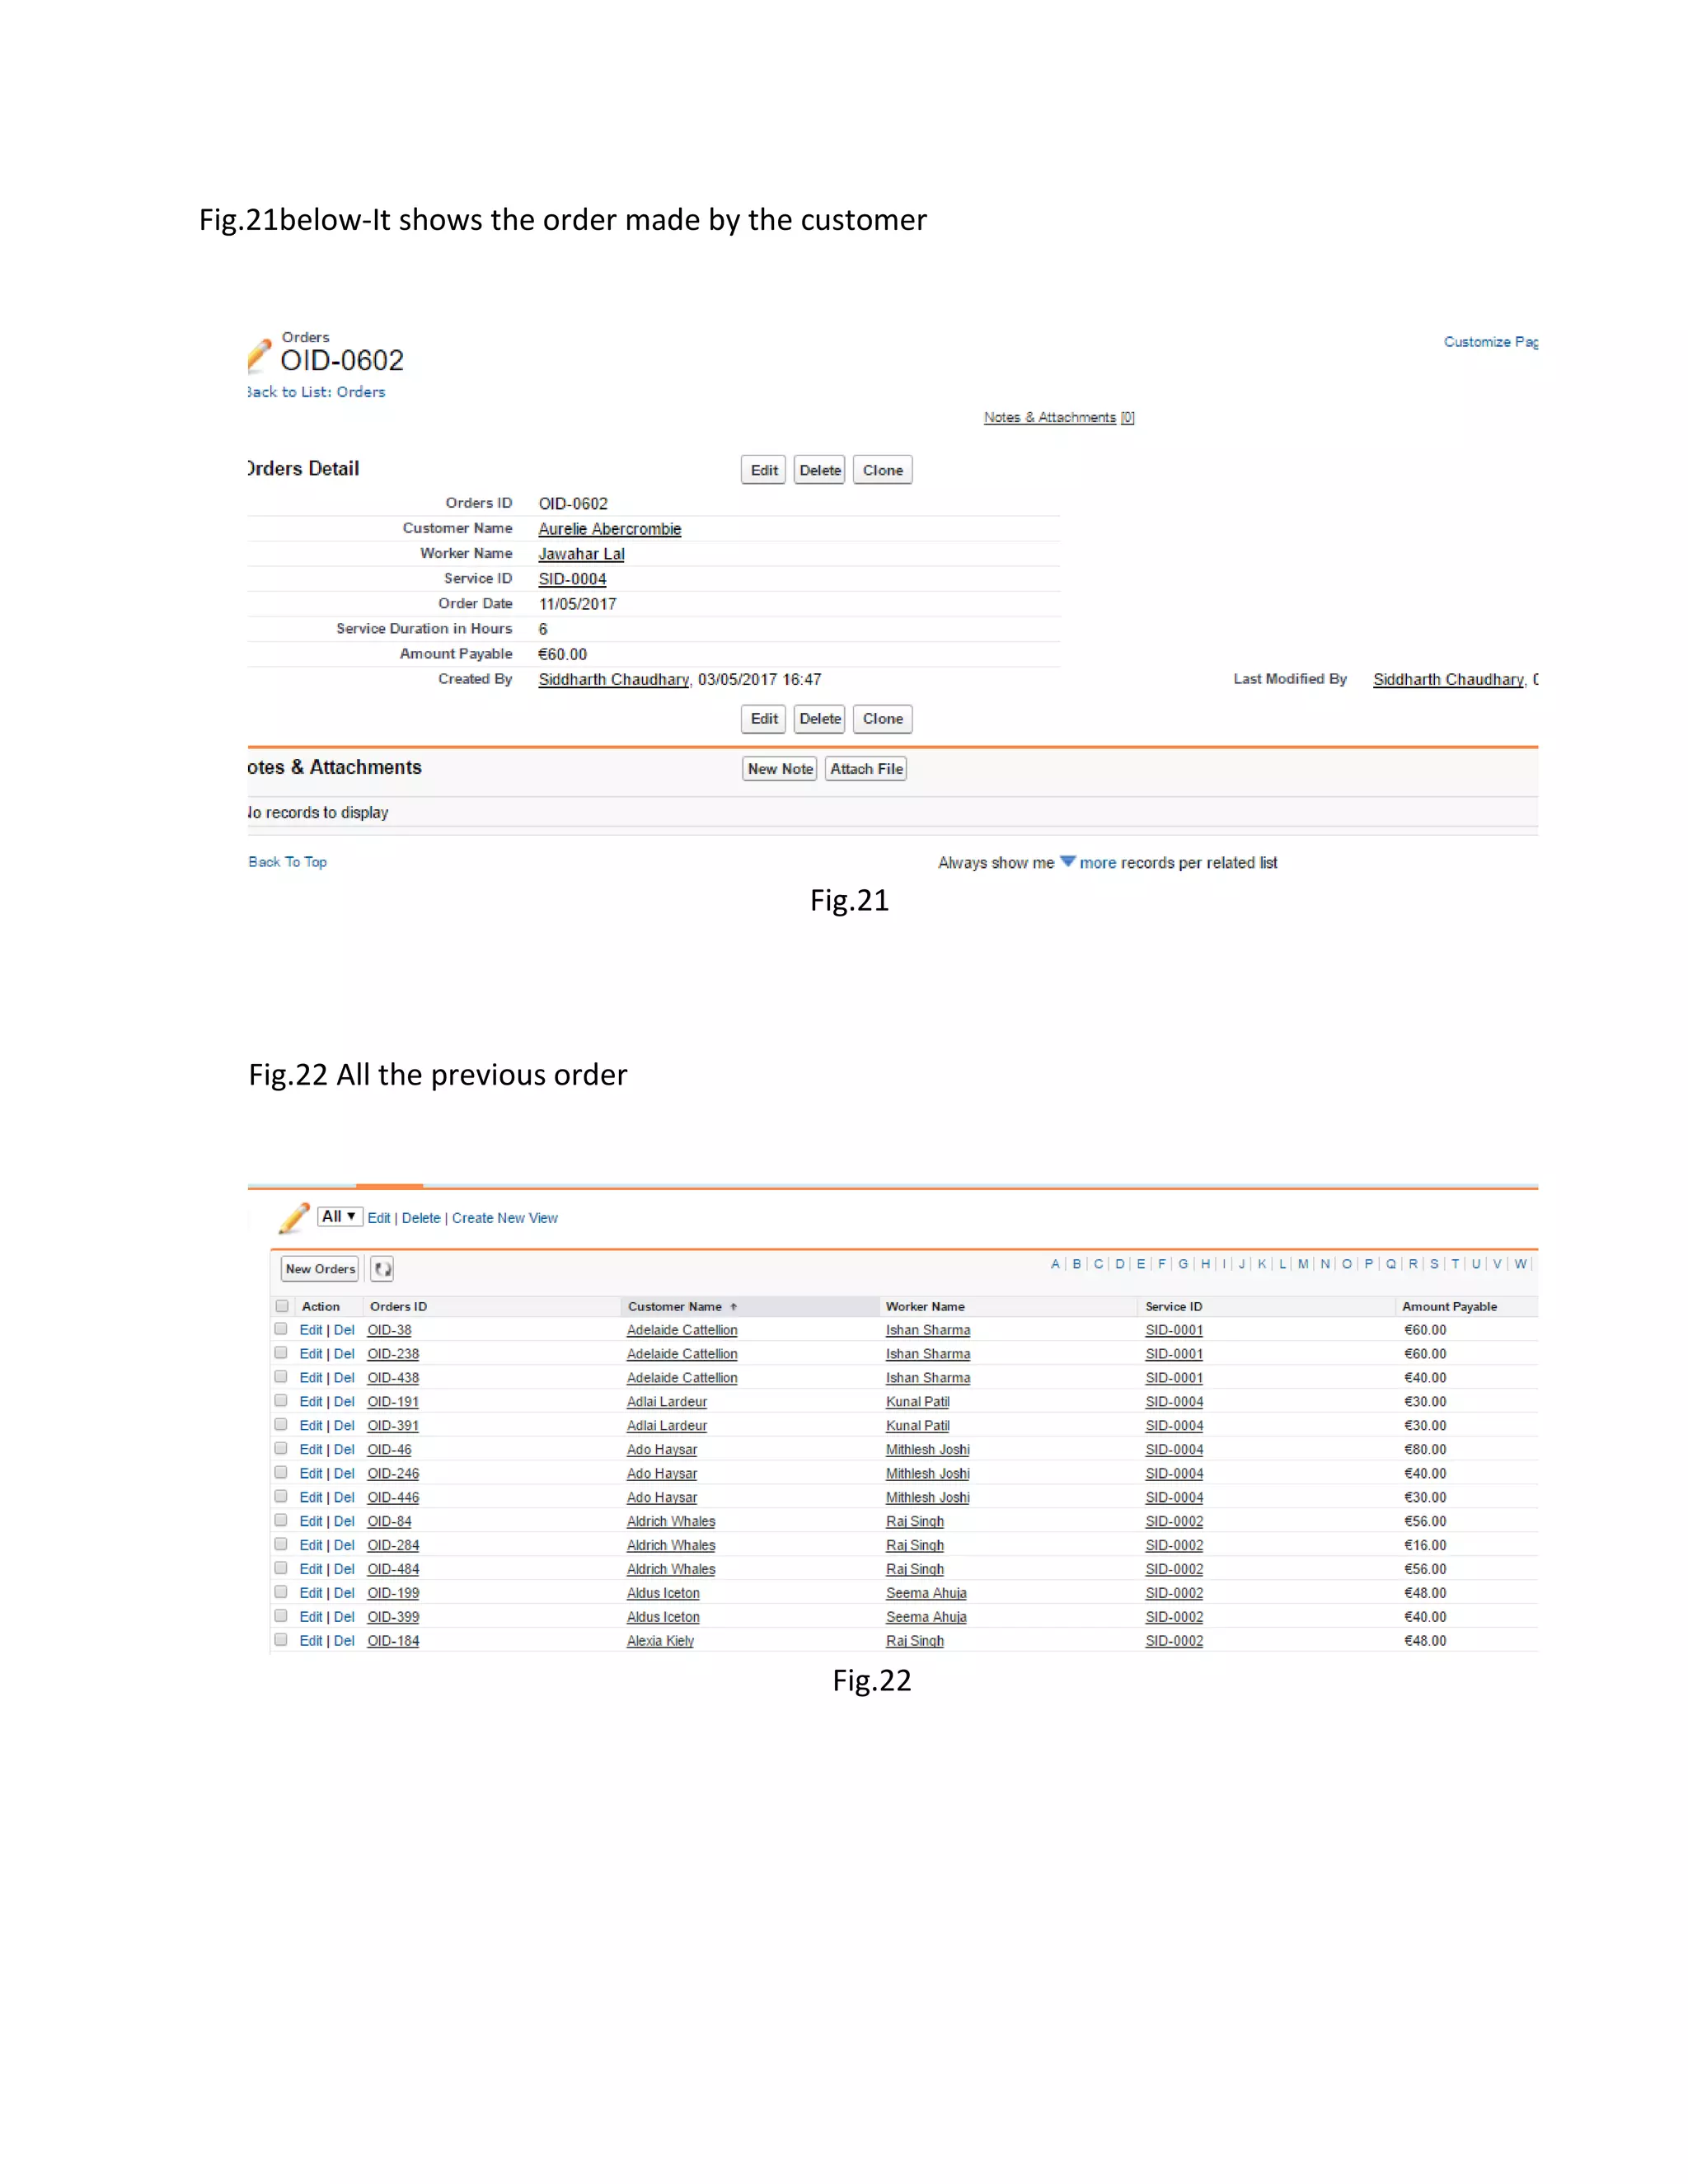
2.Orders
Fig.20 it shows the Order Object information
Fig.20
Fig.23 Validation ruleon date:-It will give an error if customer will enter a past date to make
an order for service
Fig.23
Fig.24 Shows the validation
Fig.24
19.
Fig.25 shows thevalidation rule formula
Fig.25
Fig.26below-Formulae is used for calculating Amount payable as when we enter duration of
service and service used it will automatically generate the amount as shown in Fig.26 and
Fig.27 ,Fig 28 shows the background process.
Fig.26
20.
Fig.27 It showsthe service with its fixed price which is used in calculating Total Amount
Payable.
Fig.27
Fig.28 It shows the formula to calculate the amount payable using service cost of service
object and Duration of service in hours field of orders object.
Fig.28
21.
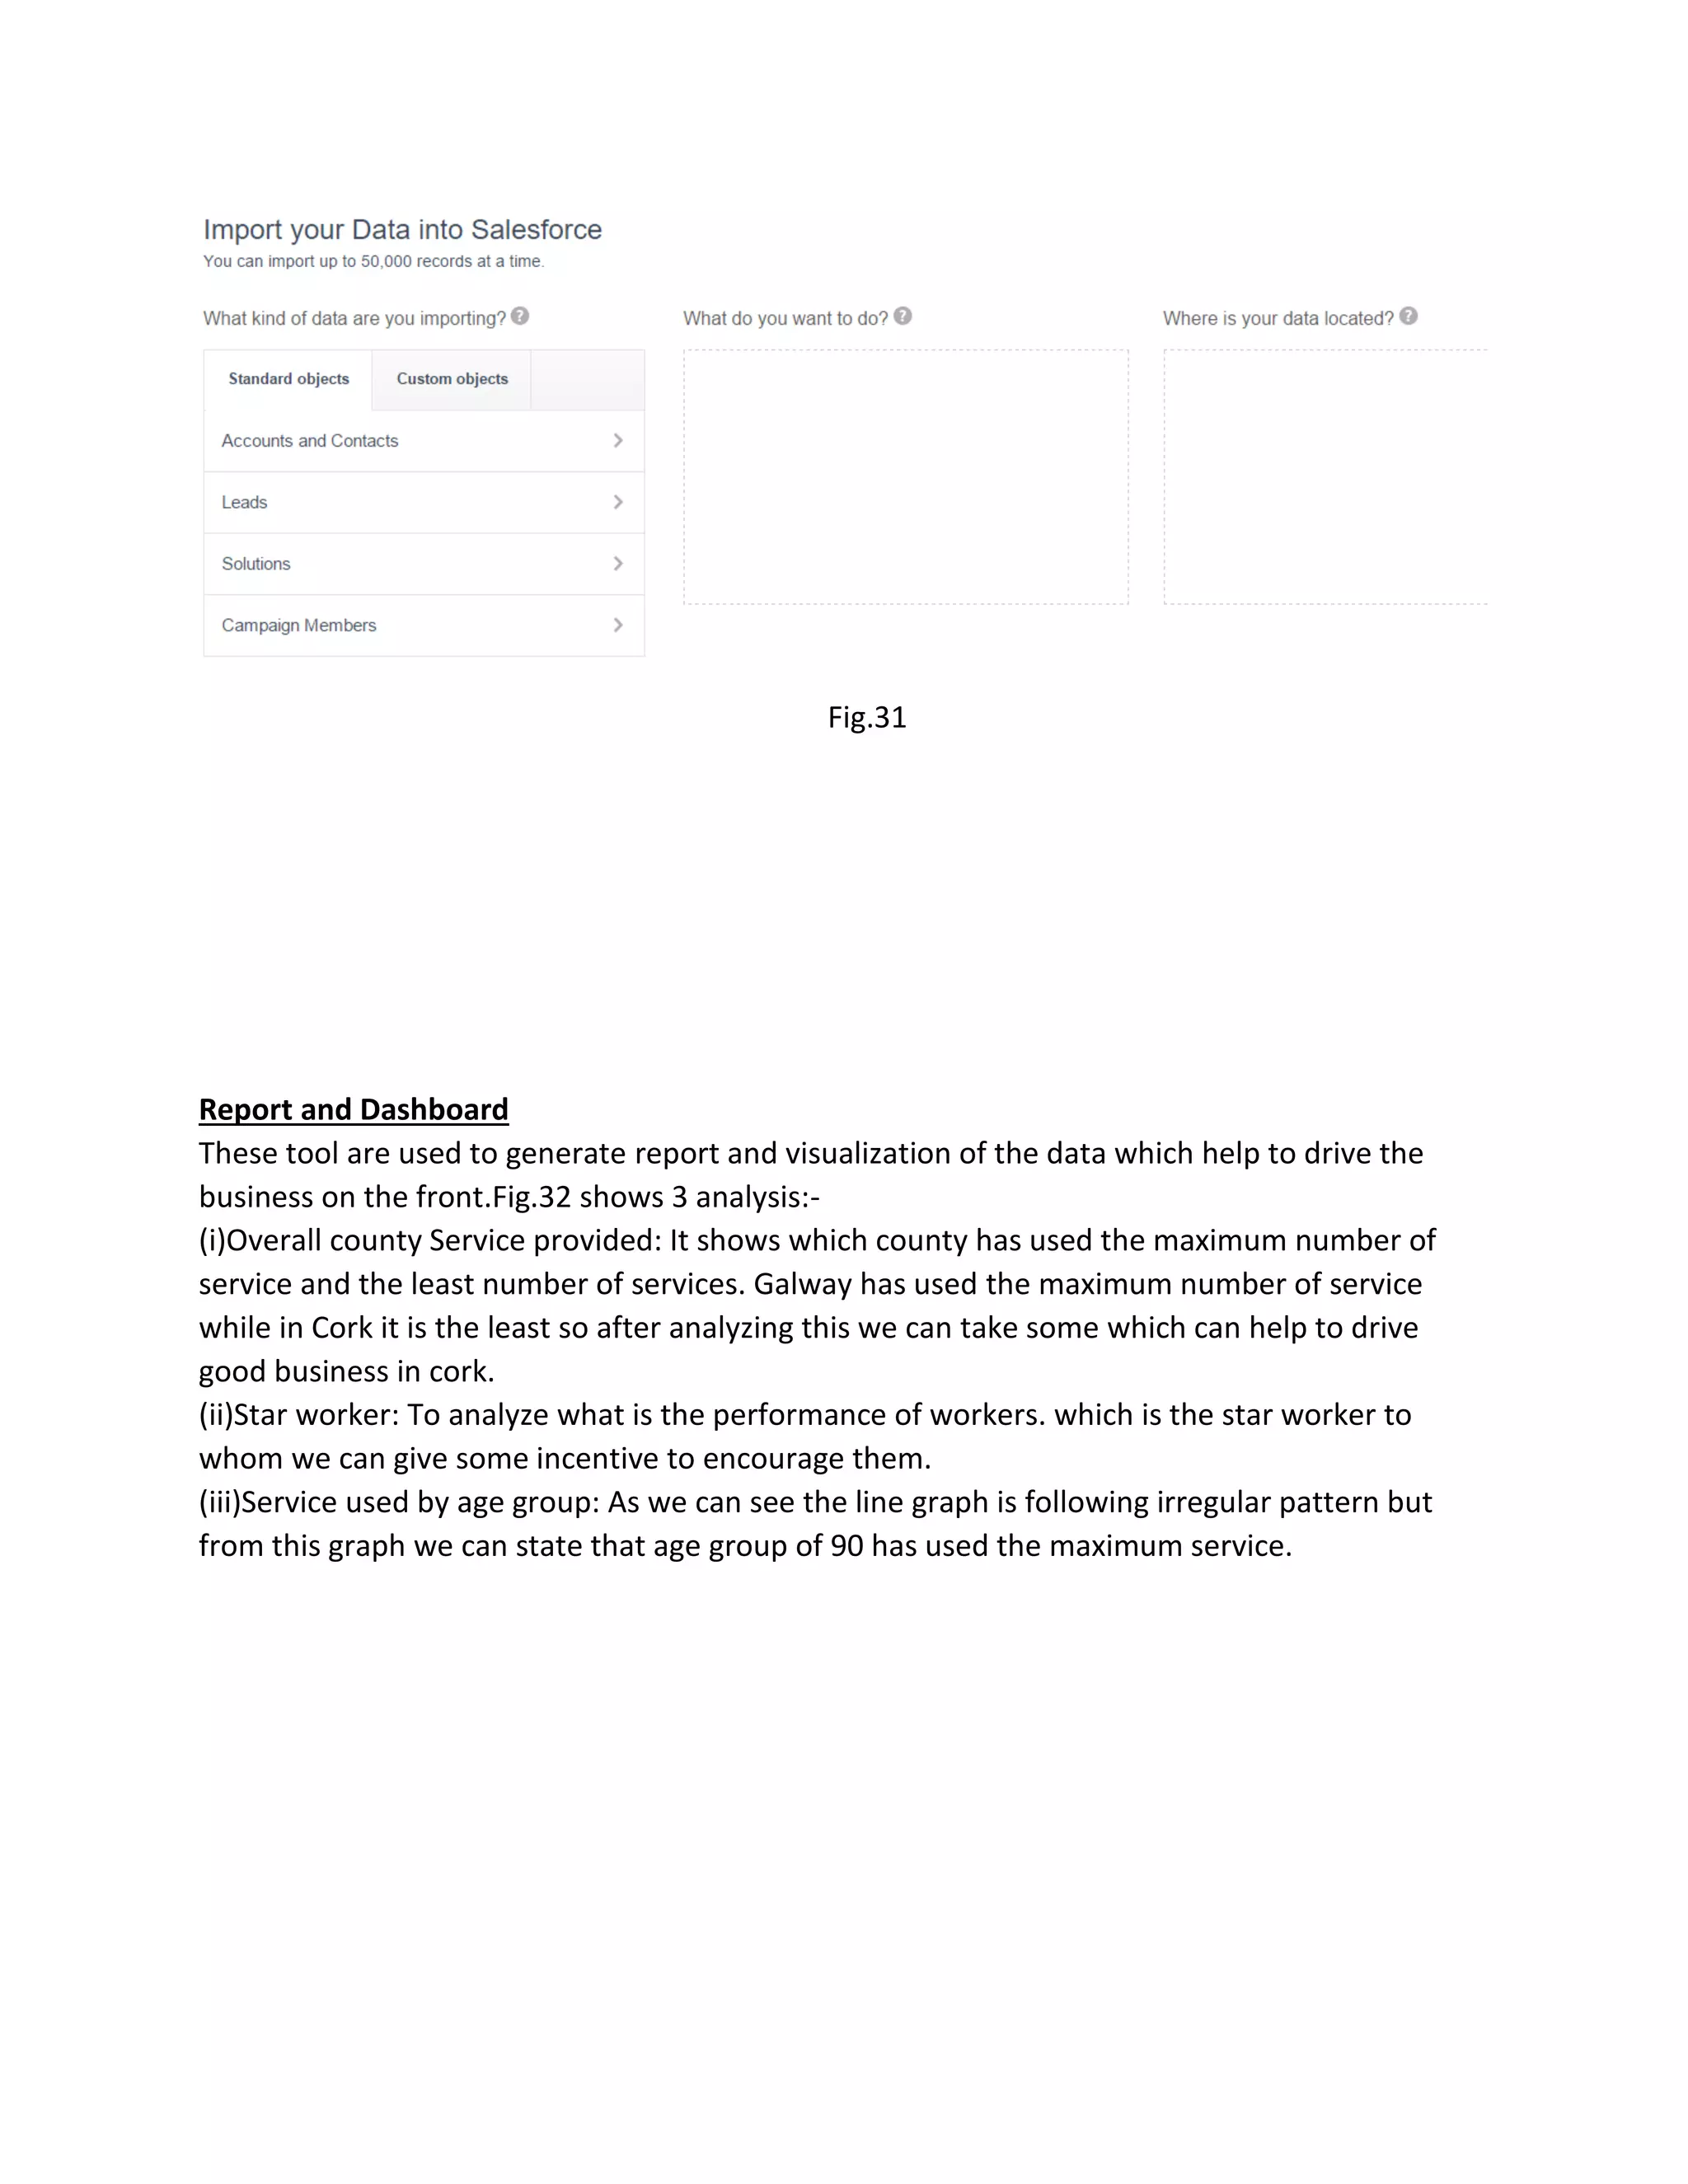
Fig.29,Fig.30,Fig.31 Data isbeing loaded from excel csv file via setup->data import custom
objects
Fig.29
Fig.30
22.
Fig.31
Report and Dashboard
Thesetool are used to generate report and visualization of the data which help to drive the
business on the front.Fig.32 shows 3 analysis:-
(i)Overall county Service provided: It shows which county has used the maximum number of
service and the least number of services. Galway has used the maximum number of service
while in Cork it is the least so after analyzing this we can take some which can help to drive
good business in cork.
(ii)Star worker: To analyze what is the performance of workers. which is the star worker to
whom we can give some incentive to encourage them.
(iii)Service used by age group: As we can see the line graph is following irregular pattern but
from this graph we can state that age group of 90 has used the maximum service.
23.
Fig.32
Report generated bargraph fig.33 shows the maximum number of services used by male or
female. The graph states that male used the maximum service from four of the counties.
Fig.33
24.
Conclusion: Salesforce helpsin improving performance of business as it provides good platform
for building good relation with customer as we can do analysis on historical collected data of
customer. Help in need is an app which need a cloud based tool and salesforce is the best
option.Analysis using dashboard gives an overview which county need more attention to
improve business. so we can say Salesforce integrates all the business flow process.
References:
1. https://success.salesforce.com/


![[DSC Europe 25] Marija Vlajkovic & Andrea Radonjanin - Integration of AI tool...](https://cdn.slidesharecdn.com/ss_thumbnails/qf1jrglttoc3bm8s3aop-final-integration-of-ai-tools-251208151905-394f3a6a-thumbnail.jpg?width=640&height=640&fit=bounds)


![[DSC Europe 25] Petar Zivanov - AI meets documents From chatbots to AI-powere...](https://cdn.slidesharecdn.com/ss_thumbnails/xer2bb6nrdc8pdpev0pc-8-251204082258-7c2fa4a1-thumbnail.jpg?width=640&height=640&fit=bounds)

![[DSC Europe 25] Boris Perkovic - Lost in performance.pptx](https://cdn.slidesharecdn.com/ss_thumbnails/uq5hrp7vsuahqkxzifux-1-251204082258-fd2ee09d-thumbnail.jpg?width=640&height=640&fit=bounds)


![[DSC Europe 25] Bogdan Daniel Maruneac - AI - It starts with you.pptx](https://cdn.slidesharecdn.com/ss_thumbnails/odov3snhrcqs9hx5ny2n-4-251205085715-f1daacfe-thumbnail.jpg?width=640&height=640&fit=bounds)


![[DSC Europe 25] Dragana Ilic - AI for Big Data in Astronomy.pptx](https://cdn.slidesharecdn.com/ss_thumbnails/8palya86qaatvjhva1ms-2-dragana-ilic-ai-ilic-251208151906-652b819c-thumbnail.jpg?width=640&height=640&fit=bounds)


![[DSC Europe 25] Max Talanov - Non digital NNs.pptx](https://cdn.slidesharecdn.com/ss_thumbnails/wif8tr3gtua74qvtopke-non-digital-nns-251205090438-26b0eea6-thumbnail.jpg?width=640&height=640&fit=bounds)