This document describes Siddharth Chaudhary's MSc research project on forecasting solar electricity generation using time series models. The research aims to 1) forecast solar generation in Delhi and Jodhpur, India, 2) evaluate the performance of forecasting models, and 3) compare potential solar generation between the two cities. Four time series models - TBATS, ARIMA, simple exponential smoothing, and Holt's method - are applied to solar radiation data from each city and their accuracy is assessed.
Comparison of Solar Radiation Intensity Forecasting Using ANFIS and Multiple ...journalBEEI
Solar radiation forecasting is important in solar energy power plants (SEPPs) development. The electrical energy generated from the sunlight depends on the weather and climate conditions in the area where the SEPPs are installed. The condition of solar irradiation will indirectly affect the electrical grid system into which the SEPPs are injected, i.e. the amount and direction of the power flow, voltage, frequency, and also the dynamic state of the system. Therefore, the prediction of solar radiation condition is very crucial to identify its impact into the system. There are many methods in determining the prediction of solar radiation, either by mathematical approach or by heuristic approach such as artificial intelligent method. This paper analyzes the comparison of two methods, Adaptive Neuro Fuzzy Inference (ANFIS) method, which belongs into the heuristic methods, and Multiple Linear Regression (MLP) method, which uses a mathematical approach. The performance of both methods is measured using the root mean square error (RMSE) and the mean absolute error (MAE) values. The data of the Swiss Basel city from Meteoblue are used to test the performance of the two methods being compared. The data are divided into four cases, being classified as the training data and the data used as predictions. The solar radiation prediction using the ANFIS method indicates the results which are closer to the real measurement results, being compared to the the use MLP method. The average values of RMSE and MAE achieved are 123.27 W/m2 and 90.91 W/m2 using the ANFIS method, being compared to 138.70 W/m2 and 101.56 W/m2 respectively using the MLP method. The ANFIS method gives better prediction performance of 12.51% for RMSE and 11.71% for MAE with respect to the use of the MLP method.
A Comparative study on Different ANN Techniques in Wind Speed Forecasting for...IOSRJEEE
There are several available renewable sources of energy, among which Wind Power is the one which is most uncertain in nature. This is because wind speed changes continuously with time leading to uncertainty in availability of amount of wind power generated. Hence, a short-term forecasting of wind speed will help in prior estimation of wind power generation availability for the grid and economic load dispatch.This paper present a comparative study of a Wind speed forecasting model using Artificial Neural Networks (ANN) with three different learning algorithms. ANN is used because it is a non-linear data driven, adaptive and very powerful tool for forecasting purposes. Here an attempt is made to forecast Wind Speed using ANN with Levenberg-Marquard (LM) algorithm, Scaled Conjugate Gradient (SCG) algorithm and Bayesian Regularization (BR) algorithm and their results are compared based on their convergence speed in training period and their performance in testing period on the basis of Mean Absolute Error (MAE), Mean Absolute Percentage Error (MAPE) and Mean Square Error (MSE).A 48 hour ahead wind speed is forecasted in this work and it is compared with the measured values using all three algorithms and the best out of the three is selected based on minimum error.
A review of techniques in optimal sizing of hybrid renewable energy systemseSAT Journals
Abstract This paper presents a review of techniques usedin recent published works on optimal sizing of hybrid renewable energy sources. Hybridization of renewable energy sources is an emergent promising trend born out of the need to fully utilize and solve problems associated with the reliability of renewable energy resources such as wind and solar. Exploitation of these resources has been instrumental in tackling or mitigating present day energy problems such as price instability for fossil based fuels, global warming and climate change in addition to being seen as way of meeting future demand for power. This paper targets researchers in the renewable energy space and the general public seeking to inform them on trends in methods applied in optimal sizing of hybrid renewable energy sources as well as to provide a scope into what has been done in this field. In reviewing previous works, a two prong approach has been used focusing attention on the sizing methods used in the reviewed works as well as the performance indices used to check quality by these works. In summary there is a clear indication of increased interest in recent years in optimal sizing of hybrid renewable energy resources with metaheuristic approaches such as Genetic Algorithms and Particle Swarm Optimization coming out as very interesting to researchers. It has also been observed that resources being hybridized are those with complementary regimes on specific sites.
Index Terms - Energy storage, hybrid power systems, optimization methods, renewable energy sources, reviews, solar energy, wind energy.
In this deck from GTC 2019, Seongchan Kim, Ph.D. presents: How Deep Learning Could Predict Weather Events.
"How do meteorologists predict weather or weather events such as hurricanes, typhoons, and heavy rain? Predicting weather events were done based on supercomputer (HPC) simulations using numerical models such as WRF, UM, and MPAS. But recently, many deep learning-based researches have been showing various kinds of outstanding results. We'll introduce several case studies related to meteorological researches. We'll also describe how the meteorological tasks are different from general deep learning tasks, their detailed approaches, and their input data such as weather radar images and satellite images. We'll also cover typhoon detection and tracking, rainfall amount prediction, forecasting future cloud figure, and more."
Watch the video: https://wp.me/p3RLHQ-k2T
Learn more: http://en.kisti.re.kr/
and
https://www.nvidia.com/en-us/gtc/
Sign up for our insideHPC Newsletter: http://insidehpc.com/newsletter
Performed analysis on Temperature, Wind Speed, Humidity and Pressure data-sets and implemented decision tree & clustering to predict possibility of rain
Created graphs and plots using algorithms such as k-nearest neighbors, naïve bayes, decision tree and k means clustering
Performance improvement of a Rainfall Prediction Model using Particle Swarm O...ijceronline
The performances of the statistical methods of time series forecast can be improved by precise selection of their parameters. Various techniques are being applied to improve the modeling accuracy of these models. Particle swarm optimization is one such technique which can be conveniently used to determine the model parameters accurately. This robust optimization technique has already been applied to improve the performance of artificial neural networks for time series prediction. This study uses particle swarm optimization technique to determine the parameters of an exponential autoregressive model for time series prediction. The model is applied for annual rainfall prediction and it shows a fairly good performance in comparison to the statistical ARIMA model
Solar Photovoltaic Power Forecasting in Jordan using Artificial Neural NetworksIJECEIAES
In this paper, Artificial Neural Networks (ANNs) are used to study the correlations between solar irradiance and solar photovoltaic (PV) output power which can be used for the development of a real-time prediction model to predict the next day produced power. Solar irradiance records were measured by ASU weather station located on the campus of Applied Science Private University (ASU), Amman, Jordan and the solar PV power outputs were extracted from the installed 264KWp power plant at the university. Intensive training experiments were carried out on 19249 records of data to find the optimum NN configurations and the testing results show excellent overall performance in the prediction of next 24 hours output power in KW reaching a Root Mean Square Error (RMSE) value of 0.0721. This research shows that machine learning algorithms hold some promise for the prediction of power production based on various weather conditions and measures which help in the management of energy flows and the optimisation of integrating PV plants into power systems.
Overview of MediaEval 2020 Insights for Wellbeing: Multimodal Personal Health...multimediaeval
Paper: http://ceur-ws.org/Vol-2882/paper11.pdf
YouTube: https://youtu.be/fBPuacAZkxs
Minh-Son Dao, Peijiang Zhao, Thanh Nguyen, Thanh Binh Nguyen, Duc Tien Dang Nguyen and Cathal Gurrin : Overview of MediaEval 2020 Insights for Wellbeing: Multimodal Personal Health Lifelog Data Analysis. Proc. of MediaEval 2020, 14-15 December 2020, Online.
This paper provides a description of the MediaEval 2020 “Multimodal personal health lifelog data analysis". The purpose of this task is to develop approaches that process the environment data to obtain insights about personal wellbeing. Establishing the association between people’s wellbeing and properties of the surrounding environment which is vital for numerous research. Our task focuses on the internal associations of heterogeneous data. Participants create systems that derive insights from multimodal lifelog data that are important for health and wellbeing to tackle two challenging subtasks. The first task is to investigate whether we can use public/open data to predict personal air pollution data. The second task is to develop approaches to predict personal air quality index(AQI) using images captured by people (plus GAQD). This task targets (but is not limited to) researchers in the areas of multimedia information retrieval, machine learning, AI, data science, event-based processing and analysis, multimodal multimedia content analysis, lifelog data analysis, urban computing, environmental science, and atmospheric science.
Presented by: Peijiang Zhao
Applying of Double Seasonal ARIMA Model for Electrical Power Demand Forecasti...IJECEIAES
The prediction of the use of electric power is very important to maintain a balance between the supply and demand of electric power in the power generation system. Due to a fluctuating of electrical power demand in the electricity load center, an accurate forecasting method is required to maintain the efficiency and reliability of power generation system continuously. Such conditions greatly affect the dynamic stability of power generation systems. The objective of this research is to propose Double Seasonal Autoregressive Integrated Moving Average (DSARIMA) to predict electricity load. Half hourly load data for of three years period at PT. PLN Gresik Indonesia power plant unit are used as case study. The parameters of DSARIMA model are estimated by using least squares method. The result shows that the best model to predict these data is subset DSARIMA with order ( [ 1,2,7,16,18,35,46 ] , 1, [ 1,3,13,21,27,46 ] )( 1,1,1 ) 48 ( 0,0,1 ) 336 with MAPE about 2.06%. Thus, future research could be done by using these predictive results as models of optimal control parameters on the power system side.
This presentation is a comparison of different clustering based on their computational time. This is the first step in creating open source and bespoke Geodemographic classifications in near real time.
Big Data Framework for Predictive Risk Assessment of Weather Impacts on Elect...Power System Operation
Loss of electric power leads to major economic, social, and environmental impacts. It is estimated that the Annual economic impacts from weather-related electric grid outages in the U.S. result in as high as $150 billion. Due to the high level of environmental exposure of the electric utility overhead infrastructure, the most dominant cause of electricity outages is weather impact. More than 70% of electric power outages are caused by weather, either directly (e.g., lightning strikes to the equipment, trees coming in contact with lines under high wind speeds), or indirectly due to weather-caused increases in equipment deterioration rates or overloading (e.g. insulation deterioration, line overloading due to high temperature causing high demand). This paper illustrates how the impact of severe weather can be significantly reduced, and in some cases even eliminated, by accurate prediction of where faults may occur and what equipment may be vulnerable. With this predicted assessment of network vulnerabilities and expected exposure, adequate mitigation approaches can be deployed.
To solve the problem, variety of approaches have been deployed but none seem to be addressing the problem comprehensively. We are introducing a predictive approach that uses Big Data analytics based on machine learning using variety of utility measurements and data not coming from utility infrastructure, such as weather, lightning, vegetation, and geographical data, which also comes in great volumes, is necessary. The goal of this paper is to provide a comprehensive description of the use of Big Data to assess weather impacts on utility assets. In the study reported in this paper a unified data framework that enables collection and spatiotemporal correlation of variety of data sets is developed. Different prediction algorithms based on linear and logistic regression are used. The spatial and temporal dependencies between components and events in the smart grid are leveraged for the high accuracy of the prediction algorithms, and its capability to deal with missing and bad data. The study approach is tested on following applications related to weather impacts on electric networks: 1) Outage prediction in Transmission, 2) Transmission Line Insulation Coordination, 3) Distribution Vegetation Management, 4) Distribution Transformer Outage Prediction, and 5) Solar Generation Forecast. The algorithms shows high accuracy of prediction for all applications of interest.
Tuning energy consumption strategies in the railway domain: a model-based app...Davide Basile
Disclaimer: this is a rehearsal for a conference and has not been elaborated nor was meant to be published, the audio and video are rough and may contain imperfections, there is no pointer and audio/video may be out of synch.
I decided to publish these videos afterwards as further material to complement the published papers.
Cuckoo Search Algorithm for Congestion Alleviation with Incorporation of Wind...IJECEIAES
The issue to alleviate congestion in the power system framework has emerged as an alluring field for the power system researchers. The research conducted in this article proposes a cuckoo search algorithm-based congestion alleviation strategy with the incorporation of wind farm. The bus sensitivity factor data are computed and utilized to sort out the sutiable position for the installation of the wind farm. The generators contributing in the real power rescheduleing process are selected as per the generator sensitivity values. The cuckoo search algorithm is implemented to minimize the congestion cost with the embodiment of the wind farm. The proposed method is tested on 39 bus New England framework and the results obtained with the cuckoo search-based congestion management approach outperforms the results opted with other heuristic optimization techniques in the past research literatures.
Use Visual Features From Surrounding Scenes to Improve Personal Air Quality ...multimediaeval
Paper: http://ceur-ws.org/Vol-2882/paper40.pdf
YouTube: https://youtu.be/SL5Hvu1mARY
Trung-Quan Nguyen, Dang-Hieu Nguyen and Loc Tai Tan Nguyen : Use Visual Features From Surrounding Scenes to Improve Personal Air Quality Data Prediction Performance. Proc. of MediaEval 2020, 14-15 December 2020, Online.
In this paper, we propose a method to predict the personal air quality index in an area by using the combination of the levels of the following pollutants: PM2.5, NO2, and O3, measured from the nearby weather stations of that area, and the photos of surrounding scenes taken at that area. Our approach uses the Inverse Distance Weighted (IDW) technique to estimate the missing air pollutant levels and then use regression to integrate visual features from taken photos to optimize the predicted values. After that, we can use those values to calculate the Air Quality Index (AQI). The results show that the proposed method may not improve the performance of the prediction in some cases.
IMPROVED NEURAL NETWORK PREDICTION PERFORMANCES OF ELECTRICITY DEMAND: MODIFY...csandit
Accurate prediction of electricity demand can bring extensive benefits to any country as the
forecast values help the relevant authorities to take decisions regarding electricity generation,
transmission and distribution much appropriately. The literature reveals that, when compared
to conventional time series techniques, the improved artificial intelligent approaches provide
better prediction accuracies. However, the accuracy of predictions using intelligent approaches
like neural networks are strongly influenced by the correct selection of inputs and the number of
neuro-forecasters used for prediction. This research shows how a cluster analysis performed to
group similar day types, could contribute towards selecting a better set of neuro-forecasters in
neural networks. Daily total electricity demands for five years were considered for the analysis
and each date was assigned to one of the thirteen day-types, in a Sri Lankan context. As a
stochastic trend could be seen over the years, prior to performing the k-means clustering, the
trend was removed by taking the first difference of the series. Three different clusters were
found using Silhouette plots, and thus three neuro-forecasters were used for predictions. This
paper illustrates the proposed modified neural network procedure using electricity demand
data.
Forecasting long term global solar radiation with an ann algorithmmehmet şahin
and energy-efficient buildings, solar concentrators, photovoltaic-systems and a site-selection of sites for future
power plants). To establish long-term sustainability of solar energy, energy practitioners utilize versatile
predictive models of G as an indispensable decision-making tool. Notwithstanding this, sparsity of solar sites,
instrument maintenance, policy and fiscal issues constraint the availability of model input data that must be
used for forecasting the onsite value of G. To surmount these challenge, low-cost, readily-available satellite
products accessible over large spatial domains can provide viable alternatives. In this paper, the preciseness of
artificial neural network (ANN) for predictive modelling of G is evaluated for regional Queensland, which
employed Moderate Resolution Imaging Spectroradiometer (MODIS) land-surface temperature (LST) as an
effective predictor. To couple an ANN model with satellite-derived variable, the LST data over 2012–2014 are
acquired in seven groups, with three sites per group where the data for first two (2012–2013) are utilised for
model development and the third (2014) group for cross-validation. For monthly horizon, the ANN model is
optimized by trialing 55 neuronal architectures, while for seasonal forecasting, nine neuronal architectures are
trailed with time-lagged LST. ANN coupled with zero lagged LST utilised scaled conjugate gradient algorithm,
and while ANN with time-lagged LST utilised Levenberg-Marquardt algorithm. To ascertain conclusive results,
the objective model is evaluated via multiple linear regression (MLR) and autoregressive integrated moving
average (ARIMA) algorithms. Results showed that an ANN model outperformed MLR and ARIMA models
where an analysis yielded 39% of cumulative errors in smallest magnitude bracket, whereas MLR and ARIMA
produced 15% and 25%. Superiority of an ANN model was demonstrated by site-averaged (monthly) relative
error of 5.85% compared with 10.23% (MLR) and 9.60 (ARIMA) with Willmott's Index of 0.954 (ANN), 0.899
(MLR) and 0.848 (ARIMA). This work ascertains that an ANN model coupled with satellite-derived LST data
can be adopted as a qualified stratagem for the proliferation of solar energy applications in locations that have
an appropriate satellite footprint.
Prediction of the Power Output of Solar Cells Using Neural Networks: Solar Ce...CSCJournals
The prediction of the output power of solar cells in a given place has always been an important factor in planning the installation of solar cell panels, and guiding electrical companies to control, manage and distribute the energy into their electricity networks properly. The production of the electricity sector in Palestine using solar cells is a promising sector; this paper proposes a model which is used to predict future output power values of solar cells, which provides individuals and companies with future information, so they can organize their activities. We aim to create a model that able to connect time, place, and the relations between randomly distributed solar energy units. The system analyzes collected data from units through solar cells distributed in different places in Palestine. Multilayer Feed-Forward with Backpropagation Neural Networks (MFFNNBP) is used to predict the power output of the solar cells in different places in Palestine. The model depends on predicting the future produce of the power output of solar cell depending on the real power output of the previous values. The data used in this paper depends on data collection of one day, month, and year. Finally, this proposed model conduct a systematic process with the aim of determining the most suitable places for an installation solar cell panel in different places in Palestine.
Calculation of solar radiation by using regression methodsmehmet şahin
Abstract. In this study, solar radiation was estimated at 53 location over Turkey with
varying climatic conditions using the Linear, Ridge, Lasso, Smoother, Partial least, KNN
and Gaussian process regression methods. The data of 2002 and 2003 years were used to
obtain regression coefficients of relevant methods. The coefficients were obtained based on
the input parameters. Input parameters were month, altitude, latitude, longitude and landsurface
temperature (LST).The values for LST were obtained from the data of the National
Oceanic and Atmospheric Administration Advanced Very High Resolution Radiometer
(NOAA-AVHRR) satellite. Solar radiation was calculated using obtained coefficients in
regression methods for 2004 year. The results were compared statistically. The most
successful method was Gaussian process regression method. The most unsuccessful method
was lasso regression method. While means bias error (MBE) value of Gaussian process
regression method was 0,274 MJ/m2, root mean square error (RMSE) value of method was
calculated as 2,260 MJ/m2. The correlation coefficient of related method was calculated as
0,941. Statistical results are consistent with the literature. Used the Gaussian process
regression method is recommended for other studies.
A MODEL DRIVEN OPTIMIZATION APPROACH TO DETERMINE TILT ANGLE OF SOLAR COLLECT...IAEME Publication
The solar systems are an intense need to full fill the energy requirement of developing countries like India. Where, thermal and photovoltaic are the two methods to utilize the solar energy directly from sun. In these methods solar equipments (e.g. flat plat collector and Photovoltaic panel) are kept in tilted position for absorbing maximum solar flux. Hence, finding the optimum tilt angle is the problem of optimization. Therefore, in this paper model driven optimization approach such as particle swarm optimization (PSO) estimator has been proposed to find optimum tilt angle and its results are compared with analytical results. A novel cost function has been applied to determine periodical optimum tilt angle. To validate the performance of PSO estimator results, statistical analysis study is carried out. Where, three statistical approaches such as descriptive method, direct method and Altman-Bland methods are adopted. The PSO estimator results are found satisfactory to ANA results at 95% confidence interval under statistical study.
The two main challenges of predicting the wind speed depend on various atmospheric factors and random variables. This paper explores the possibility of developing a wind speed prediction model using different Artificial Neural Networks (ANNs) and Categorical Regression empirical model which could be used to estimate the wind speed in Coimbatore, Tamil Nadu, India using SPSS software. The proposed Neural Network models are tested on real time wind data and enhanced with statistical capabilities. The objective is to predict accurate wind speed and to perform better in terms of minimization of errors using Multi Layer Perception Neural Network (MLPNN), Radial Basis Function Neural Network (RBFNN) and Categorical Regression (CATREG). Results from the paper have shown good agreement between the estimated and measured values of wind speed.
Optimal artificial neural network configurations for hourly solar irradiation...IJECEIAES
Solar energy is widely used in order to generate clean electric energy. However, due to its intermittent nature, this resource is only inserted in a limited way within the electrical networks. To increase the share of solar energy in the energy balance and allow better management of its production, it is necessary to know precisely the available solar potential at a fine time step to take into account all these stochastic variations. In this paper, a comparison between different artificial neural network (ANN) configurations is elaborated to estimate the hourly solar irradiation. An investigation of the optimal neurons and layers is investigated. To this end, feedforward neural network, cascade forward neural network and fitting neural network have been applied for this purpose. In this context, we have used different meteorological parameters to estimate the hourly global solar irirradiation in the region of Laghouat, Algeria. The validation process shows that choosing the cascade forward neural network two inputs gives an R2 value equal to 97.24% and an normalized root mean square error (NRMSE) equals to 0.1678 compared to the results of three inputs, which gives an R2 value equaled to 95.54% and an NRMSE equals to 0.2252. The comparison between different existing methods in literature show the goodness of the proposed models.
Time Series Data Analysis for Forecasting – A Literature ReviewIJMER
In today's world there is ample opportunity to clout the numerous sources of time series data
available for decision making. This time ordered data can be used to improve decision making if the data
is converted to information and then into knowledge which is called knowledge discovery. Data Mining
(DM) methods are being increasingly used in prediction with time series data, in addition to traditional
statistical approaches. This paper presents a literature review of the use of DM and statistical approaches
with time series data, focusing on weather prediction. This is an area that has been attracting a great deal
of attention from researchers in the field.
Implemented various classification models using R language to identify which one performs best for prediction of soil fertility and which properties are important in defining the fertility of soil.
Project on nypd accident analysis using hadoop environmentSiddharth Chaudhary
For this project NYC motor-vehicle-collisions dataset is processed in Hadoop ecosystem using map reduce, Pig script and Hive query for analysis and visualization.
Made a Visualisation project Report by using R packages(ggplot) on the Global terrorism dataset(1970-2015) using different interactive graphs, different combination of colours had been used so that colour blind people can also visualise the patterns.
Implemented Data warehouse on “Retail Stores of five states of USA” by using 3 different data sources including structured and unstructured using SSIS, SSAS and Power BI.
Implemented salesforce and CRM application, in this application employees and customers are sharing same platform which increases productivity and saves time for customers.
Developed a home security system to protect occupants from fire and intrusion. The device sends SMS to the emergency number provided to it via GSM (Global System for Mobile communications) module. Led my group and implemented the device successfully.
Generated a Statistical Report on air quality of Ireland (correlation and regression) using SPSS and religious belief of different age group people in their respective religion(Two way ANOVA) using R.
Chatty Kathy - UNC Bootcamp Final Project Presentation - Final Version - 5.23...John Andrews
SlideShare Description for "Chatty Kathy - UNC Bootcamp Final Project Presentation"
Title: Chatty Kathy: Enhancing Physical Activity Among Older Adults
Description:
Discover how Chatty Kathy, an innovative project developed at the UNC Bootcamp, aims to tackle the challenge of low physical activity among older adults. Our AI-driven solution uses peer interaction to boost and sustain exercise levels, significantly improving health outcomes. This presentation covers our problem statement, the rationale behind Chatty Kathy, synthetic data and persona creation, model performance metrics, a visual demonstration of the project, and potential future developments. Join us for an insightful Q&A session to explore the potential of this groundbreaking project.
Project Team: Jay Requarth, Jana Avery, John Andrews, Dr. Dick Davis II, Nee Buntoum, Nam Yeongjin & Mat Nicholas
Techniques to optimize the pagerank algorithm usually fall in two categories. One is to try reducing the work per iteration, and the other is to try reducing the number of iterations. These goals are often at odds with one another. Skipping computation on vertices which have already converged has the potential to save iteration time. Skipping in-identical vertices, with the same in-links, helps reduce duplicate computations and thus could help reduce iteration time. Road networks often have chains which can be short-circuited before pagerank computation to improve performance. Final ranks of chain nodes can be easily calculated. This could reduce both the iteration time, and the number of iterations. If a graph has no dangling nodes, pagerank of each strongly connected component can be computed in topological order. This could help reduce the iteration time, no. of iterations, and also enable multi-iteration concurrency in pagerank computation. The combination of all of the above methods is the STICD algorithm. [sticd] For dynamic graphs, unchanged components whose ranks are unaffected can be skipped altogether.
Levelwise PageRank with Loop-Based Dead End Handling Strategy : SHORT REPORT ...Subhajit Sahu
Abstract — Levelwise PageRank is an alternative method of PageRank computation which decomposes the input graph into a directed acyclic block-graph of strongly connected components, and processes them in topological order, one level at a time. This enables calculation for ranks in a distributed fashion without per-iteration communication, unlike the standard method where all vertices are processed in each iteration. It however comes with a precondition of the absence of dead ends in the input graph. Here, the native non-distributed performance of Levelwise PageRank was compared against Monolithic PageRank on a CPU as well as a GPU. To ensure a fair comparison, Monolithic PageRank was also performed on a graph where vertices were split by components. Results indicate that Levelwise PageRank is about as fast as Monolithic PageRank on the CPU, but quite a bit slower on the GPU. Slowdown on the GPU is likely caused by a large submission of small workloads, and expected to be non-issue when the computation is performed on massive graphs.
StarCompliance is a leading firm specializing in the recovery of stolen cryptocurrency. Our comprehensive services are designed to assist individuals and organizations in navigating the complex process of fraud reporting, investigation, and fund recovery. We combine cutting-edge technology with expert legal support to provide a robust solution for victims of crypto theft.
Our Services Include:
Reporting to Tracking Authorities:
We immediately notify all relevant centralized exchanges (CEX), decentralized exchanges (DEX), and wallet providers about the stolen cryptocurrency. This ensures that the stolen assets are flagged as scam transactions, making it impossible for the thief to use them.
Assistance with Filing Police Reports:
We guide you through the process of filing a valid police report. Our support team provides detailed instructions on which police department to contact and helps you complete the necessary paperwork within the critical 72-hour window.
Launching the Refund Process:
Our team of experienced lawyers can initiate lawsuits on your behalf and represent you in various jurisdictions around the world. They work diligently to recover your stolen funds and ensure that justice is served.
At StarCompliance, we understand the urgency and stress involved in dealing with cryptocurrency theft. Our dedicated team works quickly and efficiently to provide you with the support and expertise needed to recover your assets. Trust us to be your partner in navigating the complexities of the crypto world and safeguarding your investments.
Opendatabay - Open Data Marketplace.pptxOpendatabay
Opendatabay.com unlocks the power of data for everyone. Open Data Marketplace fosters a collaborative hub for data enthusiasts to explore, share, and contribute to a vast collection of datasets.
First ever open hub for data enthusiasts to collaborate and innovate. A platform to explore, share, and contribute to a vast collection of datasets. Through robust quality control and innovative technologies like blockchain verification, opendatabay ensures the authenticity and reliability of datasets, empowering users to make data-driven decisions with confidence. Leverage cutting-edge AI technologies to enhance the data exploration, analysis, and discovery experience.
From intelligent search and recommendations to automated data productisation and quotation, Opendatabay AI-driven features streamline the data workflow. Finding the data you need shouldn't be a complex. Opendatabay simplifies the data acquisition process with an intuitive interface and robust search tools. Effortlessly explore, discover, and access the data you need, allowing you to focus on extracting valuable insights. Opendatabay breaks new ground with a dedicated, AI-generated, synthetic datasets.
Leverage these privacy-preserving datasets for training and testing AI models without compromising sensitive information. Opendatabay prioritizes transparency by providing detailed metadata, provenance information, and usage guidelines for each dataset, ensuring users have a comprehensive understanding of the data they're working with. By leveraging a powerful combination of distributed ledger technology and rigorous third-party audits Opendatabay ensures the authenticity and reliability of every dataset. Security is at the core of Opendatabay. Marketplace implements stringent security measures, including encryption, access controls, and regular vulnerability assessments, to safeguard your data and protect your privacy.
1. Forecasting of Solar Electricity Generation
and Performance Evaluation of Forecasting
models using Time Series data
MSc Research Project
Data Analytics
Siddharth Chaudhary
x16137001
School of Computing
National College of Ireland
Supervisor: Dr.Paul Stynes
2. National College of Ireland
Project Submission Sheet – 2017/2018
School of Computing
Student Name: Siddharth Chaudhary
Student ID: x16137001
Programme: Data Analytics
Year: 2016
Module: MSc Research Project
Lecturer: Dr.Paul Stynes
Submission Due
Date:
11/12/2017
Project Title: Forecasting of Solar Electricity Generation and Performance
Evaluation of Forecasting models using Time Series data
Word Count: 7092
I hereby certify that the information contained in this (my submission) is information
pertaining to research I conducted for this project. All information other than my own
contribution will be fully referenced and listed in the relevant bibliography section at the
rear of the project.
ALL internet material must be referenced in the bibliography section. Students
are encouraged to use the Harvard Referencing Standard supplied by the Library. To
use other author’s written or electronic work is illegal (plagiarism) and may result in
disciplinary action. Students may be required to undergo a viva (oral examination) if
there is suspicion about the validity of their submitted work.
Signature:
Date: 22nd January 2018
PLEASE READ THE FOLLOWING INSTRUCTIONS:
1. Please attach a completed copy of this sheet to each project (including multiple copies).
2. You must ensure that you retain a HARD COPY of ALL projects, both for
your own reference and in case a project is lost or mislaid. It is not sufficient to keep
a copy on computer. Please do not bind projects or place in covers unless specifically
requested.
3. Assignments that are submitted to the Programme Coordinator office must be placed
into the assignment box located outside the office.
Office Use Only
Signature:
Date:
Penalty Applied (if
applicable):
3. Forecasting of Solar Electricity Generation and
Performance Evaluation of Forecasting models using
Time Series data
Siddharth Chaudhary
x16137001
MSc Research Project in Data Analytics
22nd January 2018
Abstract
The present study applies four time series models named TBATS, ARIMA,
Simple Exponential Smoothing and Holt method to forecast the solar power gen-
eration in two Indian cities, Delhi and Jodhpur. Since solar power generation is
dependent on solar radiation hence the later one is forecasted with the help of time
series models and former one with the help of forecasted solar radiation value. The
ARIMA method outperforms the TBATS, Holt method and Simple exponential by
11 percent, 31 percent and 32 percent respectively. Finally the forecasted values of
ARIMA were used to calculate the total electricity production can be made in two
sites, Delhi and Jodhpur. The difference in production came out to be 7700 kWH,
3600 KWH, 1110 KWH and 6500 KWH for November, December, January and
February months with Jodhpur being on higher side for all four months.
1 Introduction
World is looking to use renewable sources of energy like wind and solar. One cannot deny
the fact that efficiency of these sources rely on weather which varies according to time and
location. With solar power system, (Vignola et al.; 2012) the time window has shrunk to
day time when solar radiations are available and with what angle they are transmitted
to the location will also create difference in power generation. So one of the important
factor , which will impact the system performance, is location. A location with 50 more
days of (Wilcox; 2007) sunlight will create a major impact in the performance of solar
power system. This difference has been clearly shown by comparing power generation
capacity of a similar solar system in two cities, Delhi and Jodhpur, with different climate.
The first step of solar power forecasting is to forecast solar irradiance and other related
weather aspects (Mathiesen and Kleissl; 2011). In this study not only solar radiation has
been used for forecasting. Apart from location, this study compares the different time
series models like Auto-regressive Integrated Moving averages(ARIMA), HOLT, TBATS
and Simple Exponential for forecasting solar radiation data. ARIMA have been chosen
because it is among the best models which are used for solar radiation forecast (Voyant
et al.; 2017). While this is the first research on using TBATS model for forecasting of
solar radiation which discussed in literature review.
1
4. Section 2 is presenting the literature review of subject. Section 3 is explaining the
methodology of the study. Section 4 focuses on design and implementation. Section 5
explains the Evaluation and section 6 comparison of result generated from various models
and comparison of forecasted electricity generation.
This study has been done to answer various questions like which model is best to for
time series modelling of solar radiation data, which location is suitable for implementing
solar power generation.
Research Objective 1:To Forecast the solar electricity generation of Jodhpur and Delhi.
Research Objective 2:To evaluate the performance of forecasting models.
Research Objective 3:Comparison between both the cities which one can produce more
solar electricity on same amount of investment over setting up solar power plant.
2 Related Work
This section presents the work done by various researchers regarding solar power fore-
casting using different models.
Johansson and Burnham (1993) conducted a research on electricity and renewable
fuels for the growing world energy demand. As per Author, Energy demand have never
been decreased even though many strenuous efforts were made in using energy in efficient
ways. Efforts has been made to use renewable sources of energy.Johansson investigated
that by 2050 renewable sources of energy would account three-fifths of the worlds total
electricity generation. Their findings have also made it necessary to forecast solar elec-
tricity generation which is the base of this research. Herzog et al. (2001) in his report on
Renewable energy sources states that there is proliferation in power generation using re-
newable sources, generation of electricity using solar photovoltaic energy is experiencing
rapid growth while declining the cost of electricity generation. The above two finding
gives the intuition that future will be of Renewable energy sources which again gives
the concrete base to this research of predicting solar electricity generation. As (richter;
2009) European Solar Thermal Electricity Association (ESTLA) report states that con-
centrated Solar Power could meet one quarter of worlds total energy demand by 2050.
Research on forecasting of solar irradiance became an essential field due to its demand as
per REN21 1
solar photovoltaic capacity production was lifted to 227 gigawatt(GW) in
2015 which was 177 GW in 2014. It is almost 10 times the worlds solar photovoltaic(PV)
generation of a decade earlier. Building on the above two finding gives the concrete base
to this research of predicting solar energy production for the future. Forecasting of solar
electricity is highly dependent on solar radiation, solar radiation needs to be forecasted
first and it can be done using historical time series data.
Time series is explained by (Granger; 1981) on his investigation on properties of time
series data. Author states that, Data which is auto correlated over time is categorized as
time series data. Most of time series study is to extract statistical important information
from the time-dependent data of single series (univariate time series) and from time
dependent data of multiple series (multivariate time series data). Solar radiation (weather
data) comes under the category of univariate time series data. Here one observation
depends on previous observations and the order matters. A time series data is consisting
of various components as trend, seasonality, cyclic component and Noise. Trend is defined
1
www.ren21.net/wp-content/uploads/2016/06/GSR2016F ullReport.pdf
5. as the long term movement in a time series without calendar related and irregular effects,
and it is a reflection of the underlying level. All the components associated with time
are known as seasonal component. So, in time series data seasonality refers to periodic
fluctuations that occur regularly in particular time-frame. Seasonality is always of a
fixed and known period. A cyclic pattern exists when data exhibit rises and falls that are
not of fixed period. In discrete time, white noise is a discrete signal whose samples are
regarded as a sequence of serially uncorrelated random variables with zero mean and finite
variance. The analysis of above findings is also supported by (Mahalakshmi et al.; 2016).
Mahalakshmi investigation on forecasting of different types of time series data. Author in
his study also analyzed the use of time series and have explained the time series component
and forecasting models like Auto-regressive Integrated Moving Averages(ARIMA), Simple
Exponential Smoothing (SES).Time series analysis is an essential area in forecasting
that focuses on forecasting of time series data to study the data and extract meaningful
information and statistics from it. From the above research findings,univariate time
series data has been considered for this research. Ren et al. (2015). Conducted a research
on using ensemble methods for solar and wind power forecasting using time series data.
Author mentioned the fact that solar irradiance forecasting categorization is based on two
approaches physical and statistical methods. Former takes meteorological data as input
and models used to analyse the historical data using Artificial Neural Networks(ANN),
ARIMA. Building on the above research findings, forecasting models like ARIMA and
historical data have been used.The above three finding helps in forecasting the data which
is eventually the main motivation of this research
Four forecasting models have been used to analysis univariate solar radiation time
series data for this Research and they are as follow: Simple Exponential Smoothing
(SES), Holts method, TBATS and ARIMA.
TBATS model have not been used earlier for forecasting of solar radiation as best
of my knowledge. This is the first research using this model. As no literature paper
have been found on solar radiation forecasting. However, it has been used in forecasting
Gold price as per (Hassani et al.; 2015) and outperform the Bayesian auto-regression
and Bayesian vector auto-regressive models. TBATS model was also used in forecasting
household electricity demand as per (Veit et al.; 2014).
According to De Livera et al. (2011) and Rob.J.Hyndman2
,TBATS model is evaluated
as T stands for Trignometric term, B for Box-Cox, A for ARMA errors, T for Trend and S
for seasonality. It is the model that combines other models component like Trigonometric
term for seasonality this is similar to fourier term in harmonic regression. Fourier terms
are used to handle periodic seasonality, Box-Cox transformation for heterogeneity, It
has ARMA error like dynamic regression, level and trend term similar to automated
exponential smoothing.
TBATS {W,{P,Q} φ, {M, K}}
Where,
W= Box-Cox transformation for heterogeneity
P,Q= ARMA errors
φ = levelandtrend(dampingparameter)
M,K= seasonality period and Fourier term
Some of the key advantages of the TBATS modeling
1.Handles long seasonality. As the solar radiation data dataset used in this research
has long seasonality
2
https://www.otexts.org/fpp
6. 2.It is fully automated
In this data, seasonality and non-linear features are present this is the reason to use
this model
Unlike Naive method, that uses the recent observations to forecast the future periods
and as Mean method that uses average of all the observation to predict future values
Simple Exponential Smoothing(SES) is the model which forecasts the value based on
all the observation but recent observation are heavily weighted than earlier observations
i.e forecasting depends more on last observations than earlier observations. This model
assumes that the fluctuation is around the mean of heavily weight value it gives the point
forecast values as the average of all the predicted values. Point forecast values are all
the forecast values which lies within the 95 percent confidence interval of models.SES is
the method that deals with data having no trend and no seasonality. While the Holt
Method is extended SES model just added an another feature as trend. holt method
deals better with Time series data which has trend factor in it as per (Kalekar; 2004) and
Rob.J.Hyndman3
studies on time series forecasting Using exponential smoothing.
According Box et al. (2015) ARIMA is one of the most famous and efficient algorithm
for modeling additive time series data. Although it also has a prerequisite that time
series should be linear and stationary. ARIMA implements three algorithms, differencing
to make data stationary, and moving average and auto regression for overall forecasting.
ARIMA is suitable for univariate forecasting. ARIMA(p,d,q) p is the last number of
observations that are used as predictor in regression equation of the model, d is the value
that states number of times the data needed to be differencing to make it stationary,
q is the value of past lagged error used in regression equation. (Box and Cox; 1964)
and (Sakia; 1992)in their research on box-cox transformation states that the non-linear
data can often significantly be transformed to fit in the model. It is the transformation for
variance stabilization. The Box-Cox transformation provides a convenient way to make
the data normally distributed and to find a suitable transformation. In this research box
cox transformation have been used.
(Das et al.; 2018)conducted a research on forecasting models optimization and fore-
casting of photovoltaic power generation using time series data. Das states researchers
classifies that the photovoltaic power forecasting depends upon time horizon, solar irradi-
ance and other meteorological data and forecasting models furthermore describing three
categories of time horizon short-term forecasting, medium-term forecasting, long-term
forecasting. As per author, Long-term forecasting is worthy of planning of electricity
generation and forecasting models strength and limitations have been discussed and find-
ing shows that Root mean standard error(RMSE) was used more frequently to evaluate
performance of forecasting models.Furthermore (Lonij et al.; 2013) found that forecasting
accuracy changes with the change of forecast horizon with identical parameters in the
same model. Building on the above findings Long-term forecasting have been used in
this research for solar electricity generation and RMSE, MAPE have been used for find-
ing accuracy of models. (Jiang and Dong; 2017)conducted a case study on Tibet area in
china using Kernel Support Vector Machine(KSVM) with Regularized Estimation under
Structural Hierarchy(GRESH) hybrid model which is optimization based, for forecasting
of hourly global horizontal irradiance jiang used one year of data from four different sites.
First 23 days of each month have been used as training set and last seven days as test
set. Author investigated that on criteria of Mean Absolute Percentage Error(MAPE)
and RMSE performance of KSVM-GRESH is better than KSVM models. However, lim-
3
https://www.otexts.org/fpp
7. itation of this case study is that no cross-validation have been done. As well as test
data should have been chosen randomly rather than the last seven days of each month.
Concluding from the above two research, it shows that models are usually compared on
basis of RMSE, MAPE. Therefore, for comparison of the model RMSE, MAPE and Mean
Absolute Error(MAE) have been used in this research.
This next four research findings supports to use ARIMA and TBATS in forecasting
(Paoli et al.; 2010) conducted a research using an optimized MLP, a most used form
of ANN in renewable energy domain and in time series forecasting. For this research,
global daily radiation data have been taken from meteorological station of Ajaccio to
forecast for the next day. Poali identified that the MLP model outperforms the ARMA
model. Paoli also identified that ARIMA, Bayesian inferences, Markov chain and K-
nearest Neighbor are most popular forecasting models on reviewing previous related work
of forecasting of time series he further finds that optimized MLPs prediction is similar
to ARIMA. (Voyant et al.; 2011) conducted a research in forecasting of daily global
radiation using optimized ANN(MLP) induced with multivariate. voyant took Nine years
of data(January 1988 t0 December2007) from Corsica meteorological department which
contain global solar irradiance as endogenous and temperature, wind speed, pressure,
sunshine duration as exogenous input. Endogenous Input is taken on principles of ARIMA
methodology. On studying the result, use of exogenous input improves the forecasting
quality only about 0.5 percent.The drawback of three next studies is that non-stationary
time series have been used and converted to stationary time series before being used in
ARMA model. Instead of ARMA implementation, ARIMA would have been used as
it is advanced version of ARMA developed for non-stationary data as per (Wan et al.;
2015). Another approach for forecasting of solar radiation was proposed by (Ji and Chee;
2011) by using an ARMA/Time Delay Neural Networks for hourly solar prediction the
time series data used for this research is non-stationary before implementing ARMA
this data have been made stationary using detrend models Chee investigate that hybrid
model of ARMA/TDNN presents better result than standalone ARMA. (Sun et al.; 2015)
have done in-depth investigation of six different ARMA-GARCH models, applied on 2
datasets(1983-2012) of monthly mean total daily solar radiation from two different climate
station of china. The Autoregressive and moving averages are determined using Akaike
information Criterion. Authors finding shows that ARMA (3,3)-GARCH-M outperforms
the other model. Sun concluded that ARMA-GARCH model are better than ARMA
Box-Jenkins method as the former one maintains the variability of solar radiation. The
drawback of the above two studies is that non-stationary time series have been used and
converted to stationary time series before being used in ARMA model. Instead of ARMA
implementation, ARIMA, TBATS, SES would have been used as it is advanced version
of ARMA developed for non-stationary data.
Reikard (2009) conducted a comparison of time series forecasting models to predict
global horizontal radiation using six time series data sets which runs from January 1, 1987
to December 31,1990 at resolutions of 5, 15, 30, and 60 min. Data contributes nonlinear
variability, due to variations in cloud cover and weather. Nevertheless, the dominance
daily data makes it straightforward to build predictive models. Forecasting models like
regression in logs, Autoregressive Integrated Moving Average (ARIMA), and Unobserved
Components models(UCM) are compared. Reikard concluded UCM performed better
than Regression model but it is outperformed by ARIMA. Building upon his finding it
support to use ARIMA. In the field of forecasting solar radiation (Hussain and Al Alili;
2016)carried out a research on day head forecast. Hussian used one month of data 1 to
8. 30 march 2016 of Abu Dhabi and forecasted the global solar irradiance of day ahead and
on basis of ACF plot ARIMA model have been used. Further he used ARIMA(2,1,3),
ARIMA(2,1,2),ARIMA(2,1,4).Hussian investigated that ARIMA(2,1,4) model performed
best. The drawback of the above research is we need to find the perfert model manually
this is time consuming as building on Rob.J.Hyndman4
findings appropriate ARIMA
model can be automatically implemented using auto.arima() function and that has been
used in this research.
Wan et al. (2015) conducted a research on forecasting methodology and application of
solar energy forecasting in smart Grids energy management. In his finding of forecasting
methodology, Wan proposed upgraded variations of ARMA like ARIMA and ARMAX
which have been proved better than itself. Because ARMA assumes a linear relationship
between series which is always not the case. WAN concluded that ARMAX has a cap-
ability to include the external factors like temperature, wind and humidity that could
increase the forecasting accuracy. On his finding it suggest to be the future work of this
research.
Kumar and Sudhakar (2015) carried out the research on performance evaluation
of solar PV power plant commissioned at Ramagundam a place located In India.in his
research he carried out the process flow how the solar radiation is converted in electricity
using photovoltaic cell, evaluated performance of various component like inverter, solar
panel and also presented the methodology for calculation of solar electricity generation
which is highly valuable for this research.
3 Methodology
This research uses the ‘Cross Industry Standard Process for Data Mining’ (CRISP-DM)
methodology. CRISP-DM is hierarchical process which comprises of six level breakdowns
as per (Chapman et al.; 2000) which is followed by this research. The Crisp-DM is
modified according to this researchs need as shown in figure.1 the arrow direction between
two figure indicates the modified form. First is Data extraction, data cleaning and data
aggregating. Second Time series data Modelling, Third is Implementation of forecasting
models. Fourth is the forecasting model evaluation have been done. Furthermore, Fifth
is the predicted value of forecasting models which have been used to achieve the research
objective that is the sixth phase
Data from Central Pollution Control Board(CPCB)5
Ministry of environment and
forests (Govt. of India) is collected for this research. CPCB is an organization com-
prises of many meteorological stations which stores and maintain historical weather and
pollution data. Two datasets (January 1, 2016 to October 31, 2017) of daily measured
solar radiation from two cities Delhi (latitude 28.6502 N, longitude 77.3027 E) and Jodh-
pur (latitude 26.2389 N, longitude 73.0243 E) of Indias CPCB meteorological station
equipped with pyranometers which measures the solar radiation have been taken. The
dataset contains two attributes date and daily measured solar radiation.
Qualitative checks have been done for any absurd or corrupt value. All this validation
and cleaning of this research was done in Excel and R (programming language) (Shumway
and Stoffer; 2006). On examining the data set it was determined that data uphold lot
of missing values. The dataset has been investigated thoroughly and the missing values
4
https://www.otexts.org/fpp
5
http://www.cpcb.gov.in/CAAQM/frmUserAvgReportCriteria.aspx
9. Figure 1: Modified Crisp-DM
have been filled on analyzing the previous data values using excel and outliers have been
removed using R as dicussed by (Brockwell and Davis; 2016). The time series data is
prepared using time series R package (zoo, tseries) as per (Shumway and Stoffer; 2006)
book. This time series data is univariate as it contains single attribute that be used in
forecasting . After cleaning up the data, it will be ready to parse into the forecasting
models which forecast the univariate data.
The time series data of both the cities have been decomposed and seen in form of plots
to examine the trend, seasonality and noise. Data have been analysed for linearity and
non-stationary using Box test, qqnorm plot, qqline plot and Auto-Correlation function
(ACF) (Theiler et al.; 1992).
After analysing the data, Different forecasting have been built in R Studio (Integrated
Development Environment) (Racine; 2012) using Rs Forecast package. Different forecast-
ing models like Simple Exponential Smoothing(SES), HOLTs, TBATS and ARIMA model
have been applied. As per (Brockwell and Davis; 2016)the forecast package of R consist
of all the forecasting models used for this research which is capable of processing the
solar radiation time series data. To call a forecast model form the package their specific
function names is needed to pass as discussed next. For simple exponential smoothing
function ses() has been used, for Holts model function holt() has been used, for TBATS
model function tbats() has been used and for ARIMA model function auto.arima() has
been used. ARIMA model have lot of variation as discussed in literature review. The
auto.arima() choose the best fit model itself for the data. After implementing the fore-
casting models, accuracy of the models have been calculated using error parameters like
Root Mean Standard Error(RMSE), Mean Absolute Errors(MAE), Mean Absolute Per-
centage Error(MAPE). On basis of these error parameters, models having the least error
in predicting the next 120 observations is regarded as the best model. The predicted solar
radiation value of the best model is used for calculation of solar electricity generation.
The forecasted Solar radiation of four months (November 1,2017 to February 28,2018)
of both the cities have bern extracted from the best performing forecasting models. As
the daily measured datas unit is in w/m2 therefore, the forecast datas unit is also in
w/m2.For solar electricity calculation the data needs to be in kwh/m2 as per global
formula to calculate the photovoltaic system generated electricity as per (ˇS´uri et al.;
2007) and. To convert the w/m2 unit of data into kwh/m2 (ˇS´uri et al.; 2007) gave the
10. formulae that kwh/m2 = w/m2*24/1000678
. To calculate the electricity generation of
a month daily data have been summed up and is used in Standard formulae for solar
electricity generation by (ˇS´uri et al.; 2007) E=A*R*H*PR9
.
E = Electricity produced (kWh)
A = Solar Panel Area (m2)
r = solar panel efficiency or yield(percent),r is taken as 15.6 as per standard test
condition
H = Solar radiation on panels
PR = Performance ratio, coefficient for losses ( default value = 0.75)
The forecasted electricity for both the cities will be compared using table, visualization
graph and the performance of forecasting models will be evaluated in results section.
4 Implementation
The programming language used for this research is R. The overall architecture of this
study can be explained below in figure 2.
Figure 2: Data Flow of the Research
Data is collected from the Central Pollution Control Board (CPCB) Ministry of en-
vironment and forests(Govt. of India). Data for the city Jodhpur is downloaded from
6
https://answers.yahoo.com/question/index?qid=20091027141143AARtZmS
7
http://www.energylens.com/articles/kw-and-kwh
8
https://www.researchgate.net/post/HowcanIconvertW hm2toW m2
9
http://photovoltaic-software.com/PV-solar-energy-calculation.php
11. Jodhpur Station and for Delhi it is downloaded from the Anand vihar station. Both data-
sets are on daily frequency and the forecasting of solar radiation, evaluation of models and
comparison of solar electricity generation have been done using these datasets. Down-
loaded datasets had lot of missing values which have been filled using Excel. Outliers have
been removed using R. Cleaned datasets are then Loaded in r using read.csv() function.
All the implementation part is done in RStudio(IDE) using R language. For processing
the data sets, packages like zoo,tseries,forecast,ggplot2,fpp2 have been installed using
install.packages() function. Then these packages are loaded in memory using library()
function. The data is then converted into time series format using zoo() function and
ts() function as per the forecasting models need. Non-linearity of data have been checked
using qqnorm() and qqline() ploting. Then the Box.test() function, Auto-Correlation
function(ACF) is applied to check whether the date is a white noise or not. The time
series data used for forecasting models should not be of random distribution or white noise
they should show some correlation with the previous as well as with next variable.The
above two test showed that data is not a white noise.Then the graphical representation
of the time series data have been done using plot() function. The solar radiation time
series data is then decomposed in its seasonal, trend and noise component. The Box-cox
transformation have been done for variance stabilization of the data.
Now it comes to the implementation of the forecasting models ARIMA have been im-
plemented using auto.arima() and passing the box-cox transformation value as 0.21 which
is close to cube root transformation. Coding for backend process of all the models were
already done in the forecast package. The auto.arima() function have been used which
will eventually call the best model for the data from the ”forecast” package consisting of
various version of ARIMA. Forecast() function is then applied to forecast the next 120
days value of solar radiation. Forecasted value is then extracted in excel into the local
memory from Rstudio using write.table() function.
Simple Exponential Smoothing model is applied on the solar radiation time series data
using ses() function. The SES models code is also present in the forecast package which is
called by ses() function. For forecasting and implementation of SES model ses() function
have been used. Therefore, solar radiation of next four months have been forecasted by
Simple Exponential Smoothing model. Then plotting of forecasted value have been done
using autoplot(). Forecasted value is then extracted in excel into the local memory from
Rstudio using write.table() function.
Holts model is applied on the solar radiation time series data using holt() function.
The holt models code is also present in the forecast package which is called by holt()
function. For forecasting and implementation of HOLT model holt() function have been
used. Therefore, solar radiation of next four months have been forecasted holt model.
Then plotting of forecasted value have been done using autoplot(). Forecasted value is
then extracted in excel into the local memory from Rstudio using write.table() function.
TBATS model is applied on the solar radiation time series data using tbats() function.
TBATS models code is also present in the forecast package which is called by tbats()
function. For forecasting and implementation of HOLT model it is needed to pass tbats()
function. Therefore, Therefore, solar radiation of next four months have been forecasted
using TBATS model. Then plotting of forecasted value have been done using autoplot().
Forecasted value is then extracted in excel into the local memory from Rstudio using
write.table() function. All the data which is extracted from the models are the predicted
data of the models
RMSE, MAPE, MAE have been used to compare each model using the 20 percent of
12. test and 80 percent training data to check the performance of the model which is discussed
in evaluation and result section. Focus will be on TBATS model how it perform on solar
radiation time series data.
The extracted data of best performing model has been used to calculate the solar
electricity generation.As the daily measured datas unit is in w/m2 therefore, the fore-
casted datas unit is also in w/m2.Each forecasted value is then converted to kwh using
kwh/m2 = w/m2*24/1000 formulae. Electricity generation of a month is calculated using
Standard formulae for solar electricity generation by E=A*R*H*PR.
For this research, Area for solar panel is assumed as of 1000 m2 for both the cities, r is
taken as 15.6 as per standard test condition. As per (Dubey et al.; 2013) air temperature
also affect the solar electricity generation but the average temperature of both the cities
of each month are quite similar just having the max difference of 0.7 c. the temperature
is below 25 for four months of both the cities 1011
. So that does not affect the electricity
generation calculation of the cities. The generated electricity for both the cities have been
compared using table and visualization graph.Comparison of forcasted solar electricity
generation and the performance of forecasting models is evaluated in results section. As
mentioned earlier focus will also be on TBATS model performance as this is the first
research on solar radiation forecasting using this model as best of my knowledge.
5 Evaluation
A comparative time series plot of data for two cities is displayed in figure 3. We can
see a seasonality of 12 months in both the series. There is not much trend. There is a
fluctuation in Delhi data during the month of July. As July, August is monsoon season,
so there is less solar radiation during monsoon season.
Figure 3: Comparative time series plotting of two cities
To check linearity dataset is examined using qqnorm() and qqline plot.by the plot
below figure 4 it shows the data is somehow non-linear. To make variance stabilization
box-cox transformation have been done for ARIMA while TBATS have in-built Box-Cox
Transformation method.
Further, To determine the trend and seasonality of the two solar radiation time series
data, acf and pacf of both the cities have been plotted as follows. Fig 5 is showing the auto
correlation and partial auto correlation of solar irradiance data of Delhi and Jodhpur.
10
https://www.yr.no/place/India/rajasthan/jodhpur/statistics.html
11
https://www.yr.no/place/India/Delhi/NewDelhi/statistics.html
13. Figure 4: Checking Linearity
As it is quite clear from acf that Delhi and Jodhpur both have a seasonality of 365 days.
PACF explains the relationship of current observation with past observation.
After verifying the data using Box test, it have been analyzed that the solar radiation
time series data used in this research is not a white noise as p-value is below 0.05 which
shows that the data can be be used for forecasting and Auto-Correlation function(ACF)
plot of Solar radiation data shows that the data is non-stationary as ACF of stationary
time series will drop to zero relatively quickly while ACF of the solar radiation data
decreasing slowly as mentioned by Rob.J.Hyndman12
,hence it is non-stationary data.
Figure 5: ACF and PACF for Delhi and Jodhpur
Time series decomposition figure 6 and 7 is explained below. This graph clearly
evaluate the different components of solar radiation data of Delhi and Jodhpur. The
overall variation of data is same in two cities. But Delhi is more fluctuating in comparison
to jodhpur. In the seasonal component, both are displaying seasonality of 365 days in the
overall duration of two years. There is not much trend as each city has observed almost
same amount of sunlight in the duration of 2 years. But some trend might have been
visible if this study was done for 5 years or more. Third is Noise data which have been
used for analysing the underlying effect. After taking out the seasonality and trend, left
over series is stationary hence can be used for forecasting.
Different methods like TBATS, ARIMA, Simple Exponential Smoothing, Holt model
are applied in this research for forecasting the solar radiation data. The evaluation of
12
https://www.otexts.org/fpp
14. Figure 6: Component of Delhi data
Figure 7: Component of Jodhpur data
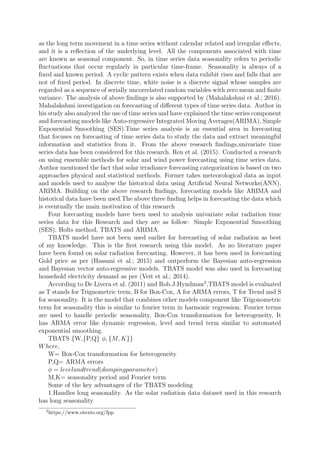
each forecasting model is based on figures given below and is explained thoroughly in
Result section. The blue line in each figure is the forecasted value of each model and the
dark blue area is the models 80 percent confidence that all the value will come within
the dark blue patch while the model is 95 percent confidence that all the value will come
within the light blue patch.
Figure 8 below is forecasting result of TBATS model. TBATS graph shows that
forecasted values are following the seasonal variation but very smooth. So this method
is been checked is it suitable for this data. TBATS (1,1,3,-,,365,1) is being evaluated as
the first variable is 1 that tells us substantial box cox transformation have been made.
The next two variable is similar to p,q of ARMA. The 1,3 values here states that 1 last
observation is used as predictor in regression equation and last 3 past lagged error are
used in regression equation. Next - value signifies on damping parameter have been used
as data doesnt have any trend, next variable 365,1 states that seasonality is found at 365
values and is handled by one fourier term.
ARIMA models plot Figure 9 below shows the closest pattern of forecasted value to
actual value. ARIMA(3,1,2)(0,1,0)[365] is evaluated as the models first variable(3,1,2)
states that 3 last observation is used as predictor in regression equation. 1 time differen-
cing have been done for making data stationary and 2 last lagged error have been used in
regression equation.(0,1,0) states that 1 seasonal differencing have been done and [365]
states that it is on daily frequency.
Simple exponential Smoothing model figure 10 is evaluated here the straight line seen
is the point forecast as simple exponential smoothing gives the mean of all the predicted
value. Therefore, it is evaluated that this model wont provide the value for each day.
Therefore, it wont to help predicting the research objective of calculating how much
15. Figure 8: TBATS forecasting plot
Figure 9: ARIMA forecasting plot
electricity can be produced as for predicting electricity generation this model is not an
effective one.
Figure 10: Simple Exponential Smoothing forecasting plot
The is the forecasting evaluation of HOLTs method in figure 11. Holt method is
performing double exponential smoothing which is good with trend. Since this data does
not show much trend variation hence forecasting result is a straight line or in other words
HOLT is also not suitable for this dataset. Therefore, the SES and Holt model is not
good for forecasting solar electricity generation as it needs the actual forecasted data not
the Point forecast.
Below table in Result section presents the numeric comparison of four models. Here
we have presented the RMSE, MAE and MAPE for all four models. Root mean square
error or root mean square deviation (RMSE) is used to measure the difference between
actual value and predicted value. Mean Absolute error (MAE) measures the average
16. Figure 11: Holt Trend method forecasting plot
of all errors of prediction. So, it is the mean of absolute difference of actual value and
predicted value. Mean absolute percentage error (MAPE) measures the accuracy of a
method for constructing fitted time series values in statistics.
The predicted value of the best fit model on basis of the above error parameter will
be used for forecasting solar electricity generation. Next is the result section.
6 Results
The aim of the project of forecasting solar radiation,forecasting of solar electricity gen-
eration and performance of models have been achieved. Models have been evaluated
using error parameters RMSE,MAE,MAPE,MASE.On the basis of the error parameter
ARIMA outperformed all the other model and TBATS performed better than SES and
Holt model.As ARIMA outperformed all the models its predicted value will be used for
forecasting solar electricity generation of Jodhpur and Delhi for the next four month.
Figure 12: Performance of forecasting models
It is clear from the table that mean error is maximum for holt method as it simply
averaging the entire series. It can be analyzed from RMSE, MAE and MAPE values that
they are least for ARIMA as it ignores the sign while calculating the error, hence a better
parameter to rely and compare. MASE compares the result to one obtained from naive
method and if value is greator than 1 then performance is very poor. MASE is least for
ARIMA, hence it is the best algorithm for modelling this data.
Electricity comparison of both cities
This is the final outcome of the research project where electricity generation has been
calculated and compared. First of all the forecasted solar radiation for next four months
17. has been forecasted using the forecasting models for two cities. The forecasted solar
radiation is used to forecast the solar electricity generation with the help of solar power
generation formula total electricity of each month has been calculated. The figure.13 and
graph figure.14 below shows that jodhpur solar electricity production is higher than that
of Delhi.The table shows that jodhpurs electricity generation on 1000m2 of solar panel is
significantly high.This research shows that on investing same amount of money on solar
panels in both cities we can produce more elctricity in Jodhpur than Delhi.Therefore in
perspective of solar electricity generation Jodhpur is a better place to set-up solar power
plant than Delhi.
Figure 13: Comparing Jodhpur’s and Delhi’s forecasted solar electricity generation
Figure 14: Graphical representation of Jodhpur’s and Delhi’s forecasted solar electricity
generation
7 Conclusion and Future Work
The research objective of forecasting solar electricity generation of both the cities,comparison
between them and performance evaluation of forecasting models have been achieved. The
research states that the solar electricity generation of jodhpur is higher than that of Delhi
for four months from November 2017 to February 2018. Forecasting of solar electricity
significantly depend upon forecasting of solar radiation which is done by the forecast-
ing models. Talking about model performance Arima model outperforms all the other
three model. This is the first research on solar radiation forecasting using TBATS model.
TBATS doesnt perform well in predicting the solar radiation value. Therefore, it is con-
cluded that TBATS model is not a good option for forecasting solar radiation. Simple
Exponential Smoothing and Holt model gives the point forecast which again is not a good
option for forecasting the solar radiation.
There is lot of scope in this study for future work. First of all this work can be
improved by including weather factors to improve the solar power forecasting. As tem-
perature, humidity and wind are also responsible for the variation in power generation.
18. This can be done with the help of ARIMAX, ARIMA-ANN or more complex models.
Another important factor is to include more cities so that it can be determined that
which locations will be more profitable in implanting a solar power generation system.
Data of 10 years or more should be needed to forecast for a complete year with more
accuracy There are lots of rural areas in India which are not connected to grid. So these
cities/rural areas should be included in order to fulfill the requirement demand and fill
the current demand supply gap.
References
Box, G. E. and Cox, D. R. (1964). An analysis of transformations, Journal of the Royal
Statistical Society. Series B (Methodological) pp. 211–252.
Box, G. E., Jenkins, G. M., Reinsel, G. C. and Ljung, G. M. (2015). Time series analysis:
forecasting and control, John Wiley & Sons.
Brockwell, P. J. and Davis, R. A. (2016). Introduction to time series and forecasting,
springer.
Chapman, P., Clinton, J., Kerber, R., Khabaza, T., Reinartz, T., Shearer, C. and Wirth,
R. (2000). Crisp-dm 1.0 step-by-step data mining guide.
Das, U. K., Tey, K. S., Seyedmahmoudian, M., Mekhilef, S., Idris, M. Y. I., Van Deventer,
W., Horan, B. and Stojcevski, A. (2018). Forecasting of photovoltaic power generation
and model optimization: A review, Renewable and Sustainable Energy Reviews 81: 912–
928.
De Livera, A. M., Hyndman, R. J. and Snyder, R. D. (2011). Forecasting time series
with complex seasonal patterns using exponential smoothing, Journal of the American
Statistical Association 106(496): 1513–1527.
Dubey, S., Sarvaiya, J. N. and Seshadri, B. (2013). Temperature dependent photovoltaic
(pv) efficiency and its effect on pv production in the world–a review, Energy Procedia
33: 311–321.
Granger, C. W. (1981). Some properties of time series data and their use in econometric
model specification, Journal of econometrics 16(1): 121–130.
Hassani, H., Silva, E. S., Gupta, R. and Segnon, M. K. (2015). Forecasting the price of
gold, Applied Economics 47(39): 4141–4152.
Herzog, A. V., Lipman, T. E. and Kammen, D. M. (2001). Renewable energy sources,
Encyclopedia of Life Support Systems (EOLSS). Forerunner Volume-Perspectives and
Overview of Life Support Systems and Sustainable Development .
Hussain, S. and Al Alili, A. (2016). Day ahead hourly forecast of solar irradiance for abu
dhabi, uae, Smart Energy Grid Engineering (SEGE), 2016 IEEE, IEEE, pp. 68–71.
Ji, W. and Chee, K. C. (2011). Prediction of hourly solar radiation using a novel hybrid
model of arma and tdnn, Solar Energy 85(5): 808–817.
19. Jiang, H. and Dong, Y. (2017). Forecast of hourly global horizontal irradiance based on
structured kernel support vector machine: A case study of tibet area in china, Energy
Conversion and Management 142: 307–321.
Johansson, T. B. and Burnham, L. (1993). Renewable energy: sources for fuels and
electricity, Island press.
Kalekar, P. S. (2004). Time series forecasting using holt-winters exponential smoothing,
Kanwal Rekhi School of Information Technology 4329008: 1–13.
Kumar, B. S. and Sudhakar, K. (2015). Performance evaluation of 10 mw grid connected
solar photovoltaic power plant in india, Energy Reports 1: 184–192.
Lonij, V. P., Brooks, A. E., Cronin, A. D., Leuthold, M. and Koch, K. (2013). Intra-hour
forecasts of solar power production using measurements from a network of irradiance
sensors, Solar Energy 97: 58–66.
Mahalakshmi, G., Sridevi, S. and Rajaram, S. (2016). A survey on forecasting of time
series data, Computing Technologies and Intelligent Data Engineering (ICCTIDE),
International Conference on, IEEE, pp. 1–8.
Mathiesen, P. and Kleissl, J. (2011). Evaluation of numerical weather prediction for intra-
day solar forecasting in the continental united states, Solar Energy 85(5): 967–977.
Paoli, C., Voyant, C., Muselli, M. and Nivet, M.-L. (2010). Forecasting of preprocessed
daily solar radiation time series using neural networks, Solar Energy 84(12): 2146–2160.
Racine, J. S. (2012). Rstudio: A platform-independent ide for r and sweave, Journal of
Applied Econometrics 27(1): 167–172.
Reikard, G. (2009). Predicting solar radiation at high resolutions: A comparison of time
series forecasts, Solar Energy 83(3): 342–349.
Ren, Y., Suganthan, P. and Srikanth, N. (2015). Ensemble methods for wind and solar
power forecastinga state-of-the-art review, Renewable and Sustainable Energy Reviews
50: 82–91.
richter, W. R. E. (2009). Concentrating solar power global outlook 09.
Sakia, R. (1992). The box-cox transformation technique: a review, The statistician
pp. 169–178.
Shumway, R. H. and Stoffer, D. S. (2006). Time series analysis and its applications: with
R examples, Springer Science & Business Media.
Sun, H., Yan, D., Zhao, N. and Zhou, J. (2015). Empirical investigation on modeling
solar radiation series with arma–garch models, Energy Conversion and Management
92: 385–395.
ˇS´uri, M., Huld, T. A., Dunlop, E. D. and Ossenbrink, H. A. (2007). Potential of solar
electricity generation in the european union member states and candidate countries,
Solar energy 81(10): 1295–1305.
20. Theiler, J., Eubank, S., Longtin, A., Galdrikian, B. and Farmer, J. D. (1992). Testing
for nonlinearity in time series: the method of surrogate data, Physica D: Nonlinear
Phenomena 58(1-4): 77–94.
Veit, A., Goebel, C., Tidke, R., Doblander, C. and Jacobsen, H.-A. (2014). Household
electricity demand forecasting: benchmarking state-of-the-art methods, Proceedings of
the 5th international conference on Future energy systems, ACM, pp. 233–234.
Vignola, F., Michalsky, J. and Stoffel, T. (2012). Solar and infrared radiation measure-
ments, CRC press.
Voyant, C., Muselli, M., Paoli, C. and Nivet, M.-L. (2011). Optimization of an artifi-
cial neural network dedicated to the multivariate forecasting of daily global radiation,
Energy 36(1): 348–359.
Voyant, C., Notton, G., Kalogirou, S., Nivet, M.-L., Paoli, C., Motte, F. and Fouilloy, A.
(2017). Machine learning methods for solar radiation forecasting: A review, Renewable
Energy 105: 569–582.
Wan, C., Zhao, J., Song, Y., Xu, Z., Lin, J. and Hu, Z. (2015). Photovoltaic and solar
power forecasting for smart grid energy management, CSEE Journal of Power and
Energy Systems 1(4): 38–46.
Wilcox, S. (2007). National solar radiation database 1991-2005 update: User’s manual,
Technical report, National Renewable Energy Laboratory (NREL), Golden, CO.