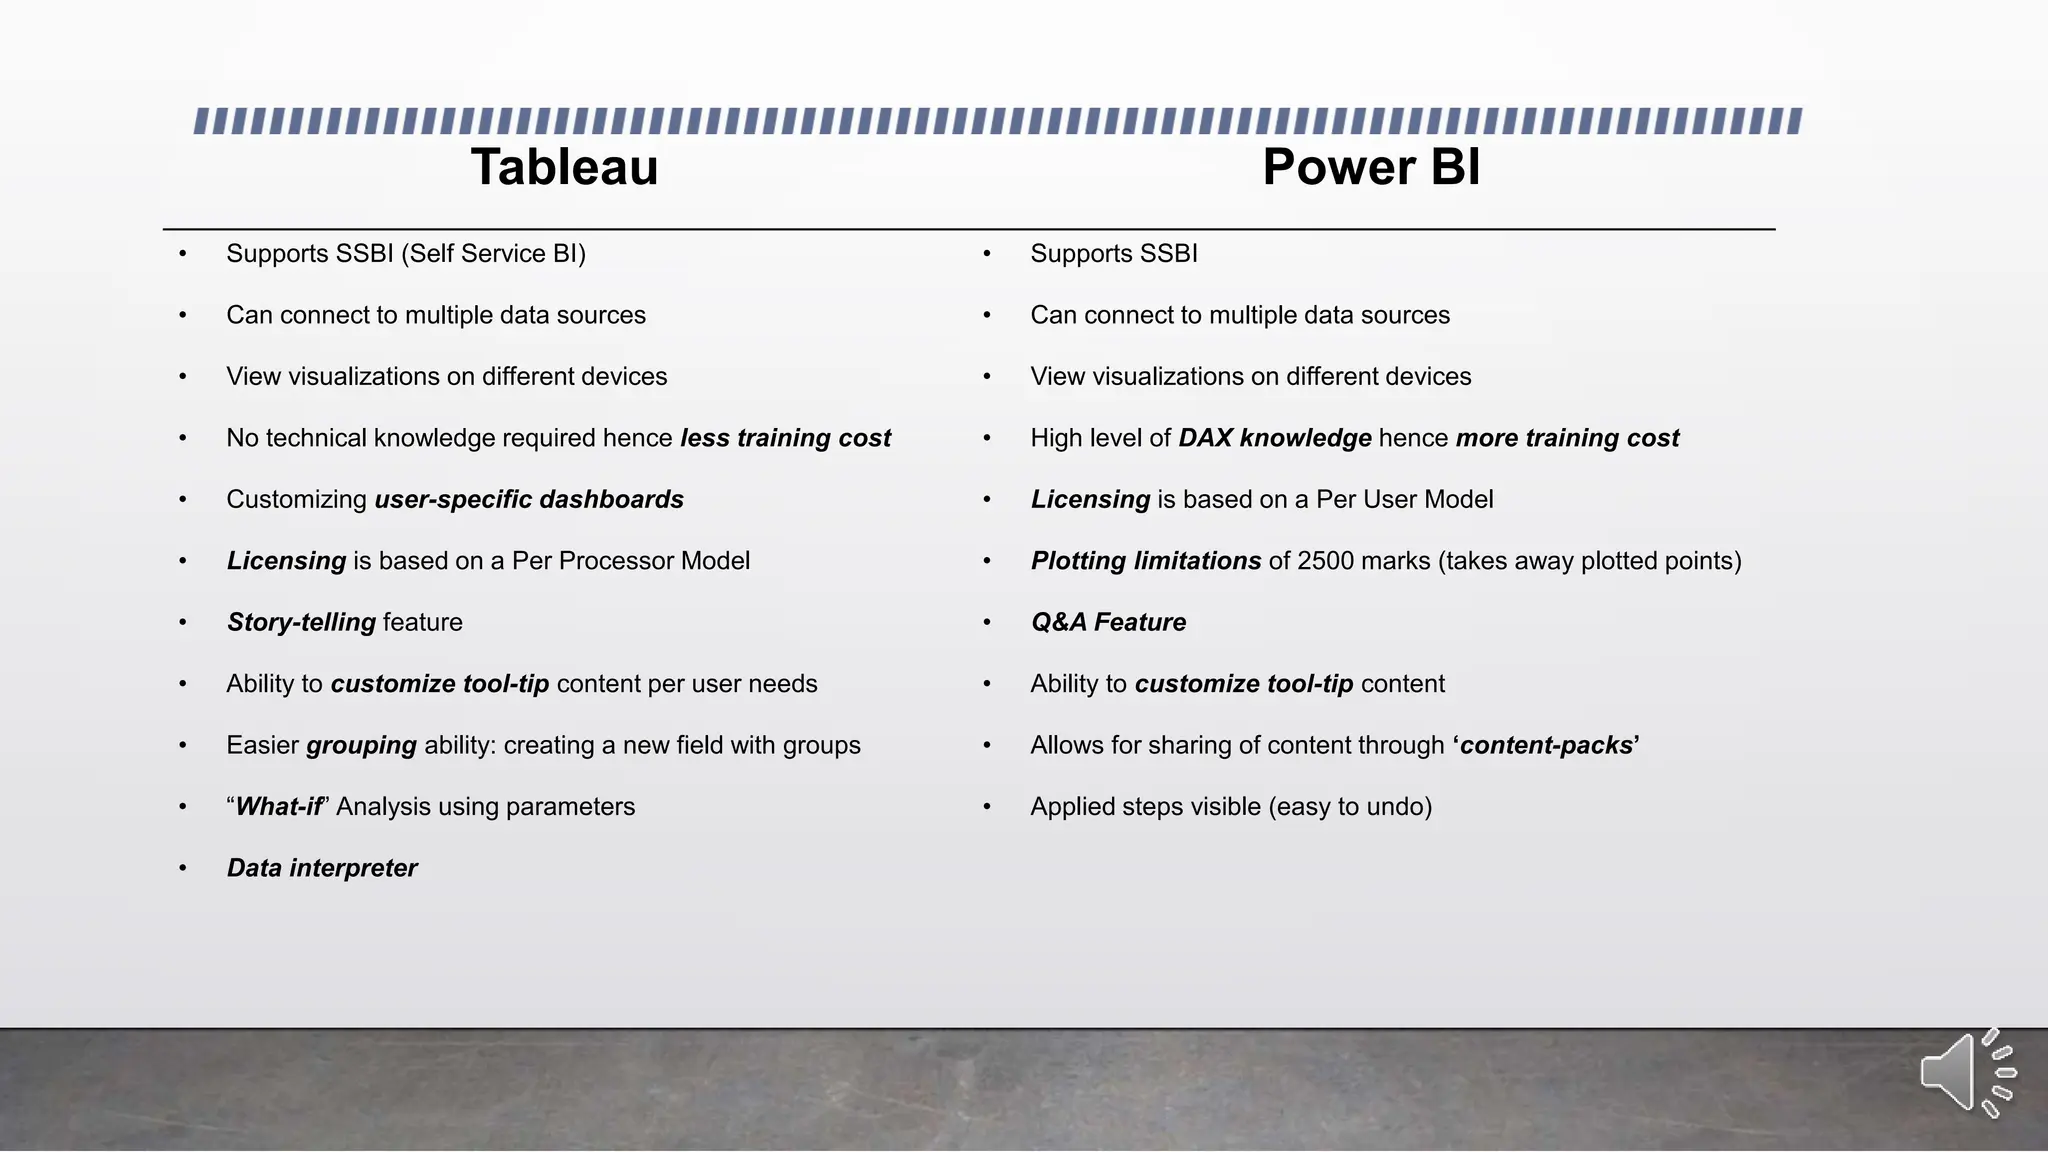
Data Visualization:
Power BI vs. Tableau
Outline
• What is BI?
• Tableau: products, features and pricing
• Power BI: products, features and pricing
• Comparing Power BI and Tableau
• Which one is better for your company?
What is Business Intelligence?
• Raw Data  Useful Information
• Uses a set of tools and skill sets to help business owners make informative
decisions
Data  Information
• Data from multiple sources are organized and loaded onto a common storage (using ETL)
• Reporting tools are then used to build reports based on user needs.
Data visualization Tools
The power of visualization:
• Data visualization tools like Power BI and Tableau help us transform raw data into compelling
visuals, making complex information easier to understand and interpret.
Choosing the right tool:
• With a variety of data visualization tools available, selecting the right one for your organization
can be challenging.
• This presentation will compare Power BI and Tableau, highlighting their key features and helping
you make an informed decision.
Tableau: Leading Data Visualization and Business Intelligence Tool
• Visualization tool designed to support faster solutions
• Build reports in a matter of minutes using drag and drop
• No programming language knowledge needed
• Create customized dashboards to fit the need of the business.
• Create a story using a sequence of worksheets.
Tableau products
• Tableau Desktop
• Tableau Server
• Tableau Online
• Tableau Public
• Tableau Reader
Tableau Desktop
• The tool used to create visualization and analyze the data
• Create workbooks, dashboards and stories
• Two editions:
• Personal Edition:
• limited data sources: can only connect to flat files
• no ability to connect to Tableau Server
• Professional Edition:
• full enterprise capabilities
• Publish visualizations onto Tableau online or Tableau public.
Tableau Server
• An online solution for sharing, distributing and collaborating on content created in tableau.
• Interactive dashboards on web browsers or tablets
• Subscribe to a dashboard and automatically receive updates
• Priced per user or server core
• Requires planning
• Optimal hardware and IT resources
• Security
• Ability to create user filter based on necessary field
• Behind firewall, hence provides the most security
Tableau Online
• Cloud based visualization
• Priced per user per year
• Hosted version of Tableau Server
• Automatically schedule refreshes and add data models
• Visualizations created on Tableau Desktop can be published onto Online within seconds
• No setup, no hardware, no management necessary
Tableau Public
• Allows to view visualization free
• Visualization will be public
• Free tool
Tableau Reader
• Free tool
• Desktop application viewing visualization
• No ability to edit visualization / Read-only
Data Connection
• Two kinds of connection to source data:
• Live Data Connection
• Used for real-time analytics
• Performance is based on database performance
• Extraction
• Data is brought in memory
• Performance is not based on database performance
• Used for interactive analysis
Dashboards
• Each tableau visualization is created on a
worksheet.
• Multiple worksheets can be combined to create
a dashboard
• Dashboards provide an over view of the
business system at a glance.
• Show multiple dimensions of the data
summarized in one page
• Efficient and quick to respond to critical issues
and/or opportunities.
Example

Pricing
• Tableau Desktop Personal Edition: $999 per user
• Tableau Desktop Professional Edition: $1,999 per user
• Tableau Online: $500 per user, per year
• Tableau Public: Free
• Tableau Server: two options:
• enterprise option: no restriction on number of users/ restriction on hardware
• named user: no hardware restriction / restriction on user / pay per user
• Free Trial Available
*****please contact Tableau for more pricing information (check Tableau website) *****
Power BI
• Microsoft product
• Cloud-based business analytics service
• Share reports and dashboards across a wide range of browsers, and devices such as
tablets and mobile phones.
• Integration with familiar Microsoft products: Excel, PowerPivot, etc.
• Easy connection to multiple data sources: Excel spreadsheets, cloud
services, on premise databases, etc.
• Uses DAX formulas to create calculated columns, as well as Quick
Calculations such as % of grand total
• The Power BI team releases 20+ features every month: free to
incorporate.
Features
• Real-time dashboards; helping business
owners solve problems as they occur
• Power BI Embedded: azure service that
enables applications to interact with Power
BI
• Q&A feature: allowing users to ask
questions using natural language to get
answers in graphical form.
• Content Packs: for sharing dashboards
with team
Power BI products
• Power BI Desktop
• Power BI Mobile
• Power BI Publisher for Excel
Power BI Desktop
• Application where all visualizations are created
• Transform and clean data with Query Editor
• 3 views:
• Reports
• Data
• Relationships
Query Editor
• Load data from multiple sources
• Transform data to meet analysis needs
• Create new columns of calculated results
• Remembers all applied steps
Power BI Mobile
• Allows to view dashboards and reports anywhere.
• Interact with data easily in a touch-optimized experience with Power BI native windows,
iOS and Android apps.
• Data-driven alerts
Data Connections
Two kinds of connection to source data
• Direct Query
• Live connection to data source
• Performance will be based on data source
• No need for data to be refreshed on schedule
• Import
• Brings data in memory
• Refresh needed to view changes that occurred in the underlying data.
Pricing
• Power BI – free version
• Limited data capacity limit (1GB/user)
• Data refresh- daily vs multiple times a day with Power BI PRO
• Limited data sources – cannot connect to on-premise database server
• Power BI PRO - $9.99 per user per month
• Data Capacity limit : 10GB/user
• Data refresh- up to 8 times per day
***** Please contact Microsoft for more information on pricing *****
Tableau Power BI
• Supports SSBI (Self Service BI)
• Can connect to multiple data sources
• View visualizations on different devices
• No technical knowledge required hence less training cost
• Customizing user-specific dashboards
• Licensing is based on a Per Processor Model
• Story-telling feature
• Ability to customize tool-tip content per user needs
• Easier grouping ability: creating a new field with groups
• “What-if” Analysis using parameters
• Data interpreter
• Supports SSBI
• Can connect to multiple data sources
• View visualizations on different devices
• High level of DAX knowledge hence more training cost
• Licensing is based on a Per User Model
• Plotting limitations of 2500 marks (takes away plotted points)
• Q&A Feature
• Ability to customize tool-tip content
• Allows for sharing of content through ‘content-packs’
• Applied steps visible (easy to undo)
Which tool is better?
 Depends on budget and visualization needs
• Power BI pros
• Affordable
• Attached to a major brand: tight integration with familiar tools such as
Excel, Azure, etc.
• New features added frequently
• Great for excel users
• Extensive database connectivity capabilities
• Q&A feature
• Publish to Web
• Power BI Cons
• Most advanced calculations require DAX knowledge
• More training cost
• No solution for data quality
• Tableau pros
• Excellent user interface
• Less training cost
• very fast and easy to create visualizations
• Good customer support
• Data Interpreter
• Story-telling ability
• Tableau Cons
• Relatively high cost
• No change management or versioning
Conclusion
 No one-size-fits-all solution:
The best tool depends on your organization's specific needs and budget.
 Power BI:
Ideal for organizations heavily invested in the Microsoft ecosystem and requiring integrated dataflows for
ETL.
 Tableau:
Ideal for organizations prioritizing extensive data exploration, advanced customization options, and a
large user community.
 Careful evaluation:
Organizations should carefully evaluate their requirements and budget before making a decision.
Source
1) Erin Burrell Nickell: An introductory audit data analytics case study: Using Microsoft Power BI and Benford’s Law to
detect accounting irregularities (2023)
2) Yasmine Fittouhi: The composition tableau and reconstruction of the canonical Weierstrass section for parabolic adjoint
action in type A (2023)
3) Harcharanjit Singh Mahinder Singh: The impact of business intelligence, big data analytics capability, and green
knowledge management on sustainability performance (2023)
4) https://www.quora.com/What-are-differences-between-Tableaus-Desktop-Server-Public-Online-versions-Does-Tableau-
server-online-versions-need-Tableau-Desktop
5) https://www.interworks.com/blog/bfair/2014/08/26/tableau-online-vs-tableau-server-5-things-consider
6) http://www.butleranalytics.com/microsoft-power-bi-vs-tableau/
7) http://sqlmag.com/power-bi/introducing-free-power-bi-designer-desktop-app
http://public.tableau.com/shared/QH6PH5GMG?:display_count=yes&:showVizHome=no
8) http://content.criticalpathtraining.com/blog/road-ahead-power-bi/

Data Visualization_ Power BI vs. Tableau.pptx

  • 1.
  • 2.
    Outline • What isBI? • Tableau: products, features and pricing • Power BI: products, features and pricing • Comparing Power BI and Tableau • Which one is better for your company?
  • 3.
    What is BusinessIntelligence? • Raw Data  Useful Information • Uses a set of tools and skill sets to help business owners make informative decisions
  • 4.
    Data  Information •Data from multiple sources are organized and loaded onto a common storage (using ETL) • Reporting tools are then used to build reports based on user needs.
  • 5.
    Data visualization Tools Thepower of visualization: • Data visualization tools like Power BI and Tableau help us transform raw data into compelling visuals, making complex information easier to understand and interpret. Choosing the right tool: • With a variety of data visualization tools available, selecting the right one for your organization can be challenging. • This presentation will compare Power BI and Tableau, highlighting their key features and helping you make an informed decision.
  • 6.
    Tableau: Leading DataVisualization and Business Intelligence Tool • Visualization tool designed to support faster solutions • Build reports in a matter of minutes using drag and drop • No programming language knowledge needed • Create customized dashboards to fit the need of the business. • Create a story using a sequence of worksheets.
  • 7.
    Tableau products • TableauDesktop • Tableau Server • Tableau Online • Tableau Public • Tableau Reader
  • 8.
    Tableau Desktop • Thetool used to create visualization and analyze the data • Create workbooks, dashboards and stories • Two editions: • Personal Edition: • limited data sources: can only connect to flat files • no ability to connect to Tableau Server • Professional Edition: • full enterprise capabilities • Publish visualizations onto Tableau online or Tableau public.
  • 9.
    Tableau Server • Anonline solution for sharing, distributing and collaborating on content created in tableau. • Interactive dashboards on web browsers or tablets • Subscribe to a dashboard and automatically receive updates • Priced per user or server core • Requires planning • Optimal hardware and IT resources • Security • Ability to create user filter based on necessary field • Behind firewall, hence provides the most security
  • 10.
    Tableau Online • Cloudbased visualization • Priced per user per year • Hosted version of Tableau Server • Automatically schedule refreshes and add data models • Visualizations created on Tableau Desktop can be published onto Online within seconds • No setup, no hardware, no management necessary
  • 11.
    Tableau Public • Allowsto view visualization free • Visualization will be public • Free tool Tableau Reader • Free tool • Desktop application viewing visualization • No ability to edit visualization / Read-only
  • 12.
    Data Connection • Twokinds of connection to source data: • Live Data Connection • Used for real-time analytics • Performance is based on database performance • Extraction • Data is brought in memory • Performance is not based on database performance • Used for interactive analysis
  • 13.
    Dashboards • Each tableauvisualization is created on a worksheet. • Multiple worksheets can be combined to create a dashboard • Dashboards provide an over view of the business system at a glance. • Show multiple dimensions of the data summarized in one page • Efficient and quick to respond to critical issues and/or opportunities.
  • 14.
  • 15.
    Pricing • Tableau DesktopPersonal Edition: $999 per user • Tableau Desktop Professional Edition: $1,999 per user • Tableau Online: $500 per user, per year • Tableau Public: Free • Tableau Server: two options: • enterprise option: no restriction on number of users/ restriction on hardware • named user: no hardware restriction / restriction on user / pay per user • Free Trial Available *****please contact Tableau for more pricing information (check Tableau website) *****
  • 16.
    Power BI • Microsoftproduct • Cloud-based business analytics service • Share reports and dashboards across a wide range of browsers, and devices such as tablets and mobile phones. • Integration with familiar Microsoft products: Excel, PowerPivot, etc.
  • 17.
    • Easy connectionto multiple data sources: Excel spreadsheets, cloud services, on premise databases, etc. • Uses DAX formulas to create calculated columns, as well as Quick Calculations such as % of grand total • The Power BI team releases 20+ features every month: free to incorporate.
  • 18.
    Features • Real-time dashboards;helping business owners solve problems as they occur • Power BI Embedded: azure service that enables applications to interact with Power BI • Q&A feature: allowing users to ask questions using natural language to get answers in graphical form. • Content Packs: for sharing dashboards with team
  • 19.
    Power BI products •Power BI Desktop • Power BI Mobile • Power BI Publisher for Excel
  • 20.
    Power BI Desktop •Application where all visualizations are created • Transform and clean data with Query Editor • 3 views: • Reports • Data • Relationships
  • 21.
    Query Editor • Loaddata from multiple sources • Transform data to meet analysis needs • Create new columns of calculated results • Remembers all applied steps
  • 22.
    Power BI Mobile •Allows to view dashboards and reports anywhere. • Interact with data easily in a touch-optimized experience with Power BI native windows, iOS and Android apps. • Data-driven alerts
  • 23.
    Data Connections Two kindsof connection to source data • Direct Query • Live connection to data source • Performance will be based on data source • No need for data to be refreshed on schedule • Import • Brings data in memory • Refresh needed to view changes that occurred in the underlying data.
  • 24.
    Pricing • Power BI– free version • Limited data capacity limit (1GB/user) • Data refresh- daily vs multiple times a day with Power BI PRO • Limited data sources – cannot connect to on-premise database server • Power BI PRO - $9.99 per user per month • Data Capacity limit : 10GB/user • Data refresh- up to 8 times per day ***** Please contact Microsoft for more information on pricing *****
  • 25.
    Tableau Power BI •Supports SSBI (Self Service BI) • Can connect to multiple data sources • View visualizations on different devices • No technical knowledge required hence less training cost • Customizing user-specific dashboards • Licensing is based on a Per Processor Model • Story-telling feature • Ability to customize tool-tip content per user needs • Easier grouping ability: creating a new field with groups • “What-if” Analysis using parameters • Data interpreter • Supports SSBI • Can connect to multiple data sources • View visualizations on different devices • High level of DAX knowledge hence more training cost • Licensing is based on a Per User Model • Plotting limitations of 2500 marks (takes away plotted points) • Q&A Feature • Ability to customize tool-tip content • Allows for sharing of content through ‘content-packs’ • Applied steps visible (easy to undo)
  • 26.
    Which tool isbetter?  Depends on budget and visualization needs • Power BI pros • Affordable • Attached to a major brand: tight integration with familiar tools such as Excel, Azure, etc. • New features added frequently • Great for excel users • Extensive database connectivity capabilities • Q&A feature • Publish to Web • Power BI Cons • Most advanced calculations require DAX knowledge • More training cost • No solution for data quality
  • 27.
    • Tableau pros •Excellent user interface • Less training cost • very fast and easy to create visualizations • Good customer support • Data Interpreter • Story-telling ability • Tableau Cons • Relatively high cost • No change management or versioning
  • 28.
    Conclusion  No one-size-fits-allsolution: The best tool depends on your organization's specific needs and budget.  Power BI: Ideal for organizations heavily invested in the Microsoft ecosystem and requiring integrated dataflows for ETL.  Tableau: Ideal for organizations prioritizing extensive data exploration, advanced customization options, and a large user community.  Careful evaluation: Organizations should carefully evaluate their requirements and budget before making a decision.
  • 29.
    Source 1) Erin BurrellNickell: An introductory audit data analytics case study: Using Microsoft Power BI and Benford’s Law to detect accounting irregularities (2023) 2) Yasmine Fittouhi: The composition tableau and reconstruction of the canonical Weierstrass section for parabolic adjoint action in type A (2023) 3) Harcharanjit Singh Mahinder Singh: The impact of business intelligence, big data analytics capability, and green knowledge management on sustainability performance (2023) 4) https://www.quora.com/What-are-differences-between-Tableaus-Desktop-Server-Public-Online-versions-Does-Tableau- server-online-versions-need-Tableau-Desktop 5) https://www.interworks.com/blog/bfair/2014/08/26/tableau-online-vs-tableau-server-5-things-consider 6) http://www.butleranalytics.com/microsoft-power-bi-vs-tableau/ 7) http://sqlmag.com/power-bi/introducing-free-power-bi-designer-desktop-app http://public.tableau.com/shared/QH6PH5GMG?:display_count=yes&:showVizHome=no 8) http://content.criticalpathtraining.com/blog/road-ahead-power-bi/

Editor's Notes

  • #4 BI is a process that converts raw data into useful information.
  • #10 User filter: allows specific users to see only allowed filters Tableau server allows viewing data on mobile device
  • #11 Hosted in the cloud Everyone will be working from a single point of truth no matter where they are No, you won’t be able to brand your sites with your own logo
  • #14 Dimensions: region, product category, age-group (helping businesses with marketing strategies)
  • #19 PowerBI Embedded allows to easily embed interactive visuals in you app using REST APIs and Power BI SDK. Use Power BI Rest APIs to enumerate datasets and reports, provision datasets and reports, embed reports, set connection strings and credentials programmatically.
  • #21 Report view – where you use queries you create to build compelling visualizations, arranged as you want them to appear, and with multiple pages, that you can share with others Data view – see the data in your report in data model format, where you can add measures, create new columns, and manage relationships Relationships view – get a graphical representation of the relationships that have been established in your data model, and manage or modify them as needed.
  • #28 Data interpreter: senses when data doesn’t look “right” and fixes it All in all if budget is not an issue and if the report developers are not IT professionals, Tableau is a better option. If budget is limited and your company has IT professionals for developing visualizations, Power BI is a better choice. Versioning: tableau online would always show the latest version (no previous version retrieval)
  • #29 IT Professionals that either already have DAX knowledge, or easier to train on DAX