Download to read offline


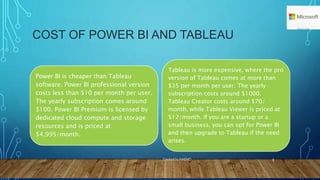
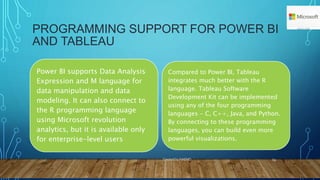
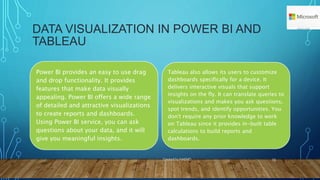
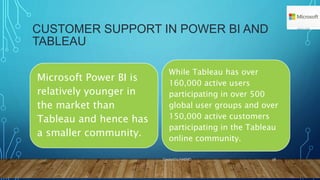
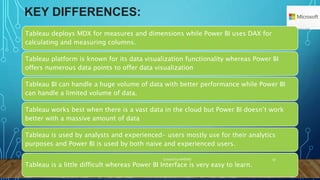

This document provides information about Microsoft PowerPoint and compares the business intelligence tools Power BI and Tableau. It discusses their differences in areas like cost, performance with large data volumes, user interfaces, supported data sources, programming support, data visualization capabilities, and customer support. Key differences highlighted are that Tableau uses MDX while Power BI uses DAX, Tableau's focus on data visualization versus Power BI offering multiple data points, and Tableau's better handling of large data volumes compared to Power BI.