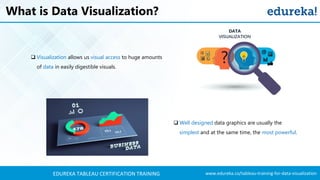
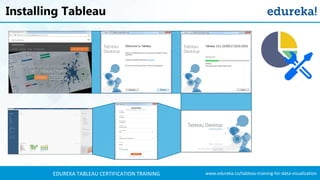
www.edureka.co/tableau-training-for-data-visualizationEDUREKA TABLEAU CERTIFICATION TRAINING
What to expect?
 Data Visualization
 Why Tableau?
 What is Tableau?
 Installing Tableau
 Understanding Tableau
 Visualizations in Tableau
 Functions in Tableau
 Success Story
www.edureka.co/tableau-training-for-data-visualizationEDUREKA TABLEAU CERTIFICATION TRAINING
Data Visualization
www.edureka.co/tableau-training-for-data-visualizationEDUREKA TABLEAU CERTIFICATION TRAINING
What is Data Visualization?
 Visualization allows us visual access to huge amounts
of data in easily digestible visuals.
 Well designed data graphics are usually the
simplest and at the same time, the most powerful.
www.edureka.co/tableau-training-for-data-visualizationEDUREKA TABLEAU CERTIFICATION TRAINING
Power of Data Visualization
Graphical Data Visualization
Anscombe’s Quartet Dataset
When viewed in tabular format, all the four quartets look
similar
X Y
I
X Y X Y X Y
II III IV
www.edureka.co/tableau-training-for-data-visualizationEDUREKA TABLEAU CERTIFICATION TRAINING
Scope of Visual Analytics
www.edureka.co/tableau-training-for-data-visualizationEDUREKA TABLEAU CERTIFICATION TRAINING
Data Visualization
Integrate Different Data Sets Analyze Visualize
www.edureka.co/tableau-training-for-data-visualizationEDUREKA TABLEAU CERTIFICATION TRAINING
Why Tableau?
www.edureka.co/tableau-training-for-data-visualizationEDUREKA TABLEAU CERTIFICATION TRAINING
Why Tableau?
Tableau
Interactive
Visuals
Quick
Production
Time
Flexibility
Intuitive
Platform
Features
www.edureka.co/tableau-training-for-data-visualizationEDUREKA TABLEAU CERTIFICATION TRAINING
What is Tableau?
www.edureka.co/tableau-training-for-data-visualizationEDUREKA TABLEAU CERTIFICATION TRAINING
What is Tableau?
 Tableau is a Software company which produces interactive data visualization products focused
on business intelligence.
 Tableau helps the world’s largest organizations unleash the power of their most valuable assets:
their data and their people.
 Allows the customers to spend more time on data analysis and less on “data wrangling”.
www.edureka.co/tableau-training-for-data-visualizationEDUREKA TABLEAU CERTIFICATION TRAINING
Tableau Architecture
www.edureka.co/tableau-training-for-data-visualizationEDUREKA TABLEAU CERTIFICATION TRAINING
Tableau Architecture
TDEExtract
Live
Publish
Users
www.edureka.co/tableau-training-for-data-visualizationEDUREKA TABLEAU CERTIFICATION TRAINING
Installing Tableau
www.edureka.co/tableau-training-for-data-visualizationEDUREKA TABLEAU CERTIFICATION TRAINING
Installing Tableau
www.edureka.co/tableau-training-for-data-visualizationEDUREKA TABLEAU CERTIFICATION TRAINING
Understanding Tableau
www.edureka.co/tableau-training-for-data-visualizationEDUREKA TABLEAU CERTIFICATION TRAINING
Tableau UI - Connections
We can connect to multiple file
formats and servers in Tableau
www.edureka.co/tableau-training-for-data-visualizationEDUREKA TABLEAU CERTIFICATION TRAINING
Tableau UI – Connections
“ You can rename the data source just
by clicking on it. “
Connection Established with file: “
Sample – Superstore ” We have connected to an Excel
Sheet “Sample - Superstore”
This is the Dashboard once we
load data into Tableau Desktop
A preview of the data
set can be seen before
opening our worksheet
www.edureka.co/tableau-training-for-data-visualizationEDUREKA TABLEAU CERTIFICATION TRAINING
Tableau Datatypes
True / False
Boolean
True / False
5
Number (Whole)
Whole Numbers
5.0000
Number (Decimal)
Decimal Numbers
Welcome to Tableau
Text / String
Text or String Values
December 31, 2016
Date
Date Values
December 31, 2016
01:00:00 AM
Date & Time
Date &
Timestamp Values
New York, France,
India, Beijing
Geographical
Values
Geographical Mapping
Icon Data type
Text (string) values
Date values
Date & Time values
Numerical values
Boolean values
Geographic values
www.edureka.co/tableau-training-for-data-visualizationEDUREKA TABLEAU CERTIFICATION TRAINING
Tableau Desktop UI
Tableau Dashboard
Data Pane
Marks Card
Toolbar
Canvas
Column and
Row Shelves
Workspace
www.edureka.co/tableau-training-for-data-visualizationEDUREKA TABLEAU CERTIFICATION TRAINING
Tableau UI – Dimensions & Measures
Once we connect to a data source in
Tableau, the columns get divided into
Dimensions and Measures.
A Dimension is a field that is an
independent variable.
A Measure is a field that is a Dependent
Variable and its value is a function of one
or more Dimensions.
www.edureka.co/tableau-training-for-data-visualizationEDUREKA TABLEAU CERTIFICATION TRAINING
Tableau UI – Show Me
Show Me in Tableau shows all the possible
visualizations available for our data source.
The visualizations that are highlighted are
the ones that are currently available for the
current selection of dimensions and
measures.
www.edureka.co/tableau-training-for-data-visualizationEDUREKA TABLEAU CERTIFICATION TRAINING
Visualizations in Tableau
www.edureka.co/tableau-training-for-data-visualizationEDUREKA TABLEAU CERTIFICATION TRAINING
Tableau – Visualizations
Bar Graph Line Graph Dual Axis Graph
www.edureka.co/tableau-training-for-data-visualizationEDUREKA TABLEAU CERTIFICATION TRAINING
Tableau – Visualizations
Area Graph with Dual AxesGeographical Graph
www.edureka.co/tableau-training-for-data-visualizationEDUREKA TABLEAU CERTIFICATION TRAINING
Tableau – Visualizations
Heat Map
www.edureka.co/tableau-training-for-data-visualizationEDUREKA TABLEAU CERTIFICATION TRAINING
Tableau – Visualizations
Tree Map
www.edureka.co/tableau-training-for-data-visualizationEDUREKA TABLEAU CERTIFICATION TRAINING
Tableau – Applying Visualizations
Visualization Application
Bar Graph Used when Dimension is discontinuous
Line Graph Preferred for continuous Dimensions
Dual Axis Graph Used to represent two Measures together
Geographical Graph Used to plot Measures on geographical map
Area Graph – Dual Axes Provides better comparison amongst Measures
Heat Map Used to visualize variations across categories
Tree Map Used to represent quantity in nested rectangles
Let us discuss which visualizations are the best for various applications
www.edureka.co/tableau-training-for-data-visualizationEDUREKA TABLEAU CERTIFICATION TRAINING
Functions in Tableau
www.edureka.co/tableau-training-for-data-visualizationEDUREKA TABLEAU CERTIFICATION TRAINING
Tableau – Join & Union
Join – Combine Columns Union – Combine Rows
Join and Union functions are used to perform operations to combine data
www.edureka.co/tableau-training-for-data-visualizationEDUREKA TABLEAU CERTIFICATION TRAINING
Tableau – Sort
Sorting
Sub-Categories
Sort function can be used to sort categories and sub categories based on their measure
www.edureka.co/tableau-training-for-data-visualizationEDUREKA TABLEAU CERTIFICATION TRAINING
Tableau – Set
Using
Set Function
Set is a type of filter where we can set a condition for displaying values, e.g. Discount > 10%
www.edureka.co/tableau-training-for-data-visualizationEDUREKA TABLEAU CERTIFICATION TRAINING
Tableau – Forecasting
Forecasting
for Future
Forecasting is used to predict the future trend based on the current values of graphs
www.edureka.co/tableau-training-for-data-visualizationEDUREKA TABLEAU CERTIFICATION TRAINING
Tableau – Data Granularity
We have connected to an Excel Sheet
“Sample - Superstore”
This is the Dashboard once we load
data into Tableau Desktop
www.edureka.co/tableau-training-for-data-visualizationEDUREKA TABLEAU CERTIFICATION TRAINING
Tableau – Highlighting
Highlighting
Fields
Highlighting is used to highlight specific sub categories among all others
www.edureka.co/tableau-training-for-data-visualizationEDUREKA TABLEAU CERTIFICATION TRAINING
Tableau – Device Designer
Device Designer is used to make best visualizations for specific devices
www.edureka.co/tableau-training-for-data-visualizationEDUREKA TABLEAU CERTIFICATION TRAINING
Practical Demo
www.edureka.co/tableau-training-for-data-visualizationEDUREKA TABLEAU CERTIFICATION TRAINING
IMDb Movie Data – Flow Diagram
Huge amount of
Movie Rating data
1
Input Data into
Tableau
2
Creating
Visualizations
4
Matching Predictions
with Actual Box
Office Numbers
5
Find correlation
between IMDb &
Movie Budget
Compare Gross &
IMDb Rating
Insight 1
Insight 2
3
3
How does Facebook
Campaign affect
Movie Sales?
Predict Movie Success
based on Actors,
Genre and Directors
Insight 3 Insight 4
33
www.edureka.co/tableau-training-for-data-visualizationEDUREKA TABLEAU CERTIFICATION TRAINING
Tableau Success
www.edureka.co/tableau-training-for-data-visualizationEDUREKA TABLEAU CERTIFICATION TRAINING
Companies using Tableau
50,000+
Customers
Shubham
www.edureka.co/tableau-training-for-data-visualizationEDUREKA TABLEAU CERTIFICATION TRAINING
Tableau – Success Stories
“Tableau is changing the game for us. It's reduced the time
that they have to spend on lower-value-add activities.”
– Ryan Renner, Deloitte
“It increases our sales; it decreases our costs. There's a direct
impact. It just gets you insight faster.”
– Geraldine Niemczyk, One Kings Lane
“You have crafted a powerful analytical tool for us. Thank
you.”
– Alan Benjamin, Cinemark
“The impact was dramatic. That’s why we feel good about
completely redoing the way we do analytics. This is going to
help EOS and analytics to the next level.”
– Maile Hadley, Equal Opportunity Schools
www.edureka.co/tableau-training-for-data-visualizationEDUREKA TABLEAU CERTIFICATION TRAINING
Summary
www.edureka.co/tableau-training-for-data-visualizationEDUREKA TABLEAU CERTIFICATION TRAINING
Summary
Data Visualization
Understanding TableauInstalling Tableau
Tableau Features What is Tableau?
Tableau Connections
www.edureka.co/tableau-training-for-data-visualizationEDUREKA TABLEAU CERTIFICATION TRAINING
Summary
Tableau Visualizations Tableau Functions
Tableau Customers Tableau Success Story
www.edureka.co/tableau-training-for-data-visualizationEDUREKA TABLEAU CERTIFICATION TRAINING
Thank You …
Questions/Queries/Feedback

Tableau Tutorial For Beginners | Tableau Training For Beginners | Tableau Certification | Edureka