Download to read offline
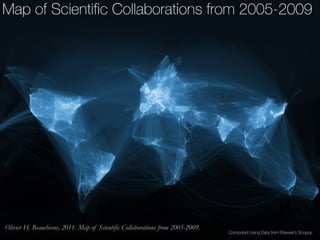
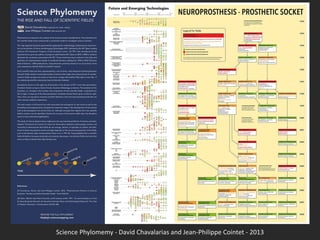


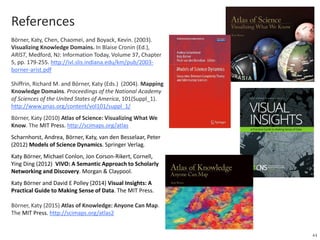

The document discusses the importance of data visualization in elucidating trends and developments in science and technology. It highlights various research collaborations, visualization methodologies, and projects aimed at mapping scientific knowledge production globally. Additionally, it outlines a course framework for teaching information visualization, featuring topics such as workflow design and hands-on data analysis and visualization techniques.


