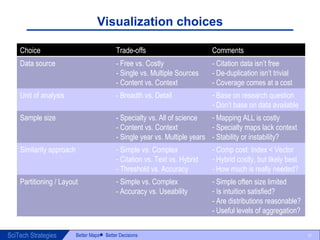
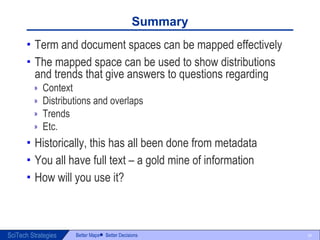
Taxonomy and Corpus Assessment:  Using Visualization Kevin W. Boyack DHUG Meeting, February 9, 2012
SciTech Strategies, Inc. Richard Klavans, Henry Small, Kevin Boyack Decades of experience in Citation analysis Science mapping Metrics People associate us with “visualization” Current interests Structure and dynamics of STI (science, technology, innovation) Impacts of funding on structure and dynamics Emergence, evolution How does access to full text change or view of or ability to model the above?
Our maps SciVal Spotlight ® UCSD Map of Science
Recurring questions Does our coverage match our mission, vision, or charter? Is our thesaurus / taxonomy up to date / sufficient? Where is the industry headed?  Does it vary by sector?  Can we forecast our own direction? What are the trends – are topics emerging / dying? Can we use our own data to answer these questions? Can we become smarter about our data and potential markets using our collection in new ways? Can we enhance our data?
Visualization Can visualization play a part in the answers? Yes, but just what is visualization? It’s not just the picture!  It’s the entire process that leads to the picture Define the question (content or context) Data selection Data cleaning and processing Analysis Then, you can create the visual
Some questions with visual answers From a thesaurus / taxonomy perspective What terms are too broadly defined? How do actual topical relationships differ from the thesaurus structure? What terms could / should be added? From a vendor / publisher perspective Which topical areas form our core?  periphery? Where is the coverage dense?  thin?  Which topical areas are most active?  least active? Which topical areas seem to be emerging?  declining? Which topical areas are interrelated?  isolated? What are the overlaps between journals / segments? Where are the potential expansion points?
Content vs. context Content Requires only your own data Focused Computationally tractable Good if you don’t need context Context Requires more data than just your own Broad More computationally intensive but …. You can see results in a broader (competitive) context
Content examples
Thesaurus structure / balance
Term relationship structure
Society overlay on term structure
Partitioning and overlaps
Context examples Requires more data than just your own Adding other focused datasets Placing your data in the context of a global dataset (e.g. Scopus) We have done both A micro-structural model of a global database lends itself to analysis at the micro-level Micro-level indicators and trends
Term expansion (IEEE, USPTO, MeSH)
Global micro-model (Scopus) 2010 fileyear 1.8 M documents 115k clusters Cluster histories Cluster metrics Cluster   memberships
PubMed overlay
Cluster histories (threads)
Map of threads containing IEEE literature
IEEE Society overlays
Science mapping 30-40 year tradition of science mapping Well-established methodologies Current computing power and data availability enable large scale mapping and analysis Science maps can/have been created using Articles, Journals, Authors, Terms A map can be thought of as a visual representation of a classification system provided … The classification system DOES contain a relationship structure Maps used for communication, strategy, planning, evaluation …
Visualization choices Choice Trade-offs Comments Data source - Free vs. Costly - Single vs. Multiple Sources - Content vs. Context - Citation data isn’t free - De-duplication isn’t trivial - Coverage comes at a cost Unit of analysis - Breadth vs. Detail Base on research question Don’t base on data available Sample size - Specialty vs. All of science - Content vs. Context - Single year vs. Multiple years Mapping ALL is costly Specialty maps lack context - Stability or instability? Similarity approach Simple vs. Complex Citation vs. Text vs. Hybrid - Threshold vs. Accuracy Comp cost: Index < Vector Hybrid costly, but likely best - How much is really needed? Partitioning / Layout Simple vs. Complex - Accuracy vs. Useability Simple often size limited Is intuition satisfied? - Are distributions reasonable? - Useful levels of aggregation?
Visualization choices Are often made based on what is available Data, algorithms, expertise When they should be made based on The research question or application Balancing of the applicable trade-offs
Summary Term and document spaces can be mapped effectively The mapped space can be used to show distributions and trends that give answers to questions regarding Context Distributions and overlaps Trends Etc. Historically, this has all been done from metadata You all have full text – a gold mine of information How will you use it?
Thank you!

Taxonomy and Corpus Assessment: Using Visualization

  • 1.
    Taxonomy and CorpusAssessment: Using Visualization Kevin W. Boyack DHUG Meeting, February 9, 2012
  • 2.
    SciTech Strategies, Inc.Richard Klavans, Henry Small, Kevin Boyack Decades of experience in Citation analysis Science mapping Metrics People associate us with “visualization” Current interests Structure and dynamics of STI (science, technology, innovation) Impacts of funding on structure and dynamics Emergence, evolution How does access to full text change or view of or ability to model the above?
  • 3.
    Our maps SciValSpotlight ® UCSD Map of Science
  • 4.
    Recurring questions Doesour coverage match our mission, vision, or charter? Is our thesaurus / taxonomy up to date / sufficient? Where is the industry headed? Does it vary by sector?  Can we forecast our own direction? What are the trends – are topics emerging / dying? Can we use our own data to answer these questions? Can we become smarter about our data and potential markets using our collection in new ways? Can we enhance our data?
  • 5.
    Visualization Can visualizationplay a part in the answers? Yes, but just what is visualization? It’s not just the picture! It’s the entire process that leads to the picture Define the question (content or context) Data selection Data cleaning and processing Analysis Then, you can create the visual
  • 6.
    Some questions withvisual answers From a thesaurus / taxonomy perspective What terms are too broadly defined? How do actual topical relationships differ from the thesaurus structure? What terms could / should be added? From a vendor / publisher perspective Which topical areas form our core? periphery? Where is the coverage dense? thin? Which topical areas are most active? least active? Which topical areas seem to be emerging? declining? Which topical areas are interrelated? isolated? What are the overlaps between journals / segments? Where are the potential expansion points?
  • 7.
    Content vs. contextContent Requires only your own data Focused Computationally tractable Good if you don’t need context Context Requires more data than just your own Broad More computationally intensive but …. You can see results in a broader (competitive) context
  • 8.
  • 9.
  • 10.
  • 11.
  • 12.
    Society overlay onterm structure
  • 13.
  • 14.
  • 15.
  • 16.
    Context examples Requiresmore data than just your own Adding other focused datasets Placing your data in the context of a global dataset (e.g. Scopus) We have done both A micro-structural model of a global database lends itself to analysis at the micro-level Micro-level indicators and trends
  • 17.
  • 18.
    Global micro-model (Scopus)2010 fileyear 1.8 M documents 115k clusters Cluster histories Cluster metrics Cluster memberships
  • 19.
  • 20.
  • 21.
    Map of threadscontaining IEEE literature
  • 22.
  • 23.
  • 24.
  • 25.
  • 26.
    Science mapping 30-40year tradition of science mapping Well-established methodologies Current computing power and data availability enable large scale mapping and analysis Science maps can/have been created using Articles, Journals, Authors, Terms A map can be thought of as a visual representation of a classification system provided … The classification system DOES contain a relationship structure Maps used for communication, strategy, planning, evaluation …
  • 27.
    Visualization choices ChoiceTrade-offs Comments Data source - Free vs. Costly - Single vs. Multiple Sources - Content vs. Context - Citation data isn’t free - De-duplication isn’t trivial - Coverage comes at a cost Unit of analysis - Breadth vs. Detail Base on research question Don’t base on data available Sample size - Specialty vs. All of science - Content vs. Context - Single year vs. Multiple years Mapping ALL is costly Specialty maps lack context - Stability or instability? Similarity approach Simple vs. Complex Citation vs. Text vs. Hybrid - Threshold vs. Accuracy Comp cost: Index < Vector Hybrid costly, but likely best - How much is really needed? Partitioning / Layout Simple vs. Complex - Accuracy vs. Useability Simple often size limited Is intuition satisfied? - Are distributions reasonable? - Useful levels of aggregation?
  • 28.
    Visualization choices Areoften made based on what is available Data, algorithms, expertise When they should be made based on The research question or application Balancing of the applicable trade-offs
  • 29.
    Summary Term anddocument spaces can be mapped effectively The mapped space can be used to show distributions and trends that give answers to questions regarding Context Distributions and overlaps Trends Etc. Historically, this has all been done from metadata You all have full text – a gold mine of information How will you use it?
  • 30.

Editor's Notes

  • #28 This list is not complete. Choices and tradeoffs are oversimplified here, but are representative. Comments are obvious in most cases, but often ignored.