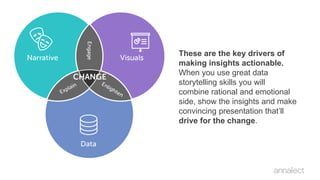
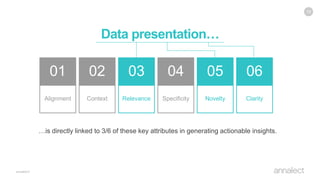
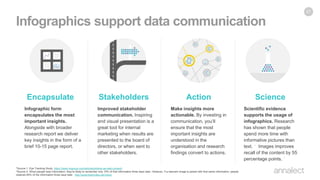
Actionable Insights
How data presentation skills convert insights to actions
How data
presentation
skills convert
insights to
actions
72% 29%Of companies want to be
“data-driven”
Of companies are successful at
connecting analytics to actions.
Vs.
Lähde: Forrester, https://go.forrester.com/blogs/16-03-09-think_you_want_to_be_data_driven_insight_is_the_new_data/
New skill in the list!
“Data Scientist: The Sexiest
Job of the 21st Century”
4
Harvard Business Review
Companies have hired
mathematicians and statistical
experts who are specialised in
data mining and analysing.
These capabilities have
increased amount of insights
generated from data but
companies are still struggling
with data presentation.
5
“Numbers have an important story to tell.
They rely on you to give them a clear and
convincing voice.”
6
- Stephen Few, Data Visualisation expert
Data presentation is skill based on three key
elements: data, visuals and narrative.
Narrative combined with data helps
to explain what’s happening in the data and
why particular insight is especially important.
When you map data using
visuals you’ll enlighten the audience. As
infographics expert Alberto Cairo has put it
“Show, don’t tell”. Visuals, illustrations and
images have an great impact in convincing
your audience.
Combine narrative with visuals and you’ll have
engaging presentation.
For example think about TED Talks. They
enlighten and inspire our imagination and
appeal to our rational side. In a research about
top 500 TED Talks it was found out that stories
made up at least 65% of their content.
These are the key drivers of
making insights actionable.
When you use great data
storytelling skills you will
combine rational and emotional
side, show the insights and make
convincing presentation that’ll
drive for the change.
Actionable Insight consists of six attributes
11
12
01
Alignment
Insights closely tied to your key
business goals are the most
important ones driving your
business forward.
13
02
Context
Insight without context is
nothing. We need to be able to
relate the findings with something.
14
03
Relevance
Are these insights brought to right persons
at the right time with right setting? Reports
are too often buried in the e-mail boxes of
marketing manager.
15
04
Specificity
The specific insights are more likely to be
acted on. If you are selling more than last
month you should probably find out why this is
happening.
16
05
Novelty
We will become numb to insights if they don't
challenge our knowledge and preconceptions.
Fresh insights with new angles are more likely
to generate actions. Visualize data in a new
way to find new perspective on existing data.
17
06
Clarity
If people don't clearly understand insights,
the content will be forgotten. Too many times
reports are quickly gathered without
understanding the importance of this stage.
Poor communication will cause signals to
be lost and money to be thrown away.
18
01
Alignment
02
Context
03
Relevance
04
Specificity
05
Novelty
06
Clarity
Data presentation…
19
01
Alignment
02
Context
03
Relevance
04
Specificity
05
Novelty
06
Clarity
…is directly linked to 3/6 of these key attributes in generating actionable insights.
Let’s take a look at our
Instagram Influencer Report
20
VAIKUTTAJA-
MARKKINOINTI
INSTAGRAMISSA
Miten tehokasta
vaikuttajamarkkinointi on, ja
miten kuluttajat suhtautuvat
siihen?
86 %
15-24-vuotiaista
Instagramin käyttäjistä
käyttää palvelua joka päivä.
Miehiä kiinnostaa urheilu ja tekniikka,
naisia kauneus ja muoti
Miehet:
1. Urheilu
2. Tekniikka
3. Autot ja ajoneuvot
4. Vähäpukeiset ihmiset
5. Politiikka
Naiset:
1. Kauneus
2. Muoti
3. Sisustus
4. Eläimet
5. Hyvinvointi
Sukupuolittain korostuneimmat Instagram-tilien aiheet:
Ikäryhmissä
korostuvat
eri
kiinnostuksen
aiheet
15-24 v.
Meemit/memet
Kauneus
Huumori
Muoti
Muiden arkielämä
35-44 v.
Fitness
45-54 v.
Luonto
Matkailu
Eläimet
Politiikka
Uutiset
55-64 v.
Uutiset
Matkailu
Politiikka
Taide
Luonto
Vaikuttaja-
markkinointi
lisää suoraan
myyntiä.
69%
54%
47%
34%
33%
31%
Saanut tietoiseksi
tuotteesta/palvelusta
Saanut kiinnostumaan
tuotteesta/palvelusta
Saanut etsimään lisätietoa
Saanut pitämään tuotetta/palvelua
parempana
Saanut ostamaan
Saanut suosittelemaan
Onko jokin viimeisen vuoden aikana näkemäsi
Instagram-yhteistyö saanut sinut…
Tämä kysymys on kysytty niiltä, jotka ovat nähneet
Instagram-vaikuttajien ja yritysten välistä yhteistyötä
viimeisen vuoden aikana.
We offer infographic style visuals for our
customers. This will help communicating
better to the stakeholders and making
insights more actionable.
26
Infographics support data communication
27
Infographic form
encapsulates the most
important insights.
Alongside with broader
research report we deliver
key insights in the form of a
brief 10-15 page report.
Improved stakeholder
communication. Inspiring
and visual presentation is a
great tool for internal
marketing when results are
presented to the board of
directors, or when sent to
other stakeholders.
Make insights more
actionable. By investing in
communication, you’ll
ensure that the most
important insights are
understood in the
organisation and research
findings convert to actions.
Scientific evidence
supports the usage of
infographics. Research
has shown that people
spend more time with
informative pictures than
text. * Images improves
recall of the content by 55
percentage points. *
Encapsulate Stakeholders Action Science
*Source 1: Eye Tracking Study, https://www.nngroup.com/articles/photos-as-web-content/.
*Source 2: When people hear information, they're likely to remember only 10% of that information three days later. However, if a relevant image is paired with that same information, people
retained 65% of the information three days later. http://www.brainrules.net/vision
“To unleash the power of data through
technology and analytics to give clients
competitive advantage and drive business
results.”
28
Our mission in Annalect Finland:
Credits
29
Joel has several years of experience in data communication, data
visualisation and infographics at Omnicom Media Group. He consults
and helps professionals in OMD, ToinenPHD, Ainoa
Resolution and Annalect to communicate data and insights better.
Joel Kanerva
Data Visualization Designer
Mail: joel.kanerva@annalect.com
Read more about marketing analytics and data visualisation:
https://www.annalect.fi

Data Visualisation - Convert insights into actions

  • 1.
    Actionable Insights How datapresentation skills convert insights to actions How data presentation skills convert insights to actions
  • 2.
    72% 29%Of companieswant to be “data-driven” Of companies are successful at connecting analytics to actions. Vs. Lähde: Forrester, https://go.forrester.com/blogs/16-03-09-think_you_want_to_be_data_driven_insight_is_the_new_data/
  • 3.
    New skill inthe list!
  • 4.
    “Data Scientist: TheSexiest Job of the 21st Century” 4 Harvard Business Review
  • 5.
    Companies have hired mathematiciansand statistical experts who are specialised in data mining and analysing. These capabilities have increased amount of insights generated from data but companies are still struggling with data presentation. 5
  • 6.
    “Numbers have animportant story to tell. They rely on you to give them a clear and convincing voice.” 6 - Stephen Few, Data Visualisation expert
  • 7.
    Data presentation isskill based on three key elements: data, visuals and narrative. Narrative combined with data helps to explain what’s happening in the data and why particular insight is especially important.
  • 8.
    When you mapdata using visuals you’ll enlighten the audience. As infographics expert Alberto Cairo has put it “Show, don’t tell”. Visuals, illustrations and images have an great impact in convincing your audience.
  • 9.
    Combine narrative withvisuals and you’ll have engaging presentation. For example think about TED Talks. They enlighten and inspire our imagination and appeal to our rational side. In a research about top 500 TED Talks it was found out that stories made up at least 65% of their content.
  • 10.
    These are thekey drivers of making insights actionable. When you use great data storytelling skills you will combine rational and emotional side, show the insights and make convincing presentation that’ll drive for the change.
  • 11.
    Actionable Insight consistsof six attributes 11
  • 12.
    12 01 Alignment Insights closely tiedto your key business goals are the most important ones driving your business forward.
  • 13.
    13 02 Context Insight without contextis nothing. We need to be able to relate the findings with something.
  • 14.
    14 03 Relevance Are these insightsbrought to right persons at the right time with right setting? Reports are too often buried in the e-mail boxes of marketing manager.
  • 15.
    15 04 Specificity The specific insightsare more likely to be acted on. If you are selling more than last month you should probably find out why this is happening.
  • 16.
    16 05 Novelty We will becomenumb to insights if they don't challenge our knowledge and preconceptions. Fresh insights with new angles are more likely to generate actions. Visualize data in a new way to find new perspective on existing data.
  • 17.
    17 06 Clarity If people don'tclearly understand insights, the content will be forgotten. Too many times reports are quickly gathered without understanding the importance of this stage. Poor communication will cause signals to be lost and money to be thrown away.
  • 18.
  • 19.
  • 20.
    Let’s take alook at our Instagram Influencer Report 20
  • 21.
  • 22.
  • 23.
    Miehiä kiinnostaa urheiluja tekniikka, naisia kauneus ja muoti Miehet: 1. Urheilu 2. Tekniikka 3. Autot ja ajoneuvot 4. Vähäpukeiset ihmiset 5. Politiikka Naiset: 1. Kauneus 2. Muoti 3. Sisustus 4. Eläimet 5. Hyvinvointi Sukupuolittain korostuneimmat Instagram-tilien aiheet:
  • 24.
    Ikäryhmissä korostuvat eri kiinnostuksen aiheet 15-24 v. Meemit/memet Kauneus Huumori Muoti Muiden arkielämä 35-44v. Fitness 45-54 v. Luonto Matkailu Eläimet Politiikka Uutiset 55-64 v. Uutiset Matkailu Politiikka Taide Luonto
  • 25.
    Vaikuttaja- markkinointi lisää suoraan myyntiä. 69% 54% 47% 34% 33% 31% Saanut tietoiseksi tuotteesta/palvelusta Saanutkiinnostumaan tuotteesta/palvelusta Saanut etsimään lisätietoa Saanut pitämään tuotetta/palvelua parempana Saanut ostamaan Saanut suosittelemaan Onko jokin viimeisen vuoden aikana näkemäsi Instagram-yhteistyö saanut sinut… Tämä kysymys on kysytty niiltä, jotka ovat nähneet Instagram-vaikuttajien ja yritysten välistä yhteistyötä viimeisen vuoden aikana.
  • 26.
    We offer infographicstyle visuals for our customers. This will help communicating better to the stakeholders and making insights more actionable. 26
  • 27.
    Infographics support datacommunication 27 Infographic form encapsulates the most important insights. Alongside with broader research report we deliver key insights in the form of a brief 10-15 page report. Improved stakeholder communication. Inspiring and visual presentation is a great tool for internal marketing when results are presented to the board of directors, or when sent to other stakeholders. Make insights more actionable. By investing in communication, you’ll ensure that the most important insights are understood in the organisation and research findings convert to actions. Scientific evidence supports the usage of infographics. Research has shown that people spend more time with informative pictures than text. * Images improves recall of the content by 55 percentage points. * Encapsulate Stakeholders Action Science *Source 1: Eye Tracking Study, https://www.nngroup.com/articles/photos-as-web-content/. *Source 2: When people hear information, they're likely to remember only 10% of that information three days later. However, if a relevant image is paired with that same information, people retained 65% of the information three days later. http://www.brainrules.net/vision
  • 28.
    “To unleash thepower of data through technology and analytics to give clients competitive advantage and drive business results.” 28 Our mission in Annalect Finland:
  • 29.
    Credits 29 Joel has severalyears of experience in data communication, data visualisation and infographics at Omnicom Media Group. He consults and helps professionals in OMD, ToinenPHD, Ainoa Resolution and Annalect to communicate data and insights better. Joel Kanerva Data Visualization Designer Mail: joel.kanerva@annalect.com Read more about marketing analytics and data visualisation: https://www.annalect.fi