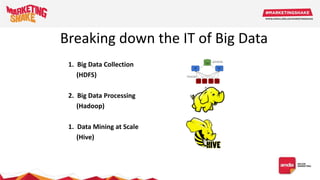
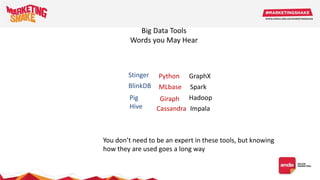
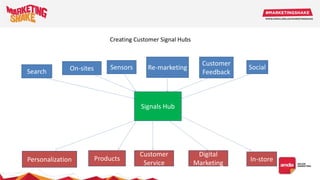
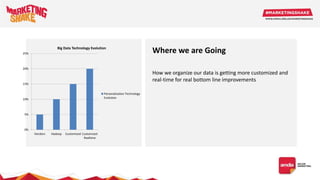
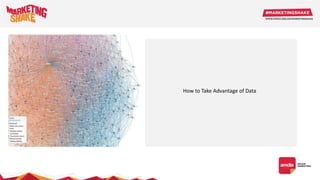
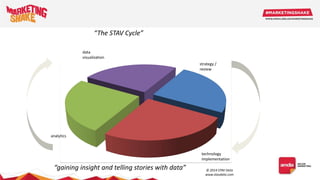
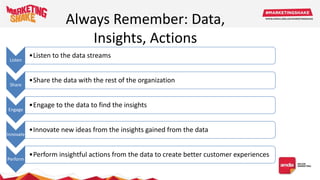
Edward Chenard
Big Data and Marketing
How Big Data is Becoming a Marketing
Tool
STAV Data
According to Gartner 85% of
Fortune 500’s are not doing it.
According to Accenture, of those
who are doing it, 75% are failing.
Few can describe it and even
fewer know how to do it.
What is Big Data?
1. Big Data Collection
(HDFS)
2. Big Data Processing
(Hadoop)
1. Data Mining at Scale
(Hive)
Breaking down the IT of Big Data
Big Data Tools
Words you May Hear
BlinkDB
CassandraHive
Python
Pig
Stinger
HadoopGiraph
Spark
GraphX
MLbase
You don’t need to be an expert in these tools, but knowing
how they are used goes a long way
Impala
Image
Unstructured
Semi
Structured
Structured
• Click Streams
• Social Streams
• RSS feeds
• XML Documents
• Spreadsheets
• Relational
Databases
Data ecosystem, what is it, how to understand it.
Unstructured data is the goldmine,
it is growing while structured data
is shrinking. But to make big data
work for you, you need to structure
of the unstructured
Image
Structured
Unstructured
First understand what kind of data
you have to work with.
How to Make Data
a Marketing Tool
How we Personalize Big Data and Marketing in Use
Combine the strengths of Google and Facebook’s methods with psychograph
techniques.
Listen, Adapt, Respond
Services co-created with customers and are interpedently with wider service
networks.
Benefits
People will log in more
Higher conversion and AOV
Better emotional bond between company and customer
Psychograph
Self
Facebook Self
Google Self
Clash between Today and
Future
Aspirational You
Present You
1-1
Sentiment
Expressed as
positive, neutral, or
negative, the
prevailing attitude
towards and entity
Behavior
These signals
identify persistent
trends or patterns in
behavior over time
Event/Alert
A discrete signal
generated when
certain threshold
conditions are met
Clusters
Signals based on an
entity’s cohort
characteristics
Correlation
Measures the
correlation of
entities against their
prescribed attributes
over time
Rate of Change
(Slow or Fast)
Quality
(Predictive or Descriptive)
Sensitivity
(Sensitive or Insensitive)
Frequency
(High or Low)
All signal types have certain qualities that describe how quickly signals can be generated
(frequency), how often the signals vary (rate of change), whether they are forward
looking (quality), and how responsive they are to stimulus (sensitivity)
Signals have attributes depending on their representation in time or frequency
domain can also be categorized into multiple classes
Signal Types
Timing/ Recency
Measure the
freshness of the
data and of the
insight
Source
Measure
sources’
strength:
originality,
importance,
quality, quantity,
influence
Content
Derive the
sentiment and
meaning from
tracking tools to
syntactic and
semantics
analysis
Context
Create symbol
language to
describe
environments in
which the data
resides
Clickstreams
Social
Articles
Blogs
Tweets
For each dimension, develop meta-data,
ontology, statistical measures, and models
High quality signals are necessary to distill the relationship among all the of the Entities across all
records (including their time dimension) involving those Entities to turn Big Data into Small Data
and capture underlying patterns to create useful inputs to be processed by a machine learning
algorithm.
Finding Signals in Unstructured Data
Behavioral
Patterns
1 to 1
Marketing
Product/Service
Compatibility
Market Trends Social
How the Data Becomes Customer Experiences
Crowd based user
actions drive
recommendations
Personalized
email
marketing
Recommendations
based on products
Use machine
learning
algorithms to
predict trends
Small world
network
communication
Algorithms analyze data
Data Capture Points, Experience Delivery Points, Metrics
Data Capture Ecosystem
The Data, Insights, Action Gap
The Data Insights Gap
Data to insights can often fall short
for a number of issues
- Difficulties in defining areas of
focus for external data
- Only gradual adoption of
exception analytics and
automated opportunity seeking
- Example (P&G / Verix Systems)
- Opportunity seeking business
alerts
- Value share alerts
- Out of stock alerts
- New Launch alerts
The Insights Action Gap
Processes and systems designed
prior to big data thinking
Examples:
- CRM
- Pricing: Buy now in-store pricing
- Supply chain and logistics
- Prevalence of operational ,
internal metrics
- Complex new concepts:
“Intents”
Image Activity Based Thinking
Human Motion Graphs
Human motion graphs help understand movement of
customers and helps to predicts timing of marketing
activities
Image
Tracking How People Respond
Image
Data Discoverers
Data Discoverers are setting the trend in what will be
common place in just a few short years.
More people will want to use their data and the
consumerization of data and technology will continue.
As this trend goes, only organization that learn to merge
the various disciplines of strategy, analytics and IT, will be
successful
Data as a Lifestyle
Real-Time Firehose
Services
Apps
Multimedia
Places
Internet of Things
Our Data Sources are Changing
Search On-sites Sensors Re-marketing
Customer
Feedback
Signals Hub
Social
Personalization Products
Customer
Service
Digital
Marketing
In-store
Creating Customer Signal Hubs
Where we are Going
How we organize our data is getting more customized and
real-time for real bottom line improvements
0%
5%
10%
15%
20%
25%
Vendors Hadoop Customized Customized
Realtime
Big Data Technology Evolution
Personalization Technology
Evolution
How to Take Advantage of Data
data
visualization
strategy /
review
technology
implementation
analytics
“The STAV Cycle”
“gaining insight and telling stories with data” © 2014 STAV Data
www.stavdata.com
Phase Typical
Issues
Recommended
Approach
Strategy / Review
Define goals / outcomes / expectations in the
form of business benefit / customer benefit;
form hypotheses / build business case;
Evaluate whether expectations for the
current cycle were met; identify
opportunities for improvement; set
expectations for the next cycle
Ignored / under-emphasized Increase emphasis
Establish formal methodology
Build capability
Technology Implementation
Identify the tools needed to accomplish the
business goal; define the technical path for
accomplishing the business goal; establish
development schedule
Over-emphasized
Initiated too early
Inadequate skill set
Decrease emphasis
Employ proof-of-concept
Use external services
Build skill set gradually / incrementally
Analysis
Analyze the data collected by the IT
implementation – find the gems; a function
for data scientists or traditional BI – not an IT
function; data science = 80% data analysis /
data cleaning, 20% algorithm creation
Descriptive orientation (business
intelligence)
Dis-integration of business
intelligence / data science
Organized in IT function / focus
on algorithm creation
Adopt predictive orientation (data science)
Integrate business intelligence / data science
Organize in business function / focus on data
analysis and data cleaning
Data Visualization
Tell the story of the patterns in the data; a
function for designers – not data scientists;
critical to making the analysis useful from a
business perspective
Located in IT function /
performed by data scientists
Focus on methodology vs.
results
Locate in business function – branding or UX
Assign to designers
“Making the Impossible Possible”
“Big Data is good for solving
impossible problems;
it just makes simple problems more
complex”
The STAV Cycle will increase the probability of of success
for any organization. Implementation of the cycle includes
many more details; it needs to be adjusted to each
organization and the goals of each project; but the basic
framework doesn’t change. If you use this framework, your
big data project will be successful.
© 2014 STAV Data
www.stavdata.com
internal /
external
(medium investment /
medium scope)
internal
(large investment /
broad scope)
external
(small investment /
narrow scope)
© 2014 STAV
Data
www.stavdat
a.com
Maturity Model /
Product Development
Life Cycle
Vision &
Goals
Governance
Execution
Clearly articulated vision for marketing and data
use, precisely defined goals with how to measure.
Defined scope of the product.
Market strategy, customer segmentation,
prioritization, org focus, measurement and
incentive systems
Production process, flexibility at scale, efficiency,
relationship management, benchmarking, metrics,
initiatives
How work gets structured
Strategy
- Define
the goals
Social
Define how to
engage
IT
Assemble the
Technology
Analytics
Make sense
of the Data
Linguistics
Distributed Processing (Hadoop)
Algorithms Development
Cross team Customer Experience
Improvement
Data science is a discipline for making sense of unstructured as well as
numerous data sets at scale
Develop Your Team
Listen
•Listen to the data streams
Share
•Share the data with the rest of the organization
Engage
•Engage to the data to find the insights
Innovate
•Innovate new ideas from the insights gained from the data
Perform
•Perform insightful actions from the data to create better customer experiences
Always Remember: Data,
Insights, Actions
Print
Radio SEO and PPC
Social
Predictive
Marketing
Television
You Are
Here
Human History of Marketing
Image credit:
www.conducthq.com
Using Data for Marketing in the Future
Predictive Marketing
• Extreme machine learning
• Collaborative predictive analytics
• Scale-invariant intelligence
• Neural networks for machine perception
• Real-time interactive big data
visualization
• Graph all the things
• Large scale machine learning cookbooks
• Collecting massive data via crowd-
sourcing
“Without big data analytics, companies are blind and deaf, wandering out
onto the web like deer onto a freeway.”
Big Data: 2014
• Personalization everywhere
• Company and consumer collaboration in service design
• Predictive location based selling
• Digital Concierges
• Real time event networks
• Graph and signal hubs merge for better understanding of
ad placement
• Large scale channel disruptions
• Marketing becomes more analytical
Big Data visionaries pose existential threats
Predictive Marketing: 2016
What’s Next: Combining contextual and analytical approaches provide a more complete picture of how customers interact
with the firm
Both approaches privilege observation and
understanding what people actually do
and look for opportunities to fix, improve
and innovate.
Robin Beers, founder of Business is Human
Location
Analysis
Graph Analysis
App and Device
Analysis
Customer
Feedback
Personal Event
Networks
Social
Personalization Digital
Concierge
Real-time
Service
Better Ad
Performance
True Omni
Signal hubs will
become new centers
for data, helping to
create better
customer insights
Predictive
Analytics
Creating Customer Signal Hubs of the Future
Although IT can build the systems, it will still be left to analyst and marketers of all types
to create the actions needed to engage customers
How Predictive Marketing is Shaping Up
Web
PDS
Email
ECC
Personal Event Network
Appt
Scheduler
Add to
Calendar
Confirmation
Email
Add
Confirmation
and Appt to
PDS
Using the digital concierge system, we can
create easy to use appointment systems,
capturing the data and using it for future
personalization efforts
Appointment setting with a Digital Concierge
Image
Engaging millions at a time
Data Monetization
- Keep it
- Sell it
- Partner with it
- Share it
Marketing of a Mass
Personalized Scale
Processes are lined, linear chains of cause and
effect.
A service is different. Processes are designed to be
consistent, personalization services are not
consistent but individualized and co-created. The
differences are not superficial but fundamental.
Co-created value requires a relationship
Marketing of the Future: Process vs Service
Marketing as a service relies on the ability of an
organization to learn from customer’s responses
and to listen and adapt to those signals.
Causes of success are never revenue, costs, profits,
etc.., those are lagging indicators or effects.
What matters are the activities that generate the
profits, activities that create long or short term
value. You can measure that via personalization as
it is a leading indicator activity if done correctly.
Marketing is about Listening and Learning
An organization’s data is found in its computer systems, but a
company’s intelligence is found its biological and social systems
--- Valdis Krebs, researcher
Linking things changes things: social networks are good at
habit building. As behaviors are repeated, they form stronger
associations over time. You form strong bongs with people in
your life with whom you spend the most time, the same can be
said in a social interactive personalization model, customers
will form strong bonds with organizations they interact with the
most over a given period of time.
Small world networks: people banding together to achieve a
wide variety of shared objectives. These are the most powerful
types of social networks and the way to truly engage customers
is to beyond just social network sites and to get into the small
world networks as a valuable member of the network.
Marketing and Social
Start small, and remember, everyone else
is in the same boat
Online Resources
What You can do now
Thank you

#MarketingShake - Edward Chenard - Descubrí el poder del Big Data para Transformar la experiencia de tus clientes.

  • 2.
    Edward Chenard Big Dataand Marketing How Big Data is Becoming a Marketing Tool STAV Data
  • 3.
    According to Gartner85% of Fortune 500’s are not doing it. According to Accenture, of those who are doing it, 75% are failing. Few can describe it and even fewer know how to do it. What is Big Data?
  • 4.
    1. Big DataCollection (HDFS) 2. Big Data Processing (Hadoop) 1. Data Mining at Scale (Hive) Breaking down the IT of Big Data
  • 5.
    Big Data Tools Wordsyou May Hear BlinkDB CassandraHive Python Pig Stinger HadoopGiraph Spark GraphX MLbase You don’t need to be an expert in these tools, but knowing how they are used goes a long way Impala
  • 7.
    Image Unstructured Semi Structured Structured • Click Streams •Social Streams • RSS feeds • XML Documents • Spreadsheets • Relational Databases Data ecosystem, what is it, how to understand it. Unstructured data is the goldmine, it is growing while structured data is shrinking. But to make big data work for you, you need to structure of the unstructured
  • 8.
    Image Structured Unstructured First understand whatkind of data you have to work with. How to Make Data a Marketing Tool
  • 9.
    How we PersonalizeBig Data and Marketing in Use Combine the strengths of Google and Facebook’s methods with psychograph techniques. Listen, Adapt, Respond Services co-created with customers and are interpedently with wider service networks. Benefits People will log in more Higher conversion and AOV Better emotional bond between company and customer Psychograph Self Facebook Self Google Self Clash between Today and Future Aspirational You Present You 1-1
  • 10.
    Sentiment Expressed as positive, neutral,or negative, the prevailing attitude towards and entity Behavior These signals identify persistent trends or patterns in behavior over time Event/Alert A discrete signal generated when certain threshold conditions are met Clusters Signals based on an entity’s cohort characteristics Correlation Measures the correlation of entities against their prescribed attributes over time Rate of Change (Slow or Fast) Quality (Predictive or Descriptive) Sensitivity (Sensitive or Insensitive) Frequency (High or Low) All signal types have certain qualities that describe how quickly signals can be generated (frequency), how often the signals vary (rate of change), whether they are forward looking (quality), and how responsive they are to stimulus (sensitivity) Signals have attributes depending on their representation in time or frequency domain can also be categorized into multiple classes Signal Types
  • 11.
    Timing/ Recency Measure the freshnessof the data and of the insight Source Measure sources’ strength: originality, importance, quality, quantity, influence Content Derive the sentiment and meaning from tracking tools to syntactic and semantics analysis Context Create symbol language to describe environments in which the data resides Clickstreams Social Articles Blogs Tweets For each dimension, develop meta-data, ontology, statistical measures, and models High quality signals are necessary to distill the relationship among all the of the Entities across all records (including their time dimension) involving those Entities to turn Big Data into Small Data and capture underlying patterns to create useful inputs to be processed by a machine learning algorithm. Finding Signals in Unstructured Data
  • 12.
    Behavioral Patterns 1 to 1 Marketing Product/Service Compatibility MarketTrends Social How the Data Becomes Customer Experiences Crowd based user actions drive recommendations Personalized email marketing Recommendations based on products Use machine learning algorithms to predict trends Small world network communication Algorithms analyze data Data Capture Points, Experience Delivery Points, Metrics Data Capture Ecosystem
  • 13.
    The Data, Insights,Action Gap The Data Insights Gap Data to insights can often fall short for a number of issues - Difficulties in defining areas of focus for external data - Only gradual adoption of exception analytics and automated opportunity seeking - Example (P&G / Verix Systems) - Opportunity seeking business alerts - Value share alerts - Out of stock alerts - New Launch alerts The Insights Action Gap Processes and systems designed prior to big data thinking Examples: - CRM - Pricing: Buy now in-store pricing - Supply chain and logistics - Prevalence of operational , internal metrics - Complex new concepts: “Intents”
  • 14.
  • 15.
    Human Motion Graphs Humanmotion graphs help understand movement of customers and helps to predicts timing of marketing activities
  • 16.
  • 17.
    Image Data Discoverers Data Discoverersare setting the trend in what will be common place in just a few short years. More people will want to use their data and the consumerization of data and technology will continue. As this trend goes, only organization that learn to merge the various disciplines of strategy, analytics and IT, will be successful Data as a Lifestyle
  • 18.
  • 19.
    Search On-sites SensorsRe-marketing Customer Feedback Signals Hub Social Personalization Products Customer Service Digital Marketing In-store Creating Customer Signal Hubs
  • 20.
    Where we areGoing How we organize our data is getting more customized and real-time for real bottom line improvements 0% 5% 10% 15% 20% 25% Vendors Hadoop Customized Customized Realtime Big Data Technology Evolution Personalization Technology Evolution
  • 21.
    How to TakeAdvantage of Data
  • 22.
    data visualization strategy / review technology implementation analytics “The STAVCycle” “gaining insight and telling stories with data” © 2014 STAV Data www.stavdata.com
  • 23.
    Phase Typical Issues Recommended Approach Strategy /Review Define goals / outcomes / expectations in the form of business benefit / customer benefit; form hypotheses / build business case; Evaluate whether expectations for the current cycle were met; identify opportunities for improvement; set expectations for the next cycle Ignored / under-emphasized Increase emphasis Establish formal methodology Build capability Technology Implementation Identify the tools needed to accomplish the business goal; define the technical path for accomplishing the business goal; establish development schedule Over-emphasized Initiated too early Inadequate skill set Decrease emphasis Employ proof-of-concept Use external services Build skill set gradually / incrementally Analysis Analyze the data collected by the IT implementation – find the gems; a function for data scientists or traditional BI – not an IT function; data science = 80% data analysis / data cleaning, 20% algorithm creation Descriptive orientation (business intelligence) Dis-integration of business intelligence / data science Organized in IT function / focus on algorithm creation Adopt predictive orientation (data science) Integrate business intelligence / data science Organize in business function / focus on data analysis and data cleaning Data Visualization Tell the story of the patterns in the data; a function for designers – not data scientists; critical to making the analysis useful from a business perspective Located in IT function / performed by data scientists Focus on methodology vs. results Locate in business function – branding or UX Assign to designers “Making the Impossible Possible” “Big Data is good for solving impossible problems; it just makes simple problems more complex” The STAV Cycle will increase the probability of of success for any organization. Implementation of the cycle includes many more details; it needs to be adjusted to each organization and the goals of each project; but the basic framework doesn’t change. If you use this framework, your big data project will be successful. © 2014 STAV Data www.stavdata.com
  • 24.
    internal / external (medium investment/ medium scope) internal (large investment / broad scope) external (small investment / narrow scope) © 2014 STAV Data www.stavdat a.com Maturity Model / Product Development Life Cycle
  • 25.
    Vision & Goals Governance Execution Clearly articulatedvision for marketing and data use, precisely defined goals with how to measure. Defined scope of the product. Market strategy, customer segmentation, prioritization, org focus, measurement and incentive systems Production process, flexibility at scale, efficiency, relationship management, benchmarking, metrics, initiatives How work gets structured
  • 26.
    Strategy - Define the goals Social Definehow to engage IT Assemble the Technology Analytics Make sense of the Data Linguistics Distributed Processing (Hadoop) Algorithms Development Cross team Customer Experience Improvement Data science is a discipline for making sense of unstructured as well as numerous data sets at scale Develop Your Team
  • 27.
    Listen •Listen to thedata streams Share •Share the data with the rest of the organization Engage •Engage to the data to find the insights Innovate •Innovate new ideas from the insights gained from the data Perform •Perform insightful actions from the data to create better customer experiences Always Remember: Data, Insights, Actions
  • 28.
    Print Radio SEO andPPC Social Predictive Marketing Television You Are Here Human History of Marketing Image credit: www.conducthq.com Using Data for Marketing in the Future Predictive Marketing
  • 29.
    • Extreme machinelearning • Collaborative predictive analytics • Scale-invariant intelligence • Neural networks for machine perception • Real-time interactive big data visualization • Graph all the things • Large scale machine learning cookbooks • Collecting massive data via crowd- sourcing “Without big data analytics, companies are blind and deaf, wandering out onto the web like deer onto a freeway.” Big Data: 2014
  • 30.
    • Personalization everywhere •Company and consumer collaboration in service design • Predictive location based selling • Digital Concierges • Real time event networks • Graph and signal hubs merge for better understanding of ad placement • Large scale channel disruptions • Marketing becomes more analytical Big Data visionaries pose existential threats Predictive Marketing: 2016
  • 31.
    What’s Next: Combiningcontextual and analytical approaches provide a more complete picture of how customers interact with the firm Both approaches privilege observation and understanding what people actually do and look for opportunities to fix, improve and innovate. Robin Beers, founder of Business is Human
  • 32.
    Location Analysis Graph Analysis App andDevice Analysis Customer Feedback Personal Event Networks Social Personalization Digital Concierge Real-time Service Better Ad Performance True Omni Signal hubs will become new centers for data, helping to create better customer insights Predictive Analytics Creating Customer Signal Hubs of the Future
  • 33.
    Although IT canbuild the systems, it will still be left to analyst and marketers of all types to create the actions needed to engage customers How Predictive Marketing is Shaping Up
  • 34.
    Web PDS Email ECC Personal Event Network Appt Scheduler Addto Calendar Confirmation Email Add Confirmation and Appt to PDS Using the digital concierge system, we can create easy to use appointment systems, capturing the data and using it for future personalization efforts Appointment setting with a Digital Concierge
  • 35.
    Image Engaging millions ata time Data Monetization - Keep it - Sell it - Partner with it - Share it Marketing of a Mass Personalized Scale
  • 36.
    Processes are lined,linear chains of cause and effect. A service is different. Processes are designed to be consistent, personalization services are not consistent but individualized and co-created. The differences are not superficial but fundamental. Co-created value requires a relationship Marketing of the Future: Process vs Service
  • 37.
    Marketing as aservice relies on the ability of an organization to learn from customer’s responses and to listen and adapt to those signals. Causes of success are never revenue, costs, profits, etc.., those are lagging indicators or effects. What matters are the activities that generate the profits, activities that create long or short term value. You can measure that via personalization as it is a leading indicator activity if done correctly. Marketing is about Listening and Learning
  • 38.
    An organization’s datais found in its computer systems, but a company’s intelligence is found its biological and social systems --- Valdis Krebs, researcher Linking things changes things: social networks are good at habit building. As behaviors are repeated, they form stronger associations over time. You form strong bongs with people in your life with whom you spend the most time, the same can be said in a social interactive personalization model, customers will form strong bonds with organizations they interact with the most over a given period of time. Small world networks: people banding together to achieve a wide variety of shared objectives. These are the most powerful types of social networks and the way to truly engage customers is to beyond just social network sites and to get into the small world networks as a valuable member of the network. Marketing and Social
  • 39.
    Start small, andremember, everyone else is in the same boat Online Resources What You can do now
  • 40.

Editor's Notes

  • #4 How is big data used? How is it helping?
  • #5 The core of big data
  • #6 Expanding a marketers knowledge of big data, what you need to know.
  • #8 Data ecosystem, what is it, how to understand it.
  • #9 Most of what is needed to make marketing better is still to be explored.
  • #10 Understand how to see your customer online
  • #11 Signals help to make sense of the various types of data so you can use them in new ways.
  • #12 How to understand signals in unstructured is not the same as structured data.
  • #13 Take data, understand it, process it, extract value, visualize, communicate, measure
  • #14 The Action Gap is still a big problem for many companies, understanding the cap will reduce the learning curve
  • #15 A shift from systems and forecasts to activities as our center of design needs to take place. Data alone can’t predict an unpredictable social animal known as the human being Focus on the activities of people, not so much predicting them because we can’t do that good of a job with what we have.
  • #16 The Human Motion Graph is emerging as a new way of understanding customers movements and how they relate to your product or service.
  • #18 Fitbit as an example of data discoverers Data as the new self discovery tool Leads to consumerization of IT IT needs to adapt to be social This means teaming up with marketing and letting marketing joining the conversation with data
  • #19 How is big data used? How is it helping?
  • #20 Signal Hubs are the Future of understanding customers
  • #21 Realtime and customization are the future, faster response times.
  • #23 How to set up your data practice.
  • #24 How is big data used? How is it helping?
  • #25 Different stages of maturing a company goes through.
  • #26 Set up a structure Understand the vision, make it clear Governance: have structure around the tasks Execution: Know how to get it done and why Leadership plays a very important role in defining the vision and goals along with how they wish to see the program governed. Most people don’t understand personalization so having the right structure in place helps to ensure a good foundation for growth.
  • #27 How is big data used? How is it helping?
  • #28 How is big data used? How is it helping?
  • #29 How is big data used? How is it helping?
  • #32 How is big data used? How is it helping?
  • #33 How is big data used? How is it helping?
  • #34 How is big data used? How is it helping?
  • #35 How is big data used? How is it helping?
  • #37 The product is an intermediate step, not an end in itself, even after the customer buys, there is still a relationship after the sale that can take place beyond the product. With a process, this isn’t the case, once the final step is complete, you are done. A process has one customer, the person who receives the final results, a service at its core a relationship between the served and server. At every point of interaction the measure of success is not a product but the satisfaction, delight, or disappointment of the customer. “Most corporate systems were not built with customer delight in mind.” Fred Reighheld, Fellow, Bain and Company
  • #38 Learning organizations evolve with the customer and personalization helps you understand how to evolve. Ritz Carlton, the staff is trained to listen for guest preferences, not always stated in the form of a direct request. The staff is trained to look for intent and then act upon it. This is why the Ritz Carlton’s service is legendary, they have learned how to perfect personalization in the physical space and is a model to follow for Best Buy and can be done with our own personalization efforts. Continuous improvement is natural!
  • #39 Anatomy of a social network: Brokerage: A person or group that connects different clusters together. Closure: Building trust within a cluster, the closer you are the stronger the trust. Betweeness: Critical linking member between other nodes in the cluster. Closeness: How easily a person can make connections Degree: Number of connections Developing a social aspect of personalization requires a high degree of network fluency, situational awareness, influence, compatibility and a fair amount of luck.
  • #40 How is big data used? How is it helping?
  • #41 How is big data used? How is it helping?