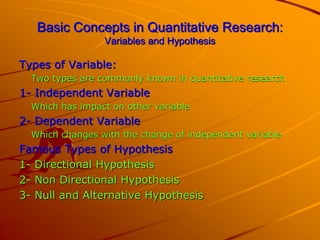
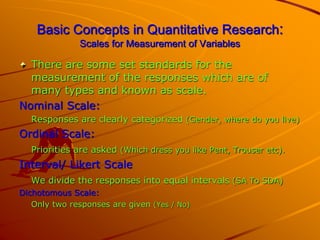
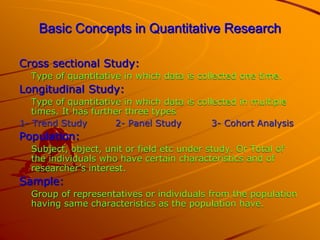
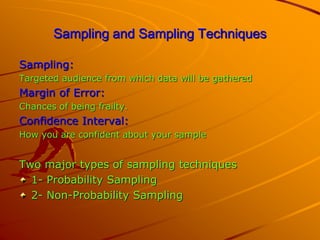
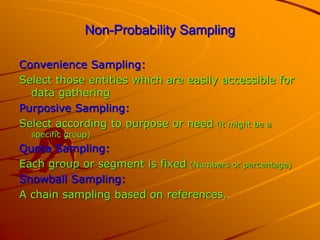
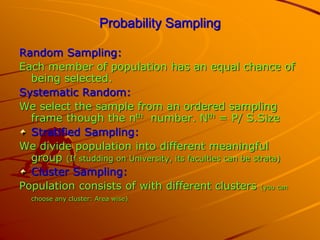
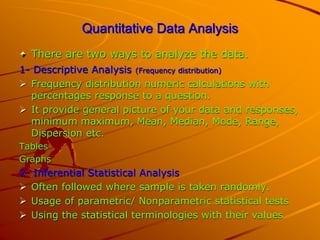
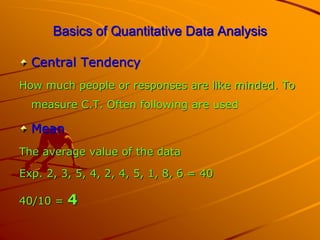
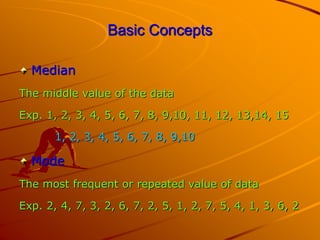
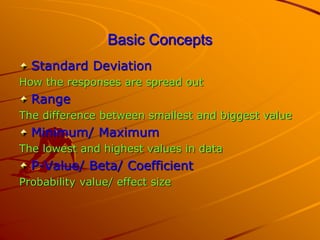
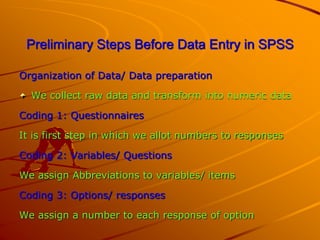
Basic Level Quantitative Data Analysis
Using SPSS
By
Dr. Imran Ghaffar Sulehri
Senior Librarian
Pakistan Institute of Fashion and Design (PIFD)
Email: imran.ghaffar@pifd.edu.pk
Acknowledgement
This presentation has been prepared
using various sources, I acknowledge
all the sources.
Contents to be Covered
What is Quantitative Research
Brief Intro to SPSS
What We Can Do With SPSS
Why Quantitative Research
Basic Concepts in Quantitative Research
Sampling and Sampling Techniques
Quantitative Data Analysis
Basics of Quantitative Data Analysis
Preliminary Steps Before Data Entry in SPSS
Data Entry in SPSS
Tests for Inferential Data Analysis
What is Quantitative Research
Quantitative research methods are
concerned with collecting and analyzing
data numerically
Findings generated from quantitative
research uncover behaviors and trends
Brief Intro to SPSS
Statistical Package for Social Sciences (SPSS)
It was developed by Norman H. Nie and C Hadlai Hull
in 1968 who worked under SPSS Inc.
In 2009 IBM acquired it against $ 1.2 Billion and now
its IBM SPSS (Statistical Product for Service Solutions)
Compatible with Windows, Linux, Unix Mac
A well know and popular software for simple and
highly complex data analysis
What We Can Do With SPSS
Using SPSS we are able to;
Get data related tables
Obtain graphs/ charts
Compare Mean
Perform statistical test for results’ extraction
Factors Analysis (for tool development)
We can manage our data using SPSS
Why Quantitative Research
Best approach to examine the relationship between
two or more variables, explore the cause and effect
To explore differences in variables/ behaviours/ opinion
For theory testing
For predictions
To generalize your results
Basic Concepts in Quantitative Research:
Variables and Hypothesis
Types of Variable:
Two types are commonly known in quantitative research
1- Independent Variable
Which has impact on other variable
2- Dependent Variable
Which changes with the change of independent variable
Famous Types of Hypothesis
1- Directional Hypothesis
2- Non Directional Hypothesis
3- Null and Alternative Hypothesis
Basic Concepts in Quantitative Research:
Scales for Measurement of Variables
There are some set standards for the
measurement of the responses which are of
many types and known as scale.
Nominal Scale:
Responses are clearly categorized (Gender, where do you live)
Ordinal Scale:
Priorities are asked (Which dress you like Pent, Trouser etc).
Interval/ Likert Scale
We divide the responses into equal intervals (SA To SDA)
Dichotomous Scale:
Only two responses are given (Yes / No)
Basic Concepts in Quantitative Research
Cross sectional Study:
Type of quantitative in which data is collected one time.
Longitudinal Study:
Type of quantitative in which data is collected in multiple
times. It has further three types
1- Trend Study 2- Panel Study 3- Cohort Analysis
Population:
Subject, object, unit or field etc under study. Or Total of
the individuals who have certain characteristics and of
researcher’s interest.
Sample:
Group of representatives or individuals from the population
having same characteristics as the population have.
Sampling and Sampling Techniques
Sampling:
Targeted audience from which data will be gathered
Margin of Error:
Chances of being frailty.
Confidence Interval:
How you are confident about your sample
Two major types of sampling techniques
1- Probability Sampling
2- Non-Probability Sampling
Non-Probability Sampling
Convenience Sampling:
Select those entities which are easily accessible for
data gathering
Purposive Sampling:
Select according to purpose or need (it might be a
specific group)
Quota Sampling:
Each group or segment is fixed (Numbers or percentage)
Snowball Sampling:
A chain sampling based on references.
Probability Sampling
Random Sampling:
Each member of population has an equal chance of
being selected.
Systematic Random:
We select the sample from an ordered sampling
frame though the nth number. Nth = P/ S.Size
Stratified Sampling:
We divide population into different meaningful
group (If studding on University, its faculties can be strata)
Cluster Sampling:
Population consists of with different clusters (you can
choose any cluster: Area wise)
Quantitative Data Analysis
There are two ways to analyze the data.
1- Descriptive Analysis (Frequency distribution)
 Frequency distribution numeric calculations with
percentages response to a question.
 It provide general picture of your data and responses,
minimum maximum, Mean, Median, Mode, Range,
Dispersion etc.
Tables
Graphs
2- Inferential Statistical Analysis
 Often followed where sample is taken randomly.
 Usage of parametric/ Nonparametric statistical tests
 Using the statistical terminologies with their values
Basics of Quantitative Data Analysis
Central Tendency
How much people or responses are like minded. To
measure C.T. Often following are used
Mean
The average value of the data
Exp. 2, 3, 5, 4, 2, 4, 5, 1, 8, 6 = 40
40/10 = 4
Basic Concepts
Median
The middle value of the data
Exp. 1, 2, 3, 4, 5, 6, 7, 8, 9,10, 11, 12, 13,14, 15
1, 2, 3, 4, 5, 6, 7, 8, 9,10
Mode
The most frequent or repeated value of data
Exp. 2, 4, 7, 3, 2, 6, 7, 2, 5, 1, 2, 7, 5, 4, 1, 3, 6, 2
Basic Concepts
Standard Deviation
How the responses are spread out
Range
The difference between smallest and biggest value
Minimum/ Maximum
The lowest and highest values in data
P-Value/ Beta/ Coefficient
Probability value/ effect size
Preliminary Steps Before Data Entry in SPSS
Organization of Data/ Data preparation
We collect raw data and transform into numeric data
Coding 1: Questionnaires
It is first step in which we allot numbers to responses
Coding 2: Variables/ Questions
We assign Abbreviations to variables/ items
Coding 3: Options/ responses
We assign a number to each response of option
Data Entry in SPSS
There are two ways of entering data into SPSS
1- Direct Entry
 Open SPSS software and manually enter your
data (It is recommended to get help of a person while
entering data).
 Give each item (variable) a valid name as per
code (No space, any punctuation mark).
 Each variable name must be unique.
 Always remember, First Row for Variable and
Second for Responses.
2- Export/ Copy Data
You can copy and paste data from an excel sheet
Data Cleaning and Identification of Missing
Values Before Getting Results
Before to operationalize your variables for
results, It is strongly recommended to check the
normality of your data.
To check data, check Frequencies of each item
(variable).
Manage the missing or incorrect data.
Then, Obtain results by operationalizing the
required type of statistics.
Tests for Inferential Data Analysis
Reliability Test
To check the reliability of scale, Cronbach's alpha
needed >.7
One Sample T-Test
To compare a single sample with a threshold value
Independent Samples T-Test
To compare Mean score of two samples (Differences)
Paired Samples T-Test
For pre and post analysis
Tests for Inferential Data Analysis
ANOVA
To see differences in Mean Scores of more than two
samples
Correlations
To explore relationship between constructs
Effect/ Impact
Where hypothesis are developed/ Cause and effect
Mediation/ Moderation
To see indirect influences of intervening variables
Thanks
???
Practical Session
Let’s explore SPSS practically for data
entry and Basic Analysis

Basic Level Quantitative Analysis Using SPSS.ppt

  • 1.
    Basic Level QuantitativeData Analysis Using SPSS By Dr. Imran Ghaffar Sulehri Senior Librarian Pakistan Institute of Fashion and Design (PIFD) Email: imran.ghaffar@pifd.edu.pk
  • 2.
    Acknowledgement This presentation hasbeen prepared using various sources, I acknowledge all the sources.
  • 3.
    Contents to beCovered What is Quantitative Research Brief Intro to SPSS What We Can Do With SPSS Why Quantitative Research Basic Concepts in Quantitative Research Sampling and Sampling Techniques Quantitative Data Analysis Basics of Quantitative Data Analysis Preliminary Steps Before Data Entry in SPSS Data Entry in SPSS Tests for Inferential Data Analysis
  • 4.
    What is QuantitativeResearch Quantitative research methods are concerned with collecting and analyzing data numerically Findings generated from quantitative research uncover behaviors and trends
  • 5.
    Brief Intro toSPSS Statistical Package for Social Sciences (SPSS) It was developed by Norman H. Nie and C Hadlai Hull in 1968 who worked under SPSS Inc. In 2009 IBM acquired it against $ 1.2 Billion and now its IBM SPSS (Statistical Product for Service Solutions) Compatible with Windows, Linux, Unix Mac A well know and popular software for simple and highly complex data analysis
  • 6.
    What We CanDo With SPSS Using SPSS we are able to; Get data related tables Obtain graphs/ charts Compare Mean Perform statistical test for results’ extraction Factors Analysis (for tool development) We can manage our data using SPSS
  • 7.
    Why Quantitative Research Bestapproach to examine the relationship between two or more variables, explore the cause and effect To explore differences in variables/ behaviours/ opinion For theory testing For predictions To generalize your results
  • 8.
    Basic Concepts inQuantitative Research: Variables and Hypothesis Types of Variable: Two types are commonly known in quantitative research 1- Independent Variable Which has impact on other variable 2- Dependent Variable Which changes with the change of independent variable Famous Types of Hypothesis 1- Directional Hypothesis 2- Non Directional Hypothesis 3- Null and Alternative Hypothesis
  • 9.
    Basic Concepts inQuantitative Research: Scales for Measurement of Variables There are some set standards for the measurement of the responses which are of many types and known as scale. Nominal Scale: Responses are clearly categorized (Gender, where do you live) Ordinal Scale: Priorities are asked (Which dress you like Pent, Trouser etc). Interval/ Likert Scale We divide the responses into equal intervals (SA To SDA) Dichotomous Scale: Only two responses are given (Yes / No)
  • 10.
    Basic Concepts inQuantitative Research Cross sectional Study: Type of quantitative in which data is collected one time. Longitudinal Study: Type of quantitative in which data is collected in multiple times. It has further three types 1- Trend Study 2- Panel Study 3- Cohort Analysis Population: Subject, object, unit or field etc under study. Or Total of the individuals who have certain characteristics and of researcher’s interest. Sample: Group of representatives or individuals from the population having same characteristics as the population have.
  • 11.
    Sampling and SamplingTechniques Sampling: Targeted audience from which data will be gathered Margin of Error: Chances of being frailty. Confidence Interval: How you are confident about your sample Two major types of sampling techniques 1- Probability Sampling 2- Non-Probability Sampling
  • 12.
    Non-Probability Sampling Convenience Sampling: Selectthose entities which are easily accessible for data gathering Purposive Sampling: Select according to purpose or need (it might be a specific group) Quota Sampling: Each group or segment is fixed (Numbers or percentage) Snowball Sampling: A chain sampling based on references.
  • 13.
    Probability Sampling Random Sampling: Eachmember of population has an equal chance of being selected. Systematic Random: We select the sample from an ordered sampling frame though the nth number. Nth = P/ S.Size Stratified Sampling: We divide population into different meaningful group (If studding on University, its faculties can be strata) Cluster Sampling: Population consists of with different clusters (you can choose any cluster: Area wise)
  • 14.
    Quantitative Data Analysis Thereare two ways to analyze the data. 1- Descriptive Analysis (Frequency distribution)  Frequency distribution numeric calculations with percentages response to a question.  It provide general picture of your data and responses, minimum maximum, Mean, Median, Mode, Range, Dispersion etc. Tables Graphs 2- Inferential Statistical Analysis  Often followed where sample is taken randomly.  Usage of parametric/ Nonparametric statistical tests  Using the statistical terminologies with their values
  • 15.
    Basics of QuantitativeData Analysis Central Tendency How much people or responses are like minded. To measure C.T. Often following are used Mean The average value of the data Exp. 2, 3, 5, 4, 2, 4, 5, 1, 8, 6 = 40 40/10 = 4
  • 16.
    Basic Concepts Median The middlevalue of the data Exp. 1, 2, 3, 4, 5, 6, 7, 8, 9,10, 11, 12, 13,14, 15 1, 2, 3, 4, 5, 6, 7, 8, 9,10 Mode The most frequent or repeated value of data Exp. 2, 4, 7, 3, 2, 6, 7, 2, 5, 1, 2, 7, 5, 4, 1, 3, 6, 2
  • 17.
    Basic Concepts Standard Deviation Howthe responses are spread out Range The difference between smallest and biggest value Minimum/ Maximum The lowest and highest values in data P-Value/ Beta/ Coefficient Probability value/ effect size
  • 18.
    Preliminary Steps BeforeData Entry in SPSS Organization of Data/ Data preparation We collect raw data and transform into numeric data Coding 1: Questionnaires It is first step in which we allot numbers to responses Coding 2: Variables/ Questions We assign Abbreviations to variables/ items Coding 3: Options/ responses We assign a number to each response of option
  • 19.
    Data Entry inSPSS There are two ways of entering data into SPSS 1- Direct Entry  Open SPSS software and manually enter your data (It is recommended to get help of a person while entering data).  Give each item (variable) a valid name as per code (No space, any punctuation mark).  Each variable name must be unique.  Always remember, First Row for Variable and Second for Responses. 2- Export/ Copy Data You can copy and paste data from an excel sheet
  • 20.
    Data Cleaning andIdentification of Missing Values Before Getting Results Before to operationalize your variables for results, It is strongly recommended to check the normality of your data. To check data, check Frequencies of each item (variable). Manage the missing or incorrect data. Then, Obtain results by operationalizing the required type of statistics.
  • 21.
    Tests for InferentialData Analysis Reliability Test To check the reliability of scale, Cronbach's alpha needed >.7 One Sample T-Test To compare a single sample with a threshold value Independent Samples T-Test To compare Mean score of two samples (Differences) Paired Samples T-Test For pre and post analysis
  • 22.
    Tests for InferentialData Analysis ANOVA To see differences in Mean Scores of more than two samples Correlations To explore relationship between constructs Effect/ Impact Where hypothesis are developed/ Cause and effect Mediation/ Moderation To see indirect influences of intervening variables
  • 23.
  • 24.
    Practical Session Let’s exploreSPSS practically for data entry and Basic Analysis