The document discusses various concepts in data mining and decision trees including:
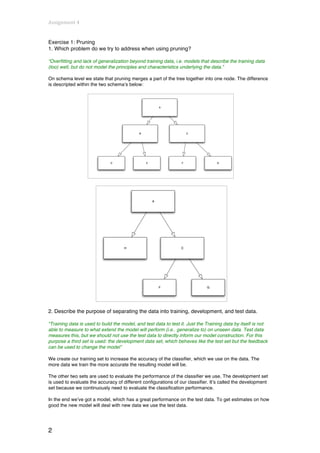
1) Pruning trees to address overfitting and improve generalization,
2) Separating data into training, development and test sets to evaluate model performance,
3) Information gain favoring attributes with many values by having less entropy,
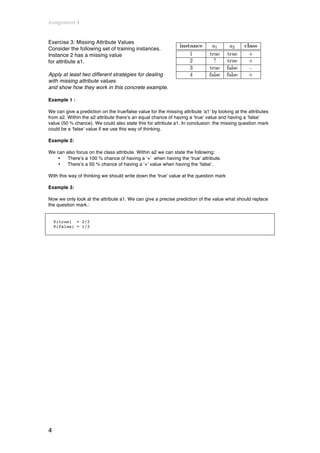
4) Strategies for dealing with missing attribute values such as predicting values or focusing on other attributes/classes,
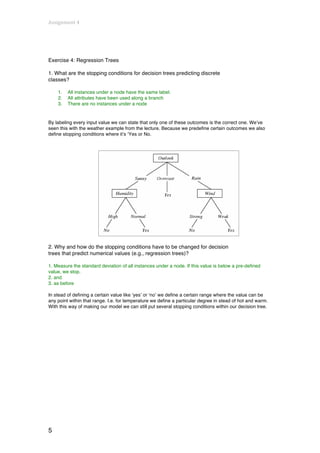
5) Changing stopping conditions for regression trees to use standard deviation thresholds rather than discrete classes.
Think Like Scilab and Become a Numerical Programming Expert- Notes for Beginn...ssuserd6b1fd
Notes for Scilab Programming. This notes includes the mathematics used behind scilab numerical programming. Illustrated with suitable graphics and examples. Each function is explained well with complete example. Helpful to beginners. GUI programming is also explained.
I am Ben R. I am a Statistics Assignment Expert at statisticshomeworkhelper.com. I hold a Ph.D. in Statistics, from University of Denver, USA. I have been helping students with their homework for the past 5 years. I solve assignments related to Statistics.
Visit statisticshomeworkhelper.com or email info@statisticshomeworkhelper.com.
You can also call on +1 678 648 4277 for any assistance with Statistics Assignments.
Decreasing and increasing functions by arun umraossuserd6b1fd
Function analysis - characteristics of increasing and decreasing functions. How "sign" either positive or negative tells about the nature of the function, i.e. where it is increasing and where it is decreasing.
At the end of this lecture students should be able to;
Describe the C arrays.
Practice the declaration, initialization and access linear arrays.
Practice the declaration, initialization and access two dimensional arrays.
Apply taught concepts for writing programs.
**** Java Certification Training: https://www.edureka.co/java-j2ee-soa-training ****
This Edureka tutorial on “Arrays in Java” will talk about one of the pillars of Java fundamentals i.e Arrays. It will also take you through the various types of arrays in Java and how they are used to achieve various functionalities. Through this tutorial, you will learn the following topics:
1. Arrays in Java
2. Types of Arrays
3. Working with Arrays
4. Sorting in Arrays
5. Searching in Arrays
Check out our Java Tutorial blog series: https://goo.gl/osrGrS
Check out our complete Youtube playlist here: https://goo.gl/gMFLx3
Follow us to never miss an update in the future.
Instagram: https://www.instagram.com/edureka_learning/
Facebook: https://www.facebook.com/edurekaIN/
Twitter: https://twitter.com/edurekain
LinkedIn: https://www.linkedin.com/company/edureka
Principle of Definite Integra - Integral Calculus - by Arun Umraossuserd6b1fd
Definite integral notes. Best for quick preparation. Easy to understand and colored graphics. Step by step description. Suitable for CBSE board and State Board students in Class XI & XII
Limit & Continuity of Functions - Differential Calculus by Arun Umraossuserd6b1fd
This books explains about limits and continuity and is base for derivative calculus. Suitable for CBSE Class XII students who are preparing for IIT JEE.
Principle of Function Analysis - by Arun Umraossuserd6b1fd
This note explains about functions, type of function, their behaviour, conversion and derivation. This note is best for those who are going to study calculus or phys
Principle of Integration - Basic Introduction - by Arun Umraossuserd6b1fd
Notes for integral calculus. Students must read function analysis before going through this book. Read Derivative Calculus before going through this book.
Со времён С++98 стандартные контейнеры и идиома RAII позволяли избегать использования оператора delete,
что делало код более безопасным. С приходом С++11 и умных указателей отпала необходимость использовать оператор new, что позволило практически полностью переложить управление памятью на плечи компилятора. В
докладе объясняется идеология управления памятью и ресурсами в современном С++.
Calculus Application Problem #3 Name _________________________.docxhumphrieskalyn
Calculus Application Problem #3 Name __________________________________________
The Deriving Dead! Due at the beginning of class ______________________
Introduction: Imagine that you are one of many people at a “party” and that, unknown to everyone else, one
person was bitten by a zombie on the way to the party! How quickly will the “zombiepocalypse” spread, and
what are the chances that you will leave the party as a zombie? The objective of this activity is to create a
mathematical model that describes the spread of a disease (such as a zombie virus) in a closed environment, and
then apply calculus concepts to this mathematical model.
Collecting the Data:
Let’s collect some data from an activity that will simulate the spread of a communicable disease over a period of
time, divided into “stages”.
The number of people in our “closed environment” is ________________
1
1
131211109876543210
Number
of Total
Infected
Number
of Newly
Infected
Stage
Number
Applying Calculus to the Data:
1. Using the data from the chart, make a scatterplot of the "Stage Number" (in L1) vs. the "Number of Total
Infected" (in L2). Sketch the scatterplot below. Connect the data points to create a continuous function for Y(t).
2. Using the data that was collected in the activity, answer the following questions about the derivative
function Y’(t), which represents the instantaneous rate of change of the number of infected at any stage.
Consider the domain to be [ 0 , 13 ].
a. When, if ever, is Y’(t) positive? ____________________________________
b. When, if ever, is Y’(t) negative? ___________________________________
c. When, if ever, is Y’(t) increasing? ____________________________________
d. When, if ever, is Y’(t) decreasing? ____________________________________
e. From your answers above, sketch a graph of Y’(t) below.
f. The t-value where Y’(t) changes from increasing to decreasing is the inflection point on Y(t).
According to the data in the chart, this occurs when t = _________, and the corresonding “y-value”
is ________.
(Note: We will check this later in the problem!)
Finding a Logistic Function that Models the Data
3. Since the data (should) appear to be a model for a logistic function, we need to find a function in the
form:
Y(t ) =
c
1 + a ⋅ e− b⋅t
,
where t represents the stage number and Y(t) represents the total number of infected people in stage t.
Therefore, we need to find values for the three constants a, b, and c. The value of c should be easy. For our
activity,
c = _________
To find a, use the initial point ( 0 , 1 ). Substitute this ordered pair, with the value of c into our logistic model and
solve for a. Show your work below.
a = _______________
To find b, the last constant in the model, we need another ordered pair. Let’s use an ordered pair near the middle
of the data, say during Stage #7.
Record this ordered pair: ( 7 , _________)
Substitut ...
BUS 308 Week 4 Lecture 3 Developing Relationships in Exc.docxShiraPrater50
BUS 308 Week 4 Lecture 3
Developing Relationships in Excel
Expected Outcomes
After reading this lecture, the student should be able to:
1. Calculate the t-value for a correlation coefficient
2. Calculate the minimum statistically significant correlation coefficient value.
3. Set-up and interpret a Linear Regression in Excel
4. Set-up and interpret a Multiple Regression in Excel
Overview
Setting up correlations and regressions in Excel is fairly straightforward and follows the
approaches we have seen with our previous tools. This involves setting up the data input table,
selecting the tools, and inputting information into the appropriate parts of the input window.
Correlations
Question 1
Data set-up for a correlation is perhaps the simplest of any we have seen. It involves
simply copying and pasting the variables from the Data tab to the Week 4 worksheet. Again,
paste them to the right of the question area. The screenshot below has the data for both the
question 1 correlation and the question 2 multiple regression pasted them starting at column V.
You can paste all the data at once or add the multiple regression variables later (as long as you
do not sort the original data).
Specifically, for Question 1, copy the salary data to column V (for example). Then copy
the Midpoint thru Service columns and paste them next to salary. Finally copy the Raise column
and paste it next to the service column. Notice that our data input range for this question now
includes Salary in Column V and the other interval level variables found in Columns W thru AA.
Question 1 asks for the correlation among the interval/ratio level variables with salary
and says to exclude compa-ratio. For our example, we will correlation compa-ratio with the
other interval/ratio level variables with the exclusion of salary. Since compa-ratio equals the
salary divided by the midpoint, it does not seem reasonable to use salary in predicting compa-
ratio or compa-ratio in predicting salary.
Pearson correlations can be performed in two ways within Excel. If we have a single pair
of variables we are interested in, for example compa-ratio and performance rating, we could use
the fx (or Formulas) function CORREL(array1, array2) (note array means the same as range) to
give us the correlation.
However, if we have several variables we want to correlate at the same time, it is more
effective to use the Correlation function found in the Analysis ToolPak in the Data Analysis tab.
Set up of the input data for Correlation is simple. Just ensure that all of the variables to be
correlated are listed together, and only include interval or ratio level data. For our data set, this
would mean we cannot include gender or degree; even though they look like numerical data the 0
and 1 are merely labels as far as correlation is concerned.
In the Correlation data input box shown below, list the entire data range, indicate if your
dat ...
Computerassignment 2 of the course Data mining. This assisgnment is about using the program weka on an external database and showing the decision tree.
Semantic web final assignment, We've used Sqvizler to build our own semantic web application. The application prototype was used to show the possibilites of finding all popular spots in the region of a university. The data which is used for this application comes from several datasources; respectively dbpedia.org, linkedgeodata.org and a local database with university information.
The French Revolution, which began in 1789, was a period of radical social and political upheaval in France. It marked the decline of absolute monarchies, the rise of secular and democratic republics, and the eventual rise of Napoleon Bonaparte. This revolutionary period is crucial in understanding the transition from feudalism to modernity in Europe.
For more information, visit-www.vavaclasses.com
A Strategic Approach: GenAI in EducationPeter Windle
Artificial Intelligence (AI) technologies such as Generative AI, Image Generators and Large Language Models have had a dramatic impact on teaching, learning and assessment over the past 18 months. The most immediate threat AI posed was to Academic Integrity with Higher Education Institutes (HEIs) focusing their efforts on combating the use of GenAI in assessment. Guidelines were developed for staff and students, policies put in place too. Innovative educators have forged paths in the use of Generative AI for teaching, learning and assessments leading to pockets of transformation springing up across HEIs, often with little or no top-down guidance, support or direction.
This Gasta posits a strategic approach to integrating AI into HEIs to prepare staff, students and the curriculum for an evolving world and workplace. We will highlight the advantages of working with these technologies beyond the realm of teaching, learning and assessment by considering prompt engineering skills, industry impact, curriculum changes, and the need for staff upskilling. In contrast, not engaging strategically with Generative AI poses risks, including falling behind peers, missed opportunities and failing to ensure our graduates remain employable. The rapid evolution of AI technologies necessitates a proactive and strategic approach if we are to remain relevant.
Model Attribute Check Company Auto PropertyCeline George
In Odoo, the multi-company feature allows you to manage multiple companies within a single Odoo database instance. Each company can have its own configurations while still sharing common resources such as products, customers, and suppliers.
Acetabularia Information For Class 9 .docxvaibhavrinwa19
Acetabularia acetabulum is a single-celled green alga that in its vegetative state is morphologically differentiated into a basal rhizoid and an axially elongated stalk, which bears whorls of branching hairs. The single diploid nucleus resides in the rhizoid.
Embracing GenAI - A Strategic ImperativePeter Windle
Artificial Intelligence (AI) technologies such as Generative AI, Image Generators and Large Language Models have had a dramatic impact on teaching, learning and assessment over the past 18 months. The most immediate threat AI posed was to Academic Integrity with Higher Education Institutes (HEIs) focusing their efforts on combating the use of GenAI in assessment. Guidelines were developed for staff and students, policies put in place too. Innovative educators have forged paths in the use of Generative AI for teaching, learning and assessments leading to pockets of transformation springing up across HEIs, often with little or no top-down guidance, support or direction.
This Gasta posits a strategic approach to integrating AI into HEIs to prepare staff, students and the curriculum for an evolving world and workplace. We will highlight the advantages of working with these technologies beyond the realm of teaching, learning and assessment by considering prompt engineering skills, industry impact, curriculum changes, and the need for staff upskilling. In contrast, not engaging strategically with Generative AI poses risks, including falling behind peers, missed opportunities and failing to ensure our graduates remain employable. The rapid evolution of AI technologies necessitates a proactive and strategic approach if we are to remain relevant.
Francesca Gottschalk - How can education support child empowerment.pptxEduSkills OECD
Francesca Gottschalk from the OECD’s Centre for Educational Research and Innovation presents at the Ask an Expert Webinar: How can education support child empowerment?
June 3, 2024 Anti-Semitism Letter Sent to MIT President Kornbluth and MIT Cor...Levi Shapiro
Letter from the Congress of the United States regarding Anti-Semitism sent June 3rd to MIT President Sally Kornbluth, MIT Corp Chair, Mark Gorenberg
Dear Dr. Kornbluth and Mr. Gorenberg,
The US House of Representatives is deeply concerned by ongoing and pervasive acts of antisemitic
harassment and intimidation at the Massachusetts Institute of Technology (MIT). Failing to act decisively to ensure a safe learning environment for all students would be a grave dereliction of your responsibilities as President of MIT and Chair of the MIT Corporation.
This Congress will not stand idly by and allow an environment hostile to Jewish students to persist. The House believes that your institution is in violation of Title VI of the Civil Rights Act, and the inability or
unwillingness to rectify this violation through action requires accountability.
Postsecondary education is a unique opportunity for students to learn and have their ideas and beliefs challenged. However, universities receiving hundreds of millions of federal funds annually have denied
students that opportunity and have been hijacked to become venues for the promotion of terrorism, antisemitic harassment and intimidation, unlawful encampments, and in some cases, assaults and riots.
The House of Representatives will not countenance the use of federal funds to indoctrinate students into hateful, antisemitic, anti-American supporters of terrorism. Investigations into campus antisemitism by the Committee on Education and the Workforce and the Committee on Ways and Means have been expanded into a Congress-wide probe across all relevant jurisdictions to address this national crisis. The undersigned Committees will conduct oversight into the use of federal funds at MIT and its learning environment under authorities granted to each Committee.
• The Committee on Education and the Workforce has been investigating your institution since December 7, 2023. The Committee has broad jurisdiction over postsecondary education, including its compliance with Title VI of the Civil Rights Act, campus safety concerns over disruptions to the learning environment, and the awarding of federal student aid under the Higher Education Act.
• The Committee on Oversight and Accountability is investigating the sources of funding and other support flowing to groups espousing pro-Hamas propaganda and engaged in antisemitic harassment and intimidation of students. The Committee on Oversight and Accountability is the principal oversight committee of the US House of Representatives and has broad authority to investigate “any matter” at “any time” under House Rule X.
• The Committee on Ways and Means has been investigating several universities since November 15, 2023, when the Committee held a hearing entitled From Ivory Towers to Dark Corners: Investigating the Nexus Between Antisemitism, Tax-Exempt Universities, and Terror Financing. The Committee followed the hearing with letters to those institutions on January 10, 202
The Roman Empire A Historical Colossus.pdfkaushalkr1407
The Roman Empire, a vast and enduring power, stands as one of history's most remarkable civilizations, leaving an indelible imprint on the world. It emerged from the Roman Republic, transitioning into an imperial powerhouse under the leadership of Augustus Caesar in 27 BCE. This transformation marked the beginning of an era defined by unprecedented territorial expansion, architectural marvels, and profound cultural influence.
The empire's roots lie in the city of Rome, founded, according to legend, by Romulus in 753 BCE. Over centuries, Rome evolved from a small settlement to a formidable republic, characterized by a complex political system with elected officials and checks on power. However, internal strife, class conflicts, and military ambitions paved the way for the end of the Republic. Julius Caesar’s dictatorship and subsequent assassination in 44 BCE created a power vacuum, leading to a civil war. Octavian, later Augustus, emerged victorious, heralding the Roman Empire’s birth.
Under Augustus, the empire experienced the Pax Romana, a 200-year period of relative peace and stability. Augustus reformed the military, established efficient administrative systems, and initiated grand construction projects. The empire's borders expanded, encompassing territories from Britain to Egypt and from Spain to the Euphrates. Roman legions, renowned for their discipline and engineering prowess, secured and maintained these vast territories, building roads, fortifications, and cities that facilitated control and integration.
The Roman Empire’s society was hierarchical, with a rigid class system. At the top were the patricians, wealthy elites who held significant political power. Below them were the plebeians, free citizens with limited political influence, and the vast numbers of slaves who formed the backbone of the economy. The family unit was central, governed by the paterfamilias, the male head who held absolute authority.
Culturally, the Romans were eclectic, absorbing and adapting elements from the civilizations they encountered, particularly the Greeks. Roman art, literature, and philosophy reflected this synthesis, creating a rich cultural tapestry. Latin, the Roman language, became the lingua franca of the Western world, influencing numerous modern languages.
Roman architecture and engineering achievements were monumental. They perfected the arch, vault, and dome, constructing enduring structures like the Colosseum, Pantheon, and aqueducts. These engineering marvels not only showcased Roman ingenuity but also served practical purposes, from public entertainment to water supply.
Palestine last event orientationfvgnh .pptxRaedMohamed3
An EFL lesson about the current events in Palestine. It is intended to be for intermediate students who wish to increase their listening skills through a short lesson in power point.
2. Assignment
4
Exercise 1: Pruning
1. Which problem do we try to address when using pruning?
“Overfitting and lack of generalization beyond training data, i.e. models that describe the training data
(too) well, but do not model the principles and characteristics underlying the data.”
On schema level we state that pruning merges a part of the tree together into one node. The difference
is descripted within the two schema’s below:
2. Describe the purpose of separating the data into training, development, and test data.
“Training data is used to build the model, and test data to test it. Just the Training data by itself is not
able to measure to what extend the model will perform (i.e.. generalize to) on unseen data. Test data
measures this, but we should not use the test data to directly inform our model construction. For this
purpose a third set is used: the development data set, which behaves like the test set but the feedback
can be used to change the model”
We create our training set to increase the accuracy of the classifier, which we use on the data. The
more data we train the more accurate the resulting model will be.
The other two sets are used to evaluate the performance of the classifier we use. The development set
is used to evaluate the accuracy of different configurations of our classifier. It’s called the development
set because we continuously need to evaluate the classification performance.
In the end we’ve got a model, which has a great performance on the test data. To get estimates on how
good the new model will deal with new data we use the test data.
2
3. Assignment
4
Exercise 2: Information Gain and Attributes with Many Values.
Information gain is defined as:
Following to this definition, information gain
favors attributes with many values.
Why? Give an example.
We use a training set with (as shown in the table):
• N number of instances
• A number of attributes
A1 … Ak A* class
1 T … Black V1 C1
2 T … White V2 C2
.. .. … … … …
n F … Black Vn Cn
If we want to classify a certain attribute we can state that we have a 50/50 chance of having a ‘-‘ and a
‘+’ classification. So Attribute A* could be a plus or a minus. We note this as follows.
[1+, 0-]
SVi (A*) = {
[0+, 1-]
We can calculate the Entropy (uncertainty) of both outcomes of a plus or minus classification:
H(S+) = - (1/1 log2 1/1 + 0/1 log2 0/1) = 0
H(S-) = - (0/1 log2 0/1 + 1/1 log2 1/1) = 0
For calculating our information gain we perform the following formula:
Gain(S, A*) = H(S) – (sum |Sv(A*)| / |S| * H(Sv(A*) )
Gain(S, A*) = Entropy of H(S) – (gain of H(S+) + gain of H(S-))
Gain(S, A*) = Entropy of H(S) – (0 + 0)
Gain(S, A*) = Entropy of H(S)
We see that the Entropy of H(S+) and H(S-) is 0. So in the end we will have a high information gain because there’s
nothing to deduct.
3
4. Assignment
4
Exercise 3: Missing Attribute Values
Consider the following set of training instances.
Instance 2 has a missing value
for attribute a1.
Apply at least two different strategies for dealing
with missing attribute values
and show how they work in this concrete example.
Example 1 :
We can give a prediction on the true/false value for the missing attribute ‘a1’ by looking at the attributes
from a2. Within the a2 attribute there’s an equal chance of having a ‘true’ value and having a ‘false’
value (50 % chance). We could also state this for attribute a1. In conclusion: the missing question mark
could be a ‘false’ value if we use this way of thinking.
Example 2:
We can also focus on the class attribute. Within a2 we can state the following:
• There’s a 100 % chance of having a ‘+’ when having the ‘true’ attribute.
• There’s a 50 % chance of having a ‘+’ value when having the ‘false’.
With this way of thinking we should write down the ‘true’ value at the question mark
Example 3:
Now we only look at the attribute a1. We can give a precise prediction of the value what should replace
the question mark.:
P(true) = 2/3
P(false) = 1/3
4
5. Assignment
4
Exercise 4: Regression Trees
1. What are the stopping conditions for decision trees predicting discrete
classes?
1. All instances under a node have the same label.
2. All attributes have been used along a branch
3. There are no instances under a node
By labeling every input value we can state that only one of these outcomes is the correct one. We’ve
seen this with the weather example from the lecture. Because we predefine certain outcomes we also
define stopping conditions where it’s ‘Yes or No.
2. Why and how do the stopping conditions have to be changed for decision
trees that predict numerical values (e.g., regression trees)?
1. Measure the standard deviation of all instances under a node. If this value is below a pre-defined
value, we stop.
2. and
3. as before
In stead of defining a certain value like ‘yes’ or ‘no’ we define a certain range where the value can be
any point within that range. I.e. for temperature we define a particular degree in stead of hot and warm.
With this way of making our model we can still put several stopping conditions within our decision tree.
5