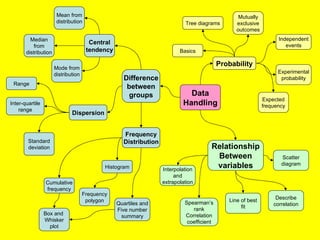
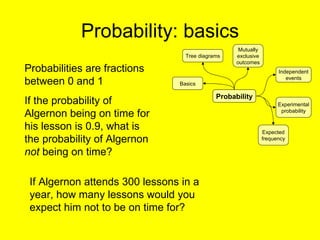
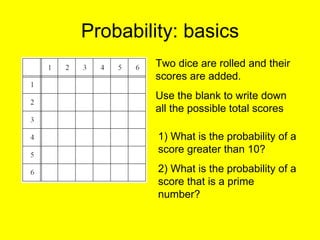
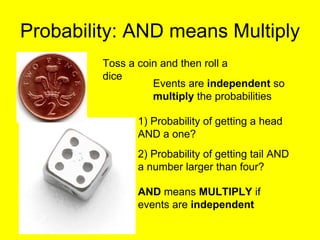
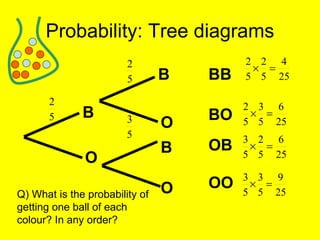
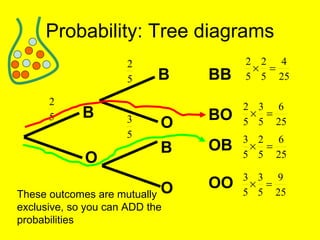
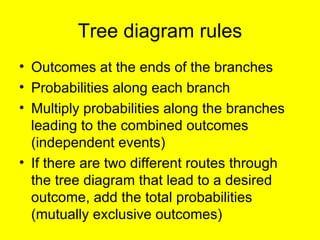
Data Handling Module Introduction and first topic: probability
“ To understand God's thoughts we must study statistics, for these are the measure of His purpose”   “ How very little can be done under the spirit of fear”
www.statistics.gov.uk
Live births in England and Wales, FM1 number 36,  stat istics.gov.uk
Data Handling Probability Relationship Between variables Dispersion Tree diagrams Mutually exclusive outcomes Independent events Experimental probability Basics Expected frequency Scatter diagram Line of best fit Interpolation and extrapolation Describe correlation Spearman’s rank Correlation coefficient Central tendency Frequency Distribution Range Standard deviation Box and  Whisker plot Cumulative frequency Quartiles and Five number summary Mode from distribution Difference between groups Median from distribution Inter-quartile range Mean from distribution Histogram Frequency polygon
Probability: basics Probability Tree diagrams Mutually exclusive outcomes Independent events Experimental probability Basics Expected frequency Probabilities are fractions between 0 and 1 If the probability of Algernon being on time for his lesson is 0.9, what is the probability of Algernon  not  being on time? If Algernon attends 300 lessons in a year, how many lessons would you expect him not to be on time for?
Probability: basics Two dice are rolled and their scores are added. Use the blank to write down all the possible total scores 1) What is the probability of a score greater than 10? 2) What is the probability of a score that is a prime number?
Probability: AND means Multiply Toss a coin and then roll a dice Events are  independent  so  multiply  the probabilities 1) Probability of getting a head AND a one? AND  means  MULTIPLY  if events are  independent 2) Probability of getting tail AND a number larger than four?
Probability: OR means ADD 1) How many balls? 2) Probability of picking an orange ball? 3) Probability of picking a blue ball? Blue ball  OR  orange ball,  OR  yellow ball called  mutually exclusive  outcomes: probabilities must  add  to one
Probability: Combined probability Suppose that you picked a ball from the bag (notice only two colours now), noted the colour, then  replaced  the ball and picked another one and noted the colour of the second ball. There are four possible outcomes… BB, OO, BO, OB But these outcomes are NOT equally likely!
Probability: Tree diagrams B O B B O O BO BB OB OO 1 st  pick 2 nd  pick
Probability: Tree diagrams B O B B O O 1 st  pick 2 nd  pick BO BB OB OO Each combined outcome has a different probability associated with it
Probability: Tree diagrams B O B B O O BO BB OB OO Q) What is the probability of getting one ball of each colour? In any order?
Probability: Tree diagrams B O B B O O BO BB OB OO These outcomes are mutually exclusive, so you can ADD the probabilities
Tree diagram rules Outcomes at the ends of the branches Probabilities along each branch Multiply probabilities along the branches leading to the combined outcomes (independent events) If there are two different routes through the tree diagram that lead to a desired outcome, add the total probabilities (mutually exclusive outcomes)

Data Handling

  • 1.
    Data Handling ModuleIntroduction and first topic: probability
  • 2.
    “ To understandGod's thoughts we must study statistics, for these are the measure of His purpose” “ How very little can be done under the spirit of fear”
  • 3.
  • 4.
    Live births inEngland and Wales, FM1 number 36, stat istics.gov.uk
  • 5.
    Data Handling ProbabilityRelationship Between variables Dispersion Tree diagrams Mutually exclusive outcomes Independent events Experimental probability Basics Expected frequency Scatter diagram Line of best fit Interpolation and extrapolation Describe correlation Spearman’s rank Correlation coefficient Central tendency Frequency Distribution Range Standard deviation Box and Whisker plot Cumulative frequency Quartiles and Five number summary Mode from distribution Difference between groups Median from distribution Inter-quartile range Mean from distribution Histogram Frequency polygon
  • 6.
    Probability: basics ProbabilityTree diagrams Mutually exclusive outcomes Independent events Experimental probability Basics Expected frequency Probabilities are fractions between 0 and 1 If the probability of Algernon being on time for his lesson is 0.9, what is the probability of Algernon not being on time? If Algernon attends 300 lessons in a year, how many lessons would you expect him not to be on time for?
  • 7.
    Probability: basics Twodice are rolled and their scores are added. Use the blank to write down all the possible total scores 1) What is the probability of a score greater than 10? 2) What is the probability of a score that is a prime number?
  • 8.
    Probability: AND meansMultiply Toss a coin and then roll a dice Events are independent so multiply the probabilities 1) Probability of getting a head AND a one? AND means MULTIPLY if events are independent 2) Probability of getting tail AND a number larger than four?
  • 9.
    Probability: OR meansADD 1) How many balls? 2) Probability of picking an orange ball? 3) Probability of picking a blue ball? Blue ball OR orange ball, OR yellow ball called mutually exclusive outcomes: probabilities must add to one
  • 10.
    Probability: Combined probabilitySuppose that you picked a ball from the bag (notice only two colours now), noted the colour, then replaced the ball and picked another one and noted the colour of the second ball. There are four possible outcomes… BB, OO, BO, OB But these outcomes are NOT equally likely!
  • 11.
    Probability: Tree diagramsB O B B O O BO BB OB OO 1 st pick 2 nd pick
  • 12.
    Probability: Tree diagramsB O B B O O 1 st pick 2 nd pick BO BB OB OO Each combined outcome has a different probability associated with it
  • 13.
    Probability: Tree diagramsB O B B O O BO BB OB OO Q) What is the probability of getting one ball of each colour? In any order?
  • 14.
    Probability: Tree diagramsB O B B O O BO BB OB OO These outcomes are mutually exclusive, so you can ADD the probabilities
  • 15.
    Tree diagram rulesOutcomes at the ends of the branches Probabilities along each branch Multiply probabilities along the branches leading to the combined outcomes (independent events) If there are two different routes through the tree diagram that lead to a desired outcome, add the total probabilities (mutually exclusive outcomes)