Download to read offline
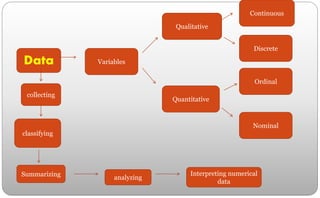
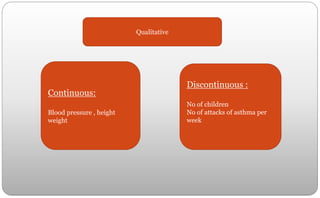
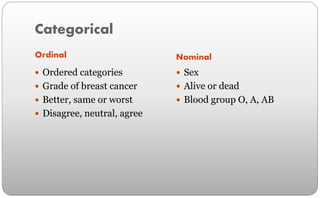
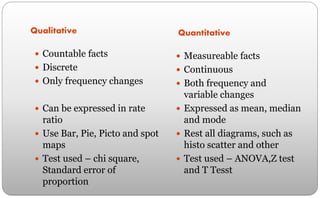
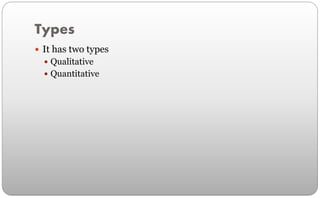
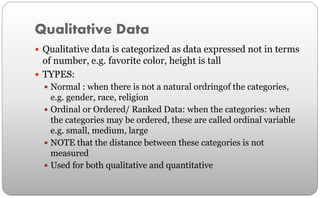
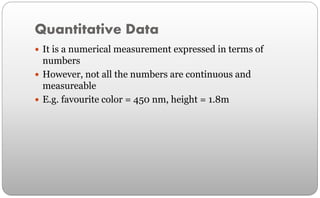

This document discusses different types of data including qualitative and quantitative data. Qualitative data can be nominal, ordinal, or categorical. Quantitative data can be continuous like height or weight, or discrete like number of children. Continuous data can be measured on a scale and may include decimals, while discrete data only takes whole number values. Variables are characteristics that are measured or observed, and can be either qualitative or quantitative. The type of statistical analysis used depends on whether the data is qualitative or quantitative.