Downloaded 42 times

![Data import
genomation
package
Altuna Akalın
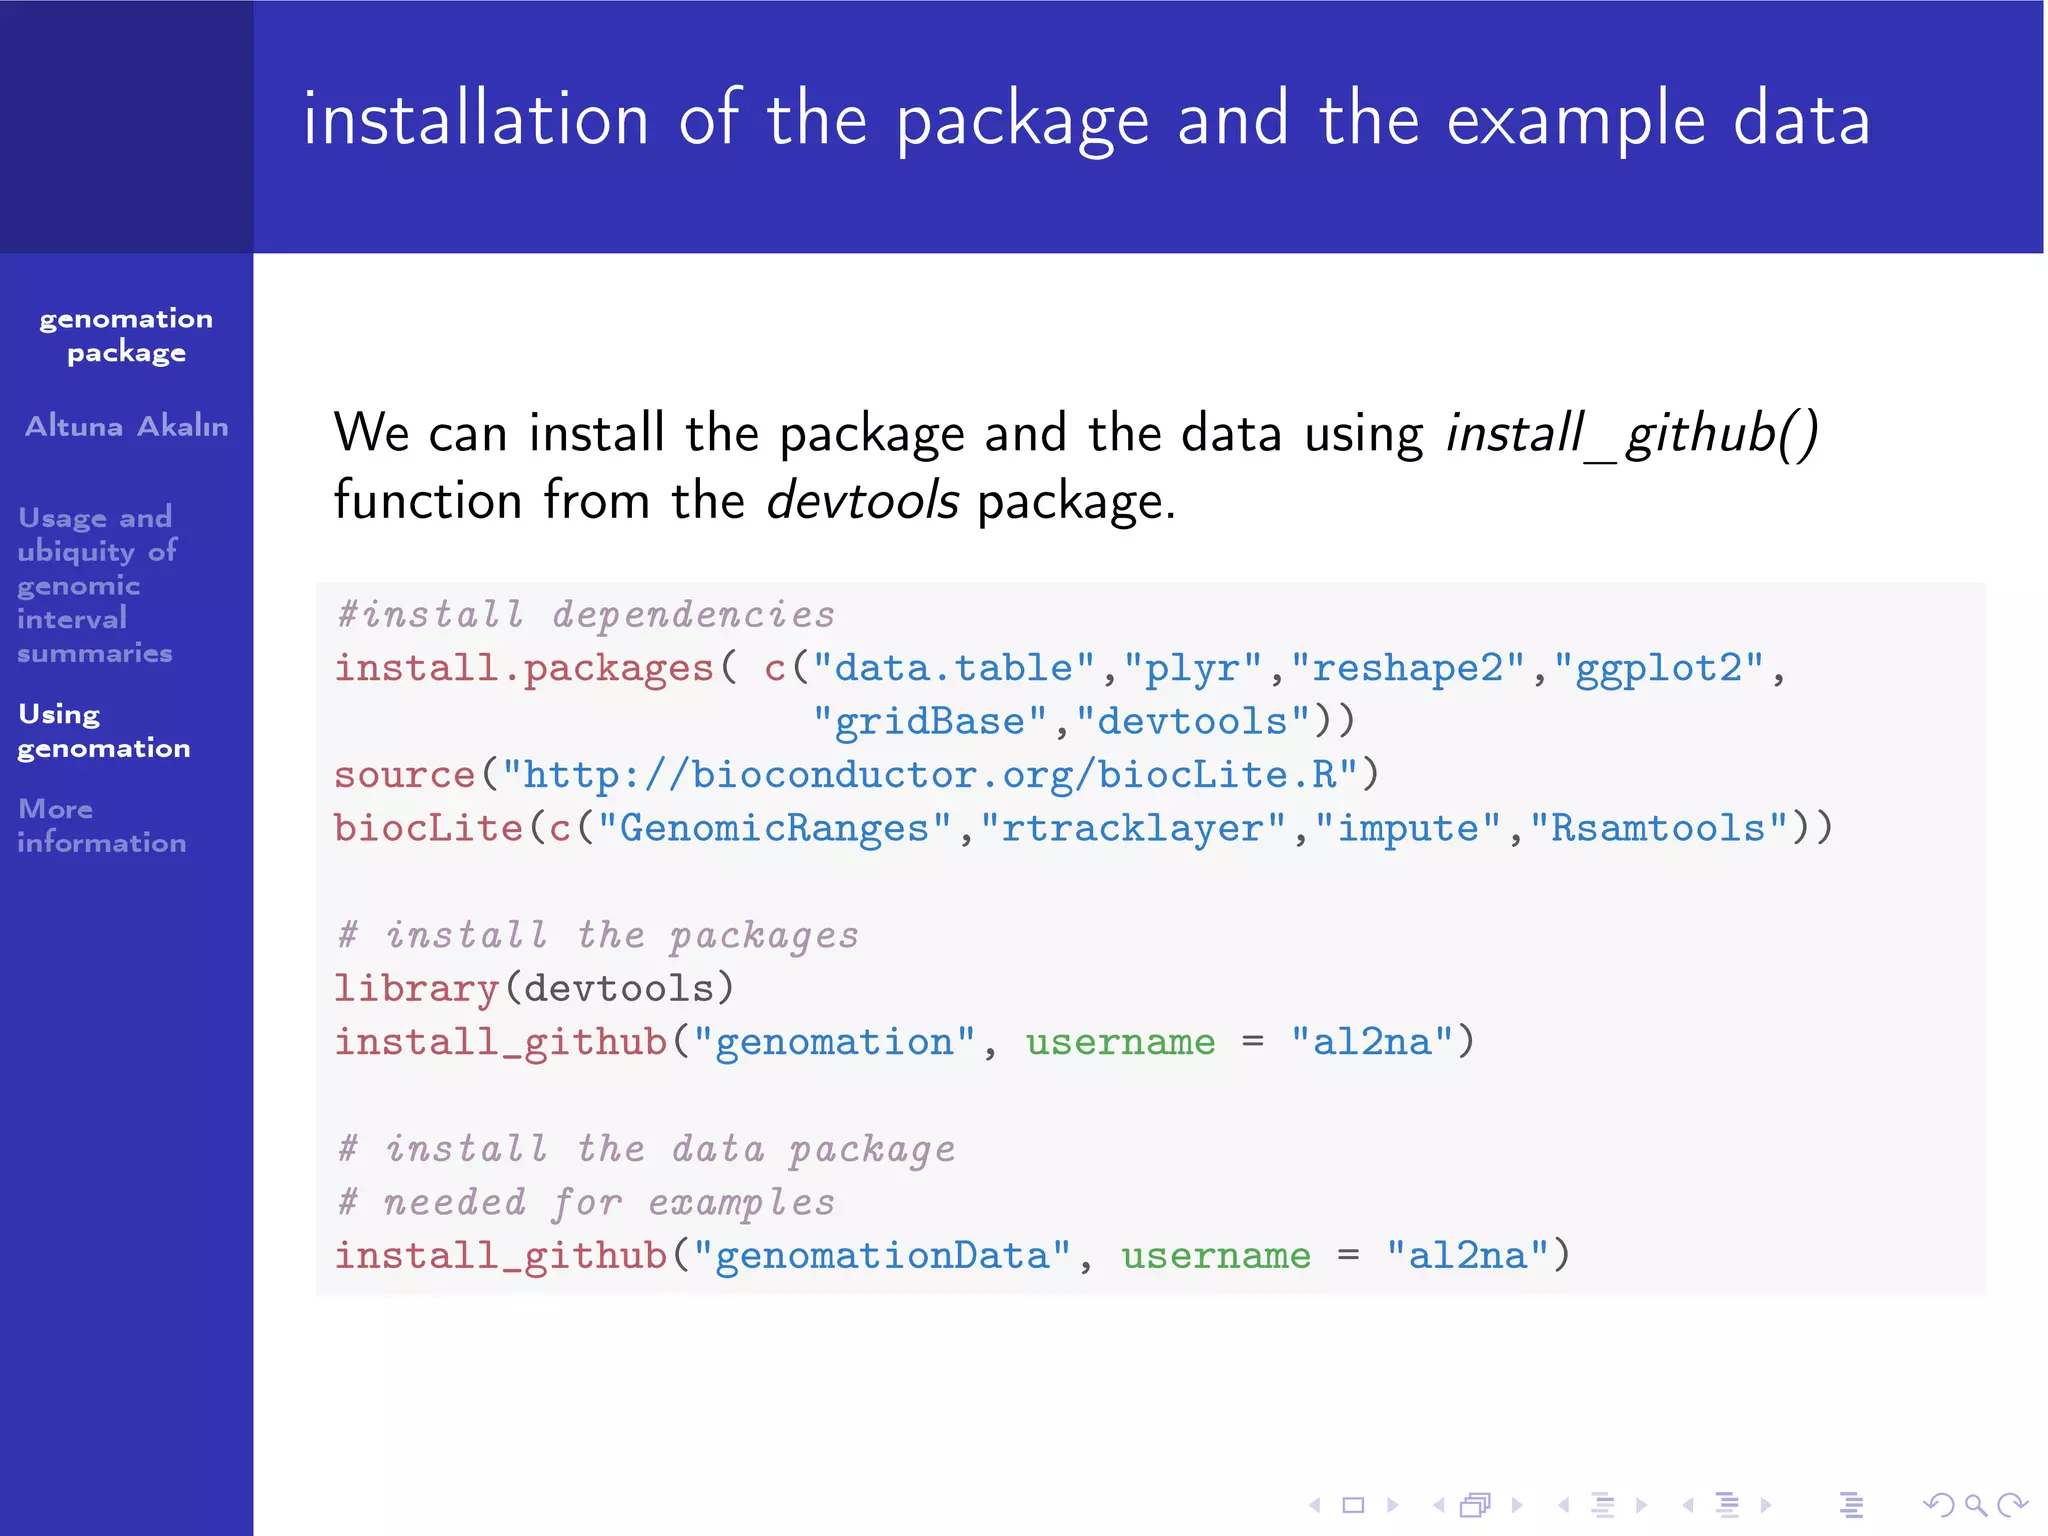
Various file formats can be used in genomation. You can read in
annotation or your genomic intervals of interest.
Usage and
ubiquity of
genomic
interval
summaries
library(genomation)
tab.file1 <- system.file("extdata/tab1.bed", package = "genomation")
readGeneric(tab.file1)
Using
genomation
More
information
## GRanges with 6
##
seqnames
##
<Rle>
##
[1]
chr21
##
[2]
chr21
##
[3]
chr21
##
[4]
chr21
##
[5]
chr21
##
[6]
chr21
##
--##
seqlengths:
##
chr21
##
NA
ranges and 0 metadata columns:
ranges strand
<IRanges> <Rle>
[9437272, 9439473]
*
[9483485, 9484663]
*
[9647866, 9648116]
*
[9708935, 9709231]
*
[9825442, 9826296]
*
[9909011, 9909218]
*](https://image.slidesharecdn.com/genomationpres19feb2014-140218172638-phpapp02/75/genomation-summary-of-genomic-intervals-17-2048.jpg)

![Multiple profiles
0
0
0
50
25
0
25
−2
50
50
−5 0
00
0
0
25
−2
50
50
−5 0
00
0
0
25
0
P300 Suz12 Rad21 Znf143
−2
50
0
0
−5
00
CTCF
50
−5 0
00
More
information
25
Using
genomation
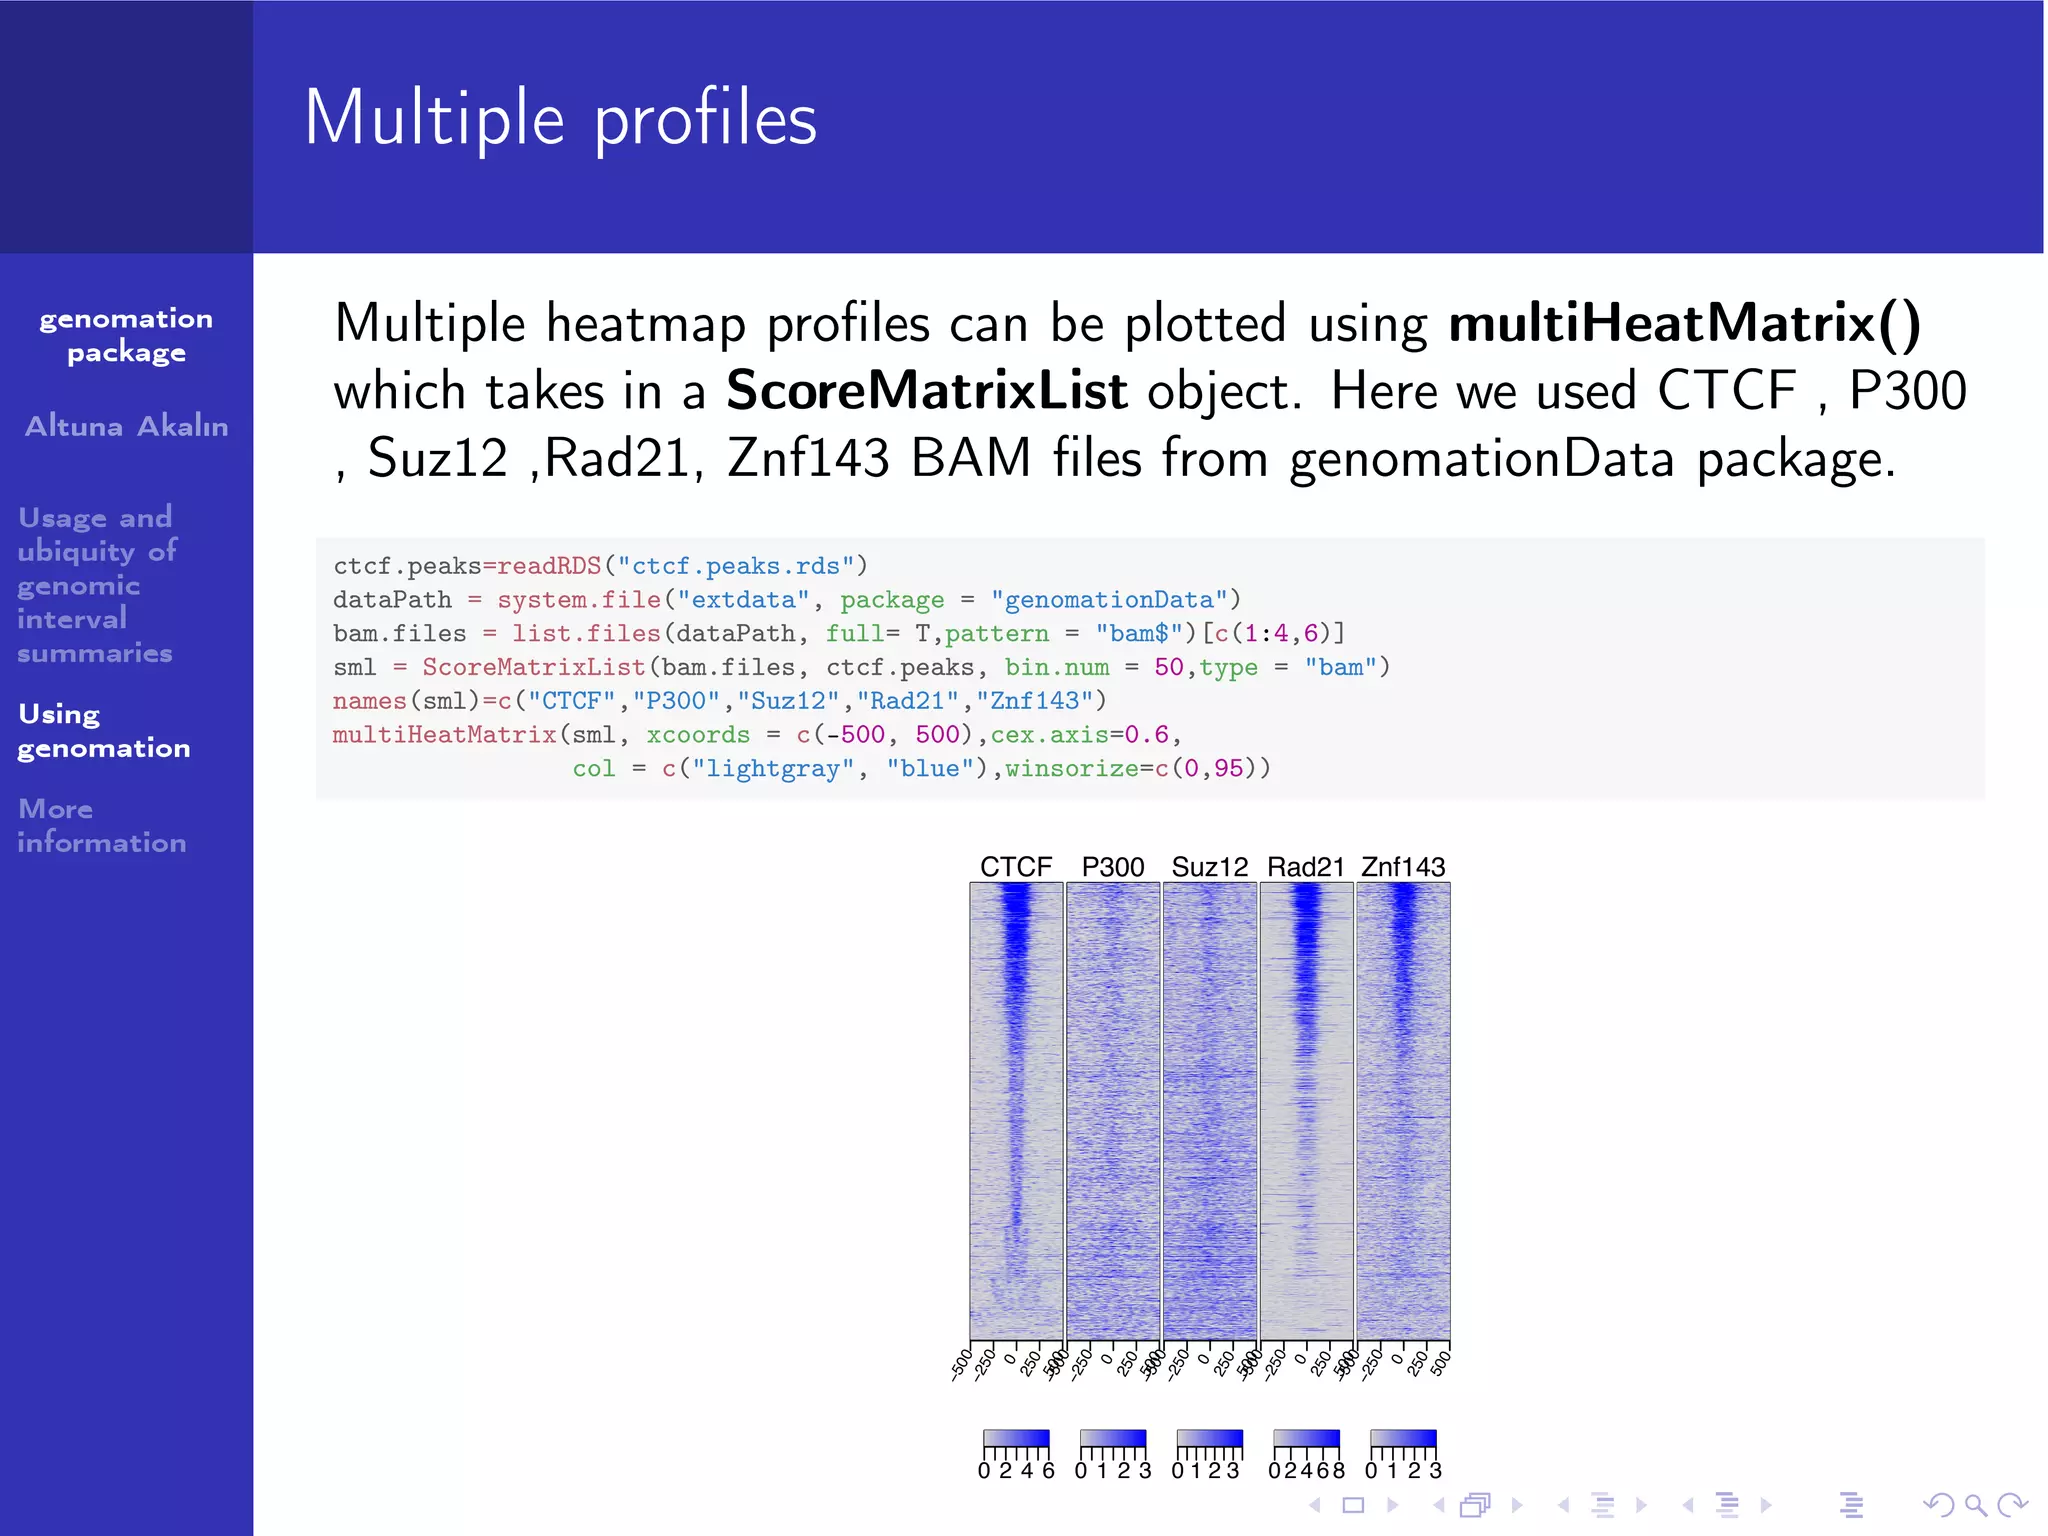
ctcf.peaks=readRDS("ctcf.peaks.rds")
dataPath = system.file("extdata", package = "genomationData")
bam.files = list.files(dataPath, full= T,pattern = "bam$")[c(1:4,6)]
sml = ScoreMatrixList(bam.files, ctcf.peaks, bin.num = 50,type = "bam")
names(sml)=c("CTCF","P300","Suz12","Rad21","Znf143")
multiHeatMatrix(sml, xcoords = c(-500, 500),cex.axis=0.35,common.scale = T,
col = c("lightgray", "blue"),winsorize=c(0,95))
−2
50
Usage and
ubiquity of
genomic
interval
summaries
50
−5 0
00
Altuna Akalın
Multiple heatmap profiles can be plotted using multiHeatMatrix()
which takes in a ScoreMatrixList object. Here we used CTCF , P300
, Suz12 ,Rad21, Znf143 BAM files from genomationData package.
−2
50
genomation
package
02468 02468 02468 02468 02468](https://image.slidesharecdn.com/genomationpres19feb2014-140218172638-phpapp02/75/genomation-summary-of-genomic-intervals-22-2048.jpg)


![Session Info
genomation
package
Altuna Akalın
Usage and
ubiquity of
genomic
interval
summaries
Using
genomation
More
information
sessionInfo()
##
##
##
##
##
##
##
##
##
##
##
##
##
##
##
##
##
##
##
##
##
R version 3.0.2 (2013-09-25)
Platform: x86_64-apple-darwin10.8.0 (64-bit)
locale:
[1] C
attached base packages:
[1] methods
grid
stats
[8] base
graphics
grDevices utils
other attached packages:
[1] genomation_0.99.0.2 knitr_1.5
loaded via a namespace (and not attached):
[1] BSgenome_1.30.0
BiocGenerics_0.8.0
[4] GenomicRanges_1.14.3 IRanges_1.20.5
[7] RColorBrewer_1.0-5
RCurl_1.95-4.1
[10] XML_3.95-0.2
XVector_0.2.0
[13] colorspace_1.2-4
data.table_1.8.10
[16] digest_0.6.3
evaluate_0.5.1
[19] ggplot2_0.9.3.1
gridBase_0.4-6
Biostrings_2.30.0
MASS_7.3-29
Rsamtools_1.14.1
bitops_1.0-6
dichromat_2.0-0
formatR_0.10
gtable_0.1.2
datas](https://image.slidesharecdn.com/genomationpres19feb2014-140218172638-phpapp02/75/genomation-summary-of-genomic-intervals-28-2048.jpg)

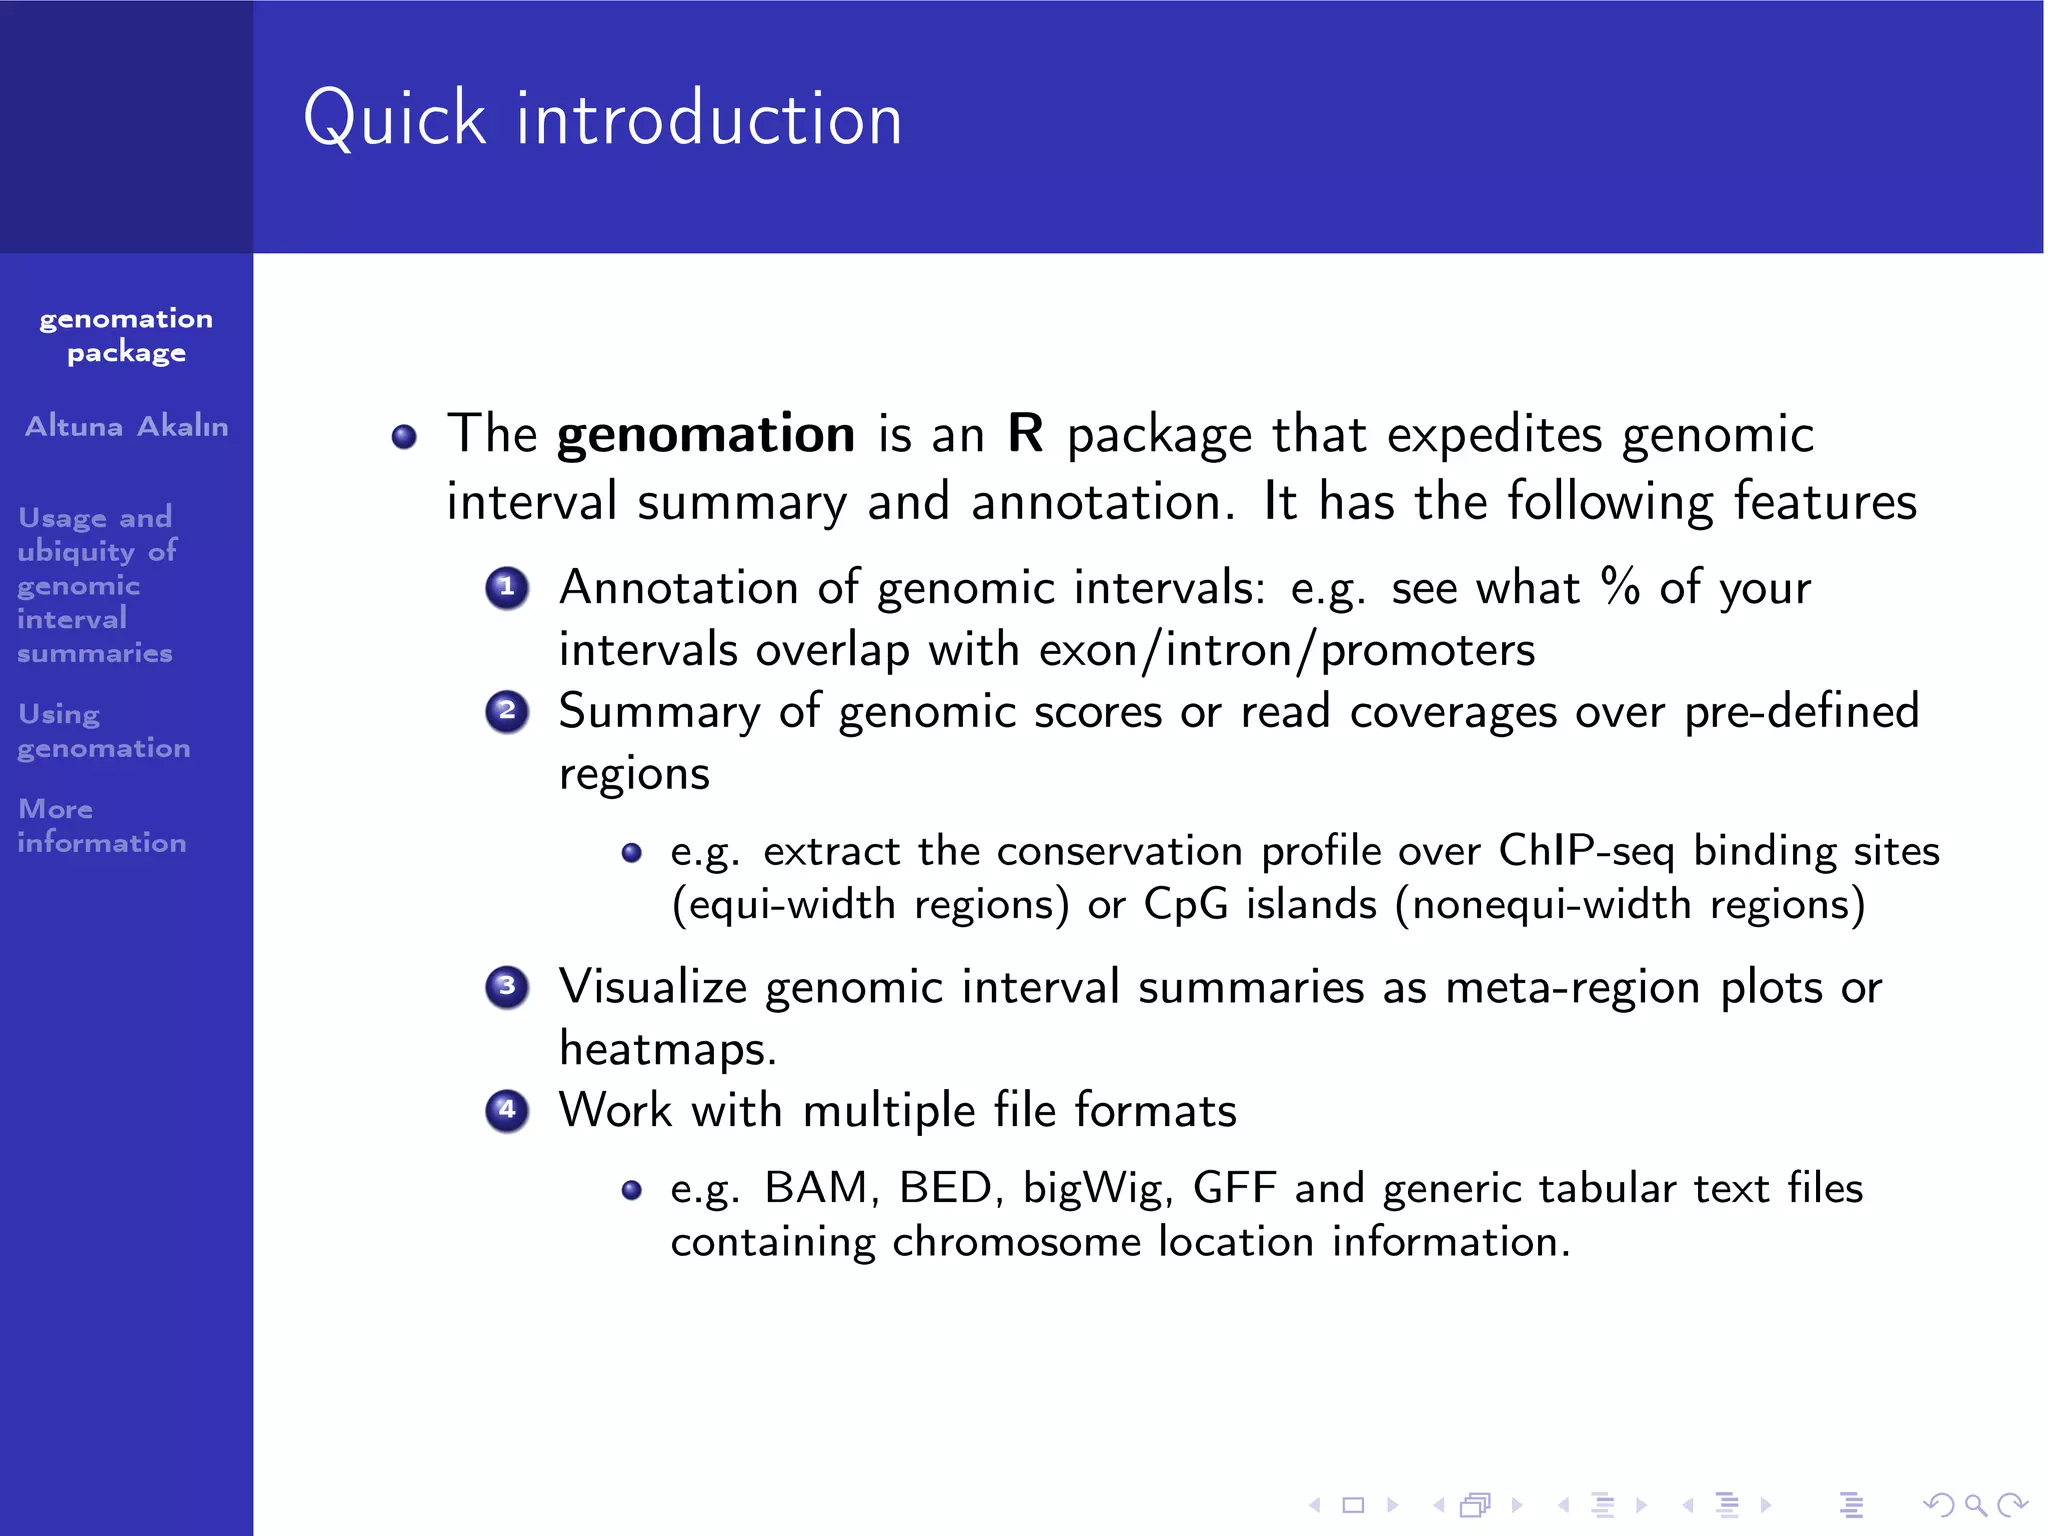
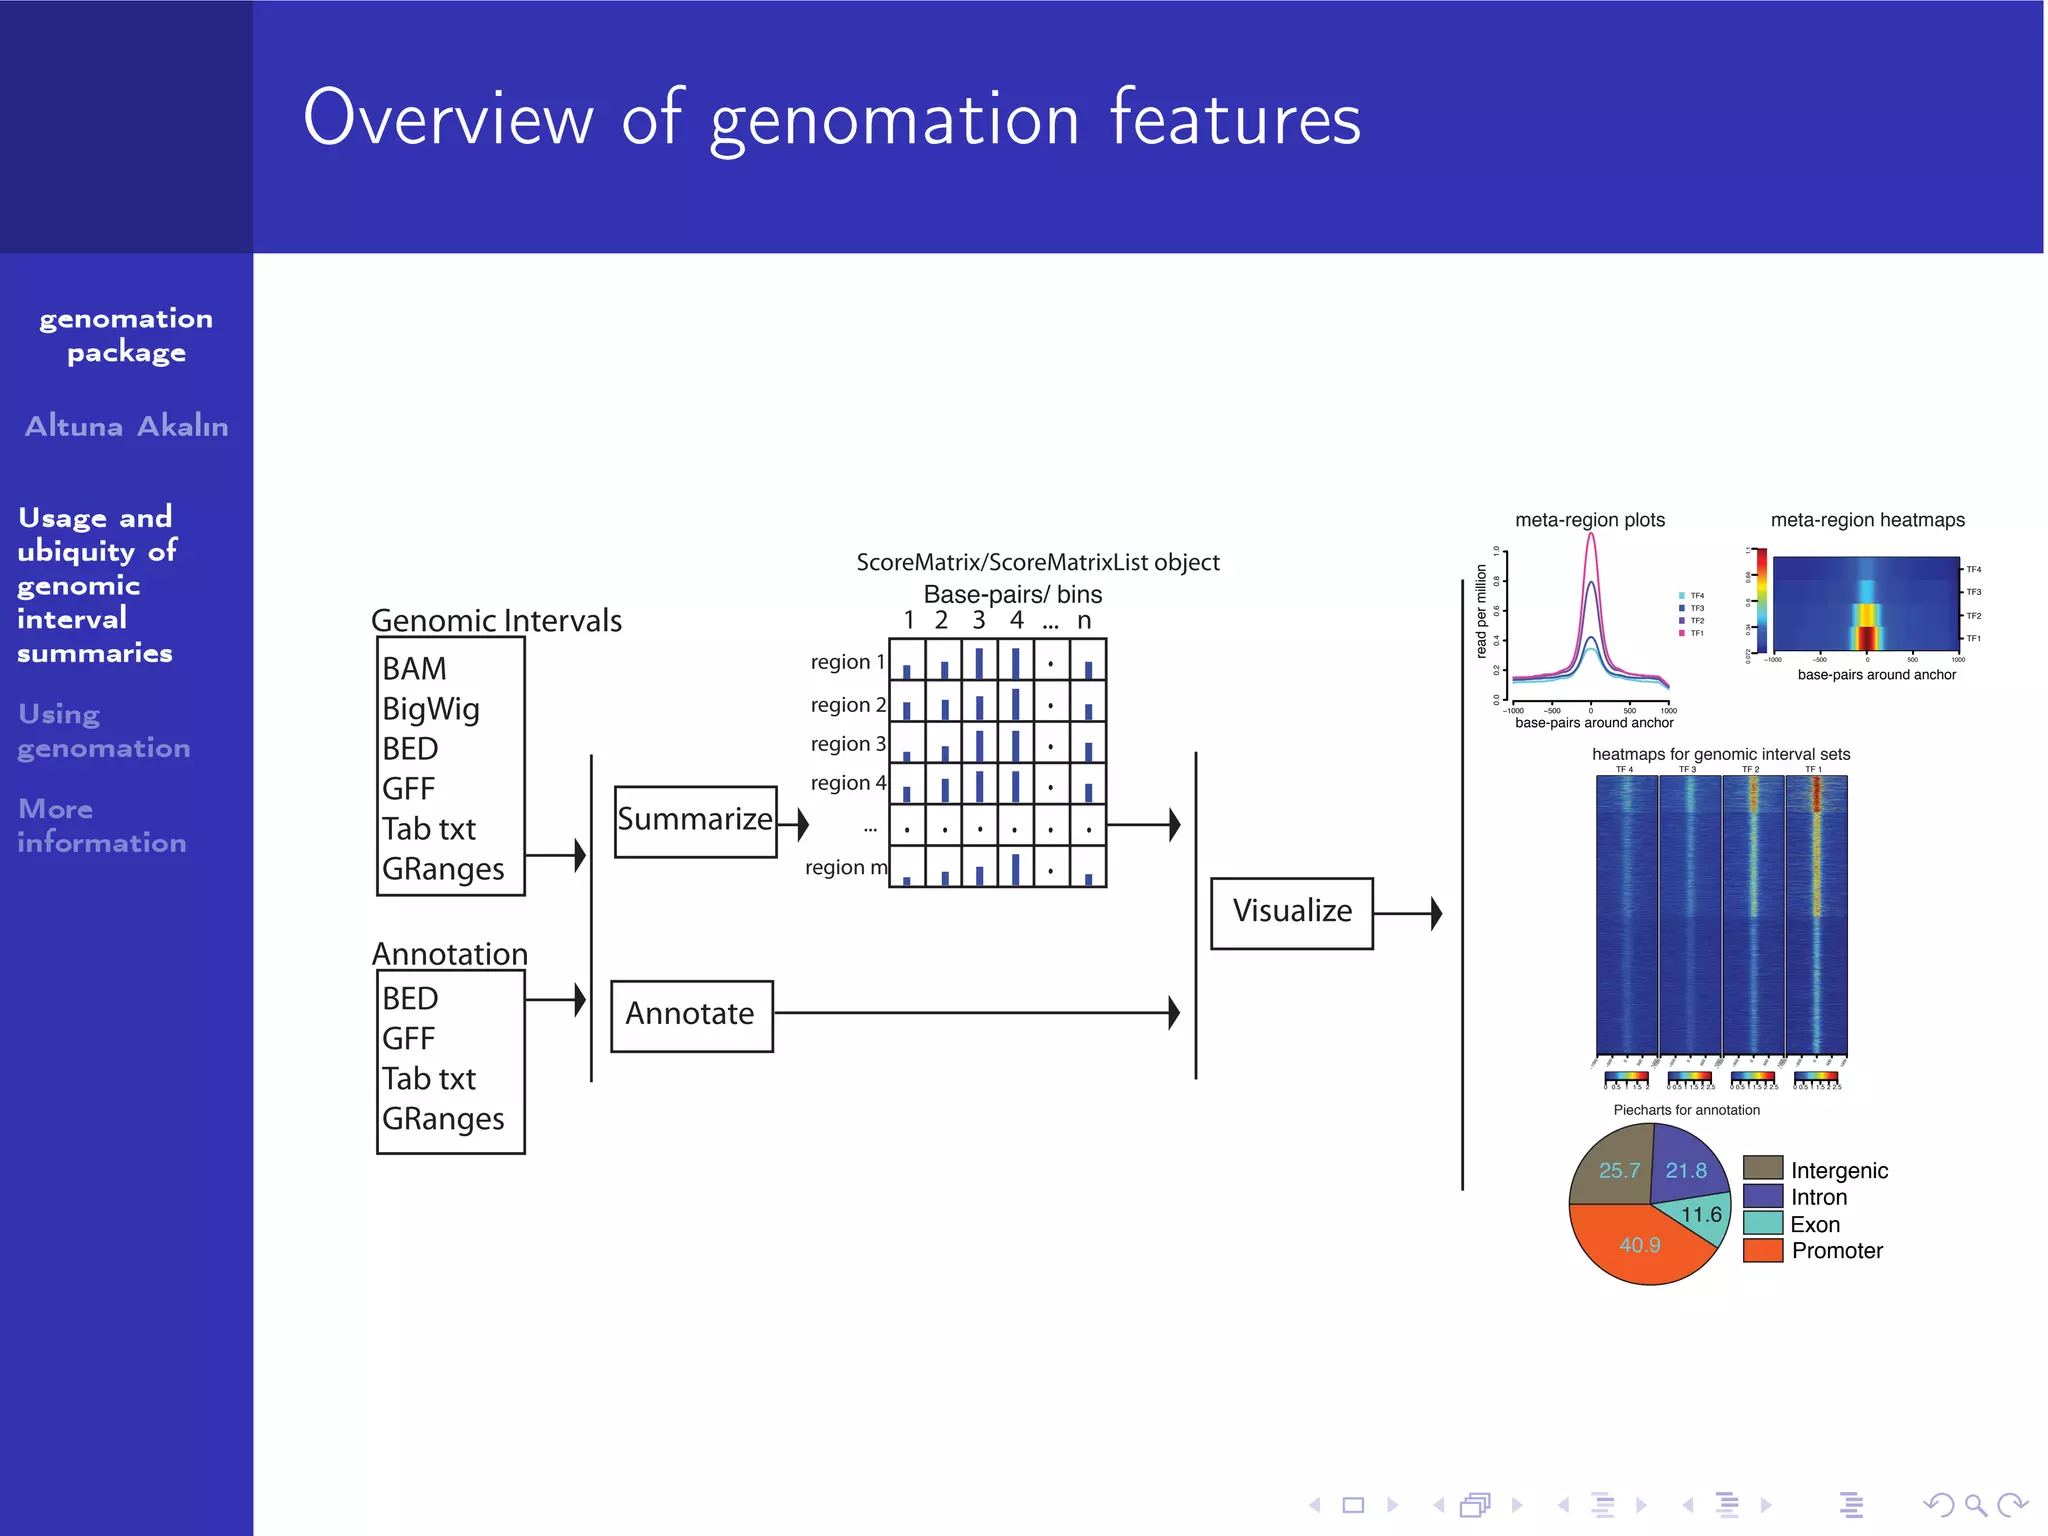
The genomation package is an R toolkit designed to summarize, annotate, and visualize genomic intervals effectively. Key features include annotation of genomic intervals, summarization of genomic scores, and visualization options such as meta-region plots and heatmaps, accommodating various file formats like BAM and BED. The package aims to streamline the analysis of genomic data, making it accessible while emphasizing ease of use and flexibility.


