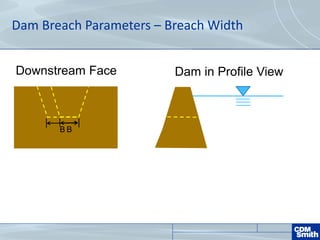
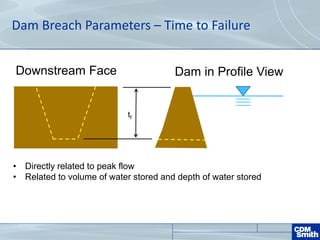
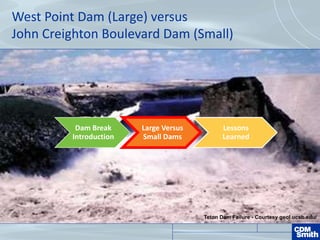
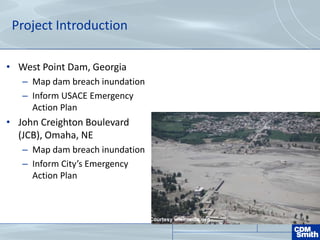
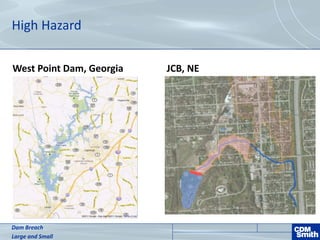
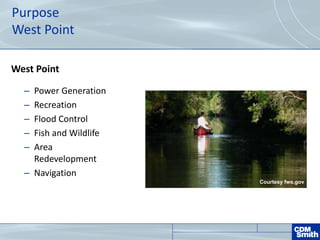
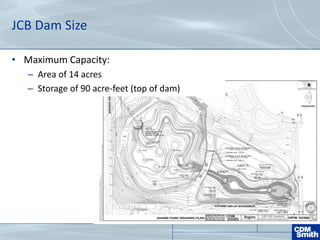
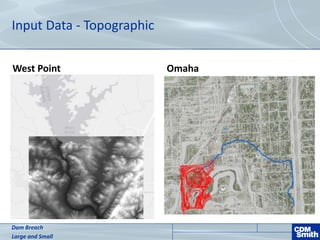
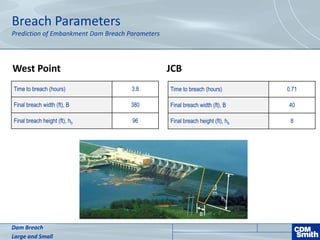
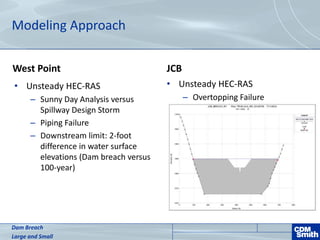
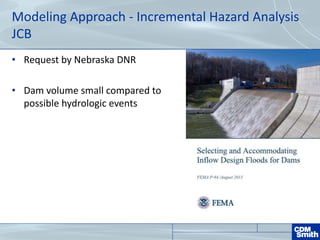
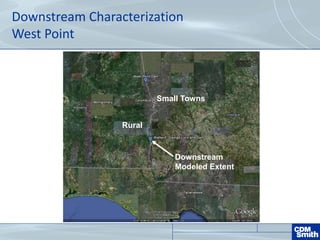
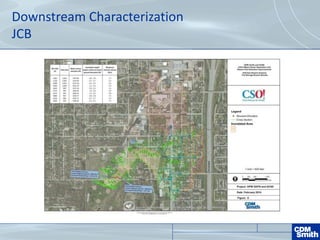
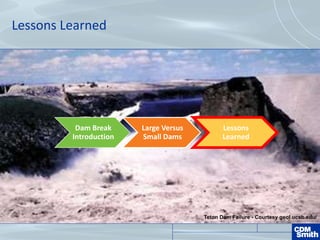
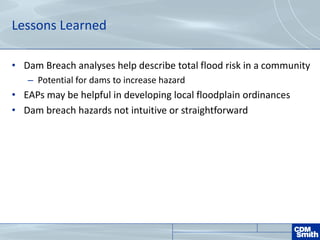
Dam Breach Analysis
Large and Small
June 3, 2015
Matt Scott, Water
Resources Engineer
Lisa Brink, Water
Resources Engineer
Introduction
• Discussion of Dam Breach
Technical Analysis for a Large and
Small Dam
• Dam Safety – Emergency Action Plans
• Considerations for Floodplain
Administrators
Teton Dam Failure - Courtesy geol.ucsb.edu/
Dam Breach Introduction
Dam Break
Introduction
Large Versus
Small Dams
Lessons
Learned
Dam Breach Parameters
• Breach parameter determination fundamental to breach analysis
• Dam breach parameters define the development of a dam breach,
and include:
– Breach height, hb
– Breach width, B
– Breach side slopes, m
– Time to full breach
formation, tf
m
B
hb
Dam Breach Parameters – Breach Height
hb
hb
Dam in Profile ViewDownstream Face
Dam Breach Parameters – Breach Width
B
Dam in Profile ViewDownstream Face
BB
Dam Breach Parameters – Time to Failure
Dam in Profile ViewDownstream Face
tf
• Directly related to peak flow
• Related to volume of water stored and depth of water stored
Mode of Failure
• Overtopping – uncontrolled flow over the dam
• Piping – seepage through the dam erodes soil, creating a
flow path through the embankment
Teton Dam Failure - Courtesy geol.ucsb.edu/
West Point Dam (Large) versus
John Creighton Boulevard Dam (Small)
Dam Break
Introduction
Large Versus
Small Dams
Lessons
Learned
Project Introduction
• West Point Dam, Georgia
– Map dam breach inundation
– Inform USACE Emergency
Action Plan
• John Creighton Boulevard
(JCB), Omaha, NE
– Map dam breach inundation
– Inform City’s Emergency
Action Plan
Courtesy wikimedia.org
High Hazard
West Point Dam, Georgia JCB, NE
Dam Breach
Large and Small
Purpose
West Point
West Point
– Power Generation
– Recreation
– Flood Control
– Fish and Wildlife
– Area
Redevelopment
– Navigation
Courtesy fws.gov
Purpose
JCB
West Point Dam Size
• At summer normal pool
elevation:
– Area of 25,900 acres
– Storage of 604,527 acre-feet
• West Point Dam located on
the Chattahoochee River
Courtesy
usace.gov
JCB Dam Size
• Maximum Capacity:
– Area of 14 acres
– Storage of 90 acre-feet (top of dam)
Input Data - Topographic
West Point Omaha
Dam Breach
Large and Small
Input Data – Operational
West Point Dam
Courtesy lrn.usace.army.milCourtesy lrn.usace.army.mil
Input Data – Operational
JCB
Breach Parameters
Prediction of Embankment Dam Breach Parameters
JCB
Dam Breach
Large and Small
Time to breach (hours) 0.71
Final breach width (ft), B 40
Final breach height (ft), hb 8
West Point
Time to breach (hours) 3.8
Final breach width (ft), B 380
Final breach height (ft), hb 96
m
B
hb
Modeling Approach
West Point JCB
• Unsteady HEC-RAS
– Overtopping Failure
Dam Breach
Large and Small
• Unsteady HEC-RAS
– Sunny Day Analysis versus
Spillway Design Storm
– Piping Failure
– Downstream limit: 2-foot
difference in water surface
elevations (Dam breach versus
100-year)
Modeling Approach – FEMA FIS Data
West Point
Modeling Approach - Incremental Hazard Analysis
JCB
• Request by Nebraska DNR
• Dam volume small compared to
possible hydrologic events
Downstream Characterization
West Point
Rural
Small Towns
Downstream
Modeled Extent
Downstream Characterization
JCB
Teton Dam Failure - Courtesy geol.ucsb.edu/
Lessons Learned
Dam Break
Introduction
Large Versus
Small Dams
Lessons
Learned
Lessons Learned
• Dam Breach analyses help describe total flood risk in a community
– Potential for dams to increase hazard
• EAPs may be helpful in developing local floodplain ordinances
• Dam breach hazards not intuitive or straightforward
Dam Safety Information
http://www.damsafety.org/map/
Questions?
Credit: https://susannesartandlife.wordpress.com/tag/shark/

Dam Breach Analysis: Large and Small

  • 1.
    Dam Breach Analysis Largeand Small June 3, 2015 Matt Scott, Water Resources Engineer Lisa Brink, Water Resources Engineer
  • 2.
    Introduction • Discussion ofDam Breach Technical Analysis for a Large and Small Dam • Dam Safety – Emergency Action Plans • Considerations for Floodplain Administrators
  • 3.
    Teton Dam Failure- Courtesy geol.ucsb.edu/ Dam Breach Introduction Dam Break Introduction Large Versus Small Dams Lessons Learned
  • 4.
    Dam Breach Parameters •Breach parameter determination fundamental to breach analysis • Dam breach parameters define the development of a dam breach, and include: – Breach height, hb – Breach width, B – Breach side slopes, m – Time to full breach formation, tf m B hb
  • 5.
    Dam Breach Parameters– Breach Height hb hb Dam in Profile ViewDownstream Face
  • 6.
    Dam Breach Parameters– Breach Width B Dam in Profile ViewDownstream Face BB
  • 7.
    Dam Breach Parameters– Time to Failure Dam in Profile ViewDownstream Face tf • Directly related to peak flow • Related to volume of water stored and depth of water stored
  • 8.
    Mode of Failure •Overtopping – uncontrolled flow over the dam • Piping – seepage through the dam erodes soil, creating a flow path through the embankment
  • 9.
    Teton Dam Failure- Courtesy geol.ucsb.edu/ West Point Dam (Large) versus John Creighton Boulevard Dam (Small) Dam Break Introduction Large Versus Small Dams Lessons Learned
  • 10.
    Project Introduction • WestPoint Dam, Georgia – Map dam breach inundation – Inform USACE Emergency Action Plan • John Creighton Boulevard (JCB), Omaha, NE – Map dam breach inundation – Inform City’s Emergency Action Plan Courtesy wikimedia.org
  • 11.
    High Hazard West PointDam, Georgia JCB, NE Dam Breach Large and Small
  • 12.
    Purpose West Point West Point –Power Generation – Recreation – Flood Control – Fish and Wildlife – Area Redevelopment – Navigation Courtesy fws.gov
  • 13.
  • 14.
    West Point DamSize • At summer normal pool elevation: – Area of 25,900 acres – Storage of 604,527 acre-feet • West Point Dam located on the Chattahoochee River Courtesy usace.gov
  • 15.
    JCB Dam Size •Maximum Capacity: – Area of 14 acres – Storage of 90 acre-feet (top of dam)
  • 16.
    Input Data -Topographic West Point Omaha Dam Breach Large and Small
  • 17.
    Input Data –Operational West Point Dam Courtesy lrn.usace.army.milCourtesy lrn.usace.army.mil
  • 18.
    Input Data –Operational JCB
  • 19.
    Breach Parameters Prediction ofEmbankment Dam Breach Parameters JCB Dam Breach Large and Small Time to breach (hours) 0.71 Final breach width (ft), B 40 Final breach height (ft), hb 8 West Point Time to breach (hours) 3.8 Final breach width (ft), B 380 Final breach height (ft), hb 96 m B hb
  • 20.
    Modeling Approach West PointJCB • Unsteady HEC-RAS – Overtopping Failure Dam Breach Large and Small • Unsteady HEC-RAS – Sunny Day Analysis versus Spillway Design Storm – Piping Failure – Downstream limit: 2-foot difference in water surface elevations (Dam breach versus 100-year)
  • 21.
    Modeling Approach –FEMA FIS Data West Point
  • 22.
    Modeling Approach -Incremental Hazard Analysis JCB • Request by Nebraska DNR • Dam volume small compared to possible hydrologic events
  • 23.
  • 24.
  • 25.
    Teton Dam Failure- Courtesy geol.ucsb.edu/ Lessons Learned Dam Break Introduction Large Versus Small Dams Lessons Learned
  • 26.
    Lessons Learned • DamBreach analyses help describe total flood risk in a community – Potential for dams to increase hazard • EAPs may be helpful in developing local floodplain ordinances • Dam breach hazards not intuitive or straightforward
  • 27.
  • 28.

Editor's Notes

  • #3 Next: Matt Case study to illustrate the dam breach analysis process EAPs – recommended by FEMA for dam owners; map flood hazard downstream of dams (traditional flood mapping assumes normal dam operation during a flood).
  • #4 Next: Matt Dam Breach Parameters/Concepts
  • #5 Next: Matt Direct observation of breach events unlikely, parameters represent measurements taken after breach events
  • #6 Next: Matt
  • #7 Next: Matt
  • #8 Next: Matt
  • #9 Next: Matt
  • #10 Next: Matt Dam Breach Parameters/Concepts
  • #11 Next: Lisa Dam Breach Parameters/Concepts
  • #12 Next: Lisa Omaha: -Regulated impoundment > 50 ac-ft of storage -breach completed to demonstrate effects of breach -EAP prepared -No existing regulatory, as no water body presently exists
  • #13 Next: Lisa
  • #14 Next: Matt
  • #15 Next: Lisa Trib area of approximately 2,400 sq mi
  • #16 Next: Lisa Trib area of approximately 350 acres (0.5 sq mi)
  • #17 Next: Matt Omaha: Topographic Detailed grading for detention 2-feet contours downstream with limited survey
  • #18 Next: Lisa Normal flows used to produce electricity Flood flows routed through spillway controlled by 6 tainter gates Spillway – clear opening of 300’ Gates – 6 total, 50’ wide by 41’ high Average regulated discharge of 4,820 cubic feet per second Maximum spillway flow of 356,830 cubic feet per second
  • #19 Next: Lisa
  • #20 Next: Lisa Omaha: Matt: I think that you should briefly discuss the sensitivity analysis completed for the breach parameters.
  • #21 Next: Matt
  • #22 Next: Lisa
  • #23 Next: Lisa Tradeoffs determing IDF: -acceptable safety to the public -effectively applying dam owner resources
  • #24 Next: Lisa 129 river miles modeled; approx. 5 incorporated areas
  • #25 Next: Lisa
  • #26 Next: Matt
  • #27 Next: Matt Ordinances – ie. requirement for roads/logistical (not as strict as floodplain development but not totally unrestricted) Also, limitations to development downstream of existing and proposed dams. JCB – park setting seems inconsistent with level of hazard presented by dam
  • #28 Georgia Inspected All High Hazard Potential Dams in 2013 26 high hazard dams with EAPs Corps of Engineers – interactive map
  • #29 Next: Lisa Ordinances – ie. requirement for roads/logistical (not as strict as floodplain development but not totally unrestricted) JCB – park setting seems inconsistent with level of hazard presented by dam