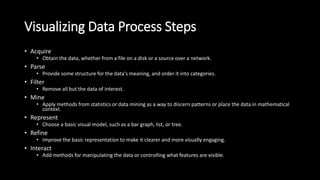
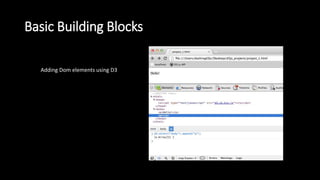
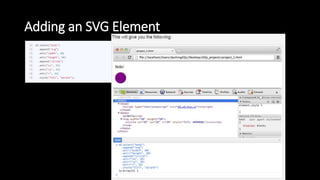
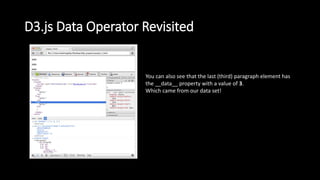
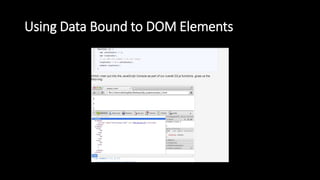
D3 Data Visualization
Presented By Vinod – Architect – Crestron Electronics
Visualizing Data Process Steps
• Acquire
• Obtain the data, whether from a file on a disk or a source over a network.
• Parse
• Provide some structure for the data's meaning, and order it into categories.
• Filter
• Remove all but the data of interest.
• Mine
• Apply methods from statistics or data mining as a way to discern patterns or place the data in mathematical
context.
• Represent
• Choose a basic visual model, such as a bar graph, list, or tree.
• Refine
• Improve the basic representation to make it clearer and more visually engaging.
• Interact
• Add methods for manipulating the data or controlling what features are visible.
Basic Building Blocks
Adding Dom elements using D3
Adding an SVG Element
Select/Data/Enter/Append
SelectAll/Data/Enter/Append
• D3.js SelectAll Method
• The D3.js SelectAll method uses CSS3 selectors to grab DOM elements.
• But wait! The basic HTML page doesn't contain any <p> yet. What is it actually
doing?
• What it is doing is selecting all of the <p> available on the page. Which in this
case is none. So it returns an empty selection.
• Later use of .data(theData) and .enter( ) will allow us to bind the data to the
empty selection.
SelectAll/Data/Enter/Append
• D3.js Data Operator
• The data operator joins an array of data (which can be numbers, objects or
other arrays) with the current selection.
• The first element 1 is assigned to the first <p> element, the second to the
second, so on and so forth.
• But wait! The basic page doesn't contain any <p> yet. What is it actually
doing?
D3.js Virtual Selections (Thinking with Joins)
• The D3.js Data Operator returns three virtual selections rather than
just the regular one like other methods.
• The three virtual selections are enter, update and exit.
• The enter selection contains placeholders for any missing elements.
• The update selection contains existing elements, bound to data.
• Any remaining elements end up in the exit selection for removal.
D3.js Virtual Selections (Thinking with Joins)
• d3.select("body").selectAll("p") => was empty
• The virtual enter selection now contains placeholders for our <p>
elements.
D3.js Enter Method
• The D3.js Enter Method returns the virtual enter selection from the
Data Operator.
• This method only works on the Data Operator because the Data
Operator is the only one that returns three virtual selections.
• Only allows chaining of append, insert and select operators to be
used on it
D3.js Append Operator Revisited
• var p = d3.select("body").selectAll("p")
.data(theData)
.enter()
.append("p")
For each placeholder element created in the previous step, a p element
is inserted.
D3.js Text Operator
D3.js Data Operator Revisited
You can also see that the last (third) paragraph element has
the __data__ property with a value of 3.
Which came from our data set!
Using Data Bound to DOM Elements
Variables Available inside D3.js Operators
• The are two other variables provided to us by D3.js - this and i.
• this => refers to the current DOM element being evaluated.
• i => refers to the index of the current HTML element being evaluated
in the selected elements selection.
Variables Available inside D3.js Operators
Creating SVG Elements Based on Data
Using the SVG Coordinate Space
Data Structures D3.js Accepts
• Loading External Data Resources
• D3.js has built in functionality to load in the following types of external
resources:
• an XMLHttpRequest
• a text file
• a JSON blob
• an HTML document fragment
• an XML document fragment
• a comma-separated values (CSV) file
• a tab-separated values (TSV) file
• The only thing to pay attention to is to make sure you construct an array
out of the data.
Using JSON data
SVG Paths and D3.js
• Accessor Function
Different types of line interpolations
Dynamic SVG Coordinate Space
• Three SVG Rectangle Example
• The SVG Viewport (container)
has a width of 100 units and
a height of 100 units.
Dynamic SVG Coordinate Space
• What if our purple
rectangle x-coordinate,
suddenly quadrupled
from 40 to 160?
Dynamic SVG Coordinate Space
D3.js Scales
• what if our data attributes suddenly quadrupled. And then,
quadrupled again. And then....etc.
• This is a problem once the SVG Viewport/Coordinate Space is bigger
than the browser window.
• The purple rectangle would be so far to the right that it would be
practically impossible to see.
D3.js Scales
• D3.js provides functions to perform data transformations.
• These functions map an input domain to an output range.
D3.js Scales
SVG Group Element and D3.js
SVG Transformation and D3.js
• Transformation
• Translate
• Scale
• Rotate
• Skew
D3.js based reusable visualization frameworks
• DC.JS => https://dc-js.github.io/dc.js/
• Dimple.js => http://dimplejs.org/
• Dance.js => https://github.com/michael/dance
• NVD3 => http://nvd3.org/index.html
• C3.js => http://c3js.org/
Thank You

D3 data visualization

  • 1.
    D3 Data Visualization PresentedBy Vinod – Architect – Crestron Electronics
  • 2.
    Visualizing Data ProcessSteps • Acquire • Obtain the data, whether from a file on a disk or a source over a network. • Parse • Provide some structure for the data's meaning, and order it into categories. • Filter • Remove all but the data of interest. • Mine • Apply methods from statistics or data mining as a way to discern patterns or place the data in mathematical context. • Represent • Choose a basic visual model, such as a bar graph, list, or tree. • Refine • Improve the basic representation to make it clearer and more visually engaging. • Interact • Add methods for manipulating the data or controlling what features are visible.
  • 3.
    Basic Building Blocks AddingDom elements using D3
  • 4.
  • 5.
  • 6.
    SelectAll/Data/Enter/Append • D3.js SelectAllMethod • The D3.js SelectAll method uses CSS3 selectors to grab DOM elements. • But wait! The basic HTML page doesn't contain any <p> yet. What is it actually doing? • What it is doing is selecting all of the <p> available on the page. Which in this case is none. So it returns an empty selection. • Later use of .data(theData) and .enter( ) will allow us to bind the data to the empty selection.
  • 7.
    SelectAll/Data/Enter/Append • D3.js DataOperator • The data operator joins an array of data (which can be numbers, objects or other arrays) with the current selection. • The first element 1 is assigned to the first <p> element, the second to the second, so on and so forth. • But wait! The basic page doesn't contain any <p> yet. What is it actually doing?
  • 8.
    D3.js Virtual Selections(Thinking with Joins) • The D3.js Data Operator returns three virtual selections rather than just the regular one like other methods. • The three virtual selections are enter, update and exit. • The enter selection contains placeholders for any missing elements. • The update selection contains existing elements, bound to data. • Any remaining elements end up in the exit selection for removal.
  • 9.
    D3.js Virtual Selections(Thinking with Joins) • d3.select("body").selectAll("p") => was empty • The virtual enter selection now contains placeholders for our <p> elements.
  • 10.
    D3.js Enter Method •The D3.js Enter Method returns the virtual enter selection from the Data Operator. • This method only works on the Data Operator because the Data Operator is the only one that returns three virtual selections. • Only allows chaining of append, insert and select operators to be used on it
  • 11.
    D3.js Append OperatorRevisited • var p = d3.select("body").selectAll("p") .data(theData) .enter() .append("p") For each placeholder element created in the previous step, a p element is inserted.
  • 12.
  • 13.
    D3.js Data OperatorRevisited You can also see that the last (third) paragraph element has the __data__ property with a value of 3. Which came from our data set!
  • 14.
    Using Data Boundto DOM Elements
  • 15.
    Variables Available insideD3.js Operators • The are two other variables provided to us by D3.js - this and i. • this => refers to the current DOM element being evaluated. • i => refers to the index of the current HTML element being evaluated in the selected elements selection.
  • 16.
  • 17.
    Creating SVG ElementsBased on Data
  • 18.
    Using the SVGCoordinate Space
  • 19.
    Data Structures D3.jsAccepts • Loading External Data Resources • D3.js has built in functionality to load in the following types of external resources: • an XMLHttpRequest • a text file • a JSON blob • an HTML document fragment • an XML document fragment • a comma-separated values (CSV) file • a tab-separated values (TSV) file • The only thing to pay attention to is to make sure you construct an array out of the data.
  • 20.
  • 21.
    SVG Paths andD3.js • Accessor Function
  • 22.
    Different types ofline interpolations
  • 23.
    Dynamic SVG CoordinateSpace • Three SVG Rectangle Example • The SVG Viewport (container) has a width of 100 units and a height of 100 units.
  • 24.
    Dynamic SVG CoordinateSpace • What if our purple rectangle x-coordinate, suddenly quadrupled from 40 to 160?
  • 25.
  • 26.
    D3.js Scales • whatif our data attributes suddenly quadrupled. And then, quadrupled again. And then....etc. • This is a problem once the SVG Viewport/Coordinate Space is bigger than the browser window. • The purple rectangle would be so far to the right that it would be practically impossible to see.
  • 27.
    D3.js Scales • D3.jsprovides functions to perform data transformations. • These functions map an input domain to an output range.
  • 28.
  • 29.
  • 30.
    SVG Transformation andD3.js • Transformation • Translate • Scale • Rotate • Skew
  • 31.
    D3.js based reusablevisualization frameworks • DC.JS => https://dc-js.github.io/dc.js/ • Dimple.js => http://dimplejs.org/ • Dance.js => https://github.com/michael/dance • NVD3 => http://nvd3.org/index.html • C3.js => http://c3js.org/
  • 32.