Download as PDF, PPTX


![1.1. Use D3's Graphical Layout
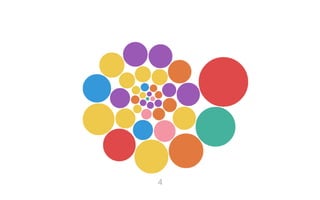
Create a pack layout with d3.layout.pack() object
var svg = d3.select('#chart').append('svg')
.attr('width', 600).attr('height', 600);
var bubble = d3.layout.pack()
.size([diameter, diameter])
// new data will be loaded to bubble layout
.value(function(d) {return d.size;})
6](https://image.slidesharecdn.com/pubnub-d3-bubble-141007185359-conversion-gate01/85/Fun-with-D3-js-Data-Visualization-Eye-Candy-with-Streaming-JSON-6-320.jpg)
![Tweak Raw JSON for D3 Pack Layout
• The pack layout is part of D3's family of hierarchical layouts
• D3 assumes that the input data is an object with a children array by
default
{children: [an array of objects]}
8](https://image.slidesharecdn.com/pubnub-d3-bubble-141007185359-conversion-gate01/85/Fun-with-D3-js-Data-Visualization-Eye-Candy-with-Streaming-JSON-8-320.jpg)
![...cont'd
function processData(data) {
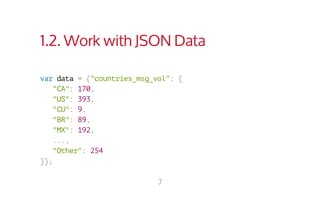
var obj = data.countries_msg_vol;
var newDataSet = [];
for(var prop in obj) {
newDataSet.push({name: prop,
className: prop.toLowerCase(), size: obj[prop]});
}
return {children: newDataSet};
}
9](https://image.slidesharecdn.com/pubnub-d3-bubble-141007185359-conversion-gate01/85/Fun-with-D3-js-Data-Visualization-Eye-Candy-with-Streaming-JSON-9-320.jpg)


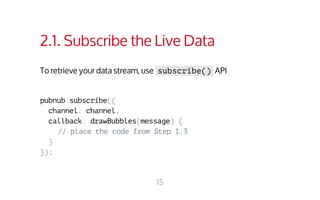

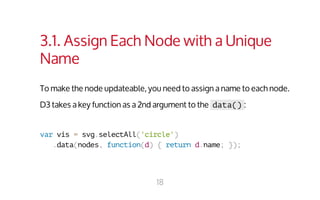
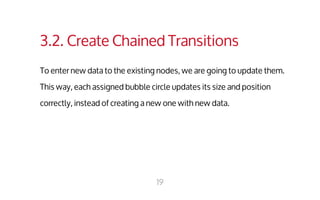
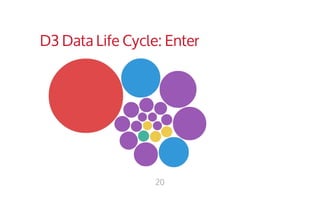

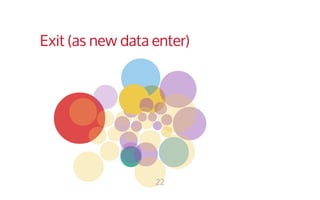
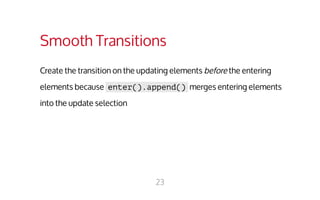


The document discusses creating dynamic bubble charts using D3.js and streaming JSON data from PubNub. It explains how to (1) create a static bubble chart with D3, (2) make the chart dynamic by subscribing to a PubNub data stream and updating the bubbles on new data, and (3) add smooth transitions as bubbles enter, update, and exit using D3's data binding and transition methods. The full article provides more details on implementing this dynamic bubble chart with animated transitions between data updates.


![[POST.Dev Japan] VS Code で試みる開発体験の向上](https://cdn.slidesharecdn.com/ss_thumbnails/post-dev-preso-ja-221001031122-f93d151f-thumbnail.jpg?width=640&height=640&fit=bounds)
![[Japan M365 Dev UG] Teams Toolkit v4 を使ってみよう!](https://cdn.slidesharecdn.com/ss_thumbnails/teams-toolkit-ga-jajp-220805195240-2ac76ea5-thumbnail.jpg?width=640&height=640&fit=bounds)
![[#DevRelAsia Keynote 2020] Developer Centric Design for Better Experience](https://cdn.slidesharecdn.com/ss_thumbnails/developer-centricdesignforbetterexperiences1-201114033033-thumbnail.jpg?width=640&height=640&fit=bounds)


![[2019 Serverless Summit] Building Serverless Slack Chatbot on IBM Cloud Func...](https://cdn.slidesharecdn.com/ss_thumbnails/2019ibmserverlesschatbot-190726190247-thumbnail.jpg?width=640&height=640&fit=bounds)
![[2019 south bay meetup] Building more contextual message with Block Kit](https://cdn.slidesharecdn.com/ss_thumbnails/2019southbaymeetupblockkitpracticalguide-190712041223-thumbnail.jpg?width=640&height=640&fit=bounds)
![[TechWorldSummit Stockholm 2019] Building Bots for Human with Conversational ...](https://cdn.slidesharecdn.com/ss_thumbnails/building2019stockholmbotsforhumanwithconversationalinterface-190604131903-thumbnail.jpg?width=640&height=640&fit=bounds)

![[日本語] Slack Bot Workshop + Intro Block Kit](https://cdn.slidesharecdn.com/ss_thumbnails/print2019jp-ibmwatsonslackbothands-onblockkit-190311140905-thumbnail.jpg?width=640&height=640&fit=bounds)
![[DevRelCon Tokyo 2019] Developer Experience Matters](https://cdn.slidesharecdn.com/ss_thumbnails/2019ver-developerexperiencematters-190309083301-thumbnail.jpg?width=640&height=640&fit=bounds)
![[DevRel Summit 2018] Because we all learn things differently](https://cdn.slidesharecdn.com/ss_thumbnails/copyofdevrelsummit2018becausewealllearnthingsdifferently-181117003934-thumbnail.jpg?width=640&height=640&fit=bounds)
![[DevRelCon July 2018] Because we all learn things differently](https://cdn.slidesharecdn.com/ss_thumbnails/becausewealllearnthingsdifferently-180715033614-thumbnail.jpg?width=640&height=640&fit=bounds)
![[Japanese] Developing a bot for your workspace 翻訳ボットを作る!](https://cdn.slidesharecdn.com/ss_thumbnails/developingabotforyourworkspace1-171116000401-thumbnail.jpg?width=640&height=640&fit=bounds)
![[Forward4 Webinar 2016] Building IoT Prototypes w/ Raspberry Pi](https://cdn.slidesharecdn.com/ss_thumbnails/raspberrypiwebinar-171022063713-thumbnail.jpg?width=640&height=640&fit=bounds)

![[DevRelCon Tokyo 2017] Creative Technical Content for Better Developer Experi...](https://cdn.slidesharecdn.com/ss_thumbnails/creativetechnicalcontentforbetterdx-170723020024-thumbnail.jpg?width=640&height=640&fit=bounds)


