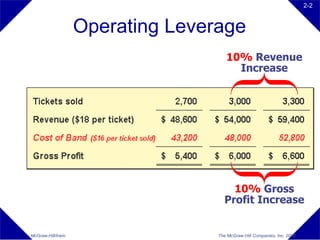
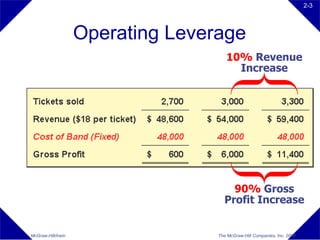
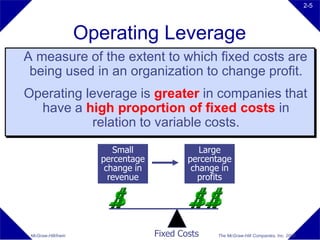
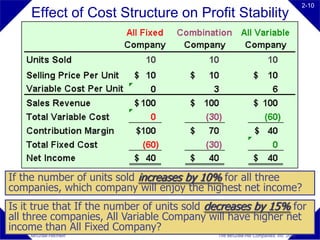
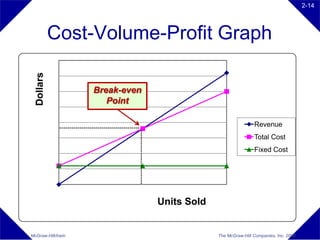
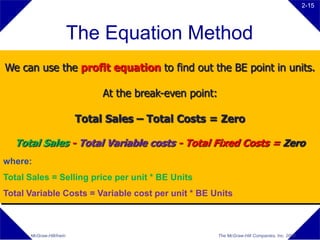
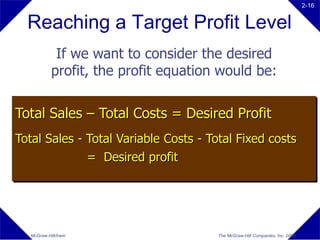
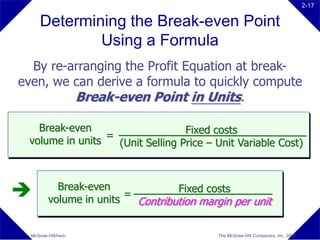
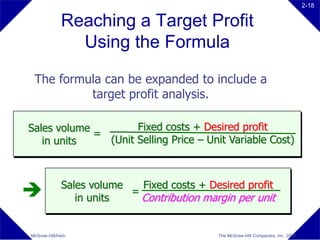
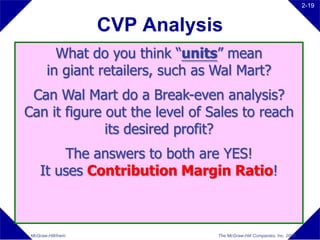
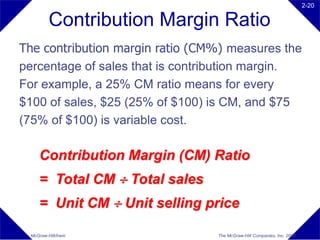
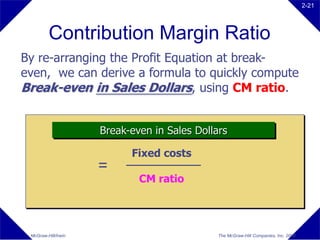
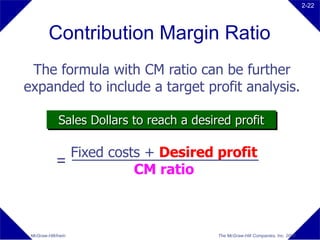
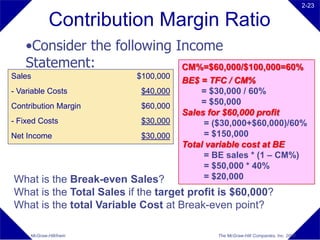
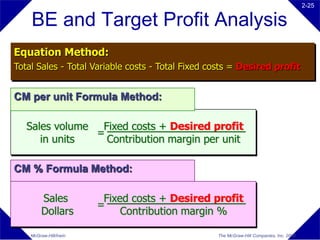
CHAPTER 5

                    Cost-Volume-
                        Profit
                    Relationships


McGraw-Hill/Irwin       The McGraw-Hill Companies, Inc. 2008
2-2


                    Operating Leverage
                                      10% Revenue
                                        Increase


                                       10% Gross
                                     Profit Increase


McGraw-Hill/Irwin                  The McGraw-Hill Companies, Inc. 2008
2-3


                    Operating Leverage
                                      10% Revenue
                                        Increase


                                       90% Gross
                                     Profit Increase


McGraw-Hill/Irwin                  The McGraw-Hill Companies, Inc. 2008
2-4


                    Lessons Learned
When all costs are variable, the potential
for profits is limited, because costs keep
           growing with volume.

 When all costs are fixed, after the fixed
costs are covered, every additional sales
  dollar contributes the whole dollar to
gross profit. The profit potential is higher.


McGraw-Hill/Irwin                The McGraw-Hill Companies, Inc. 2008
2-5


                     Operating Leverage
A measure of the extent to which fixed costs are
 being used in an organization to change profit.
Operating leverage is greater in companies that
  have a high proportion of fixed costs in
           relation to variable costs.
                          Small                Large
                       percentage           percentage
                        change in            change in
                         revenue               profits


 McGraw-Hill/Irwin                  Fixed Costs   The McGraw-Hill Companies, Inc. 2008
2-6

   Measuring Operating Leverage
     Using Contribution Margin

                    Operating       Contribution margin
                                =
                    Leverage            Net income


                                     Show me
                                    an example.


McGraw-Hill/Irwin                           The McGraw-Hill Companies, Inc. 2008
2-7

         Measuring Operating Leverage
           Using Contribution Margin


                    Operating       $20,000
                                =              = 4
                    Leverage        $5,000

            A 10% increase in sales will result in
           a 40% increase (10% × 4) in net income.
McGraw-Hill/Irwin                             The McGraw-Hill Companies, Inc. 2008
2-8

                    Operating Leverage
                                          10% Sales
                                           Increase


                                    40% Profit Increase
                          Verify: ($7,000 - $5,000) / $5,000 = 40 %

McGraw-Hill/Irwin                            The McGraw-Hill Companies, Inc. 2008
2-9

             Effect of Cost Structure
                on Profit Stability
                                                    Earnings
                      Level of   Operating
                                                    Volatility
                    Fixed Cost   Leverage
                                                     & Risk

                      High         High                  High
                       Low         Low                    Low


McGraw-Hill/Irwin                      The McGraw-Hill Companies, Inc. 2008
2-10
    Effect of Cost Structure on Profit Stability


If the number of units sold increases by 10% for all three
companies, which company will enjoy the highest net income?
Is it true that If the number of units sold decreases by 15% for
all three companies, All Variable Company will have higher net
income than All Fixed Company?
    McGraw-Hill/Irwin                        The McGraw-Hill Companies, Inc. 2008
2-11


Cost-Volume-Profit (CVP) Analysis

 CVP analysis summarizes the
  relationship between an
  organization’s volume of activity
  and its costs, revenue and profit
  within the relevant range.


McGraw-Hill/Irwin        The McGraw-Hill Companies, Inc. 2008
2-12


                     CVP Analysis
When running any business –
• The first concern is if it can sell enough to
  cover all its costs (Breakeven analysis).
• The second concern is whether it can
  reach a desired profit (Target profit
  analysis).
• The third concern is how to assess and
  select different strategies (CVP impact
  analysis)

 McGraw-Hill/Irwin               The McGraw-Hill Companies, Inc. 2008
2-13

    Determining the Break-even Point

•The break-even point is the point
where total revenue equals to total costs
(both variable and fixed), and therefore
the profit is zero.


McGraw-Hill/Irwin            The McGraw-Hill Companies, Inc. 2008
2-14


  Dollars   Cost-Volume-Profit Graph

                    Break-even
                       Point

                                                              Revenue
                                                              Total Cost
                                                              Fixed Cost


                                 Units Sold


McGraw-Hill/Irwin                             The McGraw-Hill Companies, Inc. 2008
2-15


                          The Equation Method
We can use the profit equation to find out the BE point in units.

                               At the break-even point:

                          Total Sales – Total Costs = Zero

  Total Sales - Total Variable costs - Total Fixed Costs = Zero
where:
Total Sales = Selling price per unit * BE Units
Total Variable Costs = Variable cost per unit * BE Units


      McGraw-Hill/Irwin                                   The McGraw-Hill Companies, Inc. 2008
2-16


  Reaching a Target Profit Level
             If we want to consider the desired
            profit, the profit equation would be:

Total Sales – Total Costs = Desired Profit
Total Sales - Total Variable Costs - Total Fixed costs
              = Desired profit


  McGraw-Hill/Irwin                    The McGraw-Hill Companies, Inc. 2008
2-17

      Determining the Break-even Point
              Using a Formula
  By re-arranging the Profit Equation at break-
even, we can derive a formula to quickly compute
         Break-even Point in Units.

   Break-even                     Fixed costs
                 =
 volume in units   (Unit Selling Price – Unit Variable Cost)


           Break-even
          volume in units
                          =         Fixed costs
                            Contribution margin per unit

  McGraw-Hill/Irwin                          The McGraw-Hill Companies, Inc. 2008
2-18


              Reaching a Target Profit
                Using the Formula

 The formula can be expanded to include a
          target profit analysis.

Sales volume         Fixed costs + Desired profit
             =
   in units    (Unit Selling Price – Unit Variable Cost)


              Sales volume   Fixed costs + Desired profit
                in units
                           =
                             Contribution margin per unit


McGraw-Hill/Irwin                            The McGraw-Hill Companies, Inc. 2008
2-19


                     CVP Analysis
          What do you think “units” mean
        in giant retailers, such as Wal Mart?
 Can Wal Mart do a Break-even analysis?
Can it figure out the level of Sales to reach
              its desired profit?
         The answers to both are YES!
     It uses Contribution Margin Ratio!


 McGraw-Hill/Irwin                  The McGraw-Hill Companies, Inc. 2008
2-20

         Contribution Margin Ratio
The contribution margin ratio (CM%) measures the
percentage of sales that is contribution margin.
For example, a 25% CM ratio means for every
$100 of sales, $25 (25% of $100) is CM, and $75
(75% of $100) is variable cost.

     Contribution Margin (CM) Ratio
     = Total CM  Total sales
     = Unit CM  Unit selling price

 McGraw-Hill/Irwin               The McGraw-Hill Companies, Inc. 2008
2-21


         Contribution Margin Ratio
By re-arranging the Profit Equation at break-
even, we can derive a formula to quickly compute
Break-even in Sales Dollars, using CM ratio.


                     Break-even in Sales Dollars

                           Fixed costs
                     =
                             CM ratio


 McGraw-Hill/Irwin                            The McGraw-Hill Companies, Inc. 2008
2-22


         Contribution Margin Ratio
 The formula with CM ratio can be further
expanded to include a target profit analysis.

              Sales Dollars to reach a desired profit

               Fixed costs + Desired profit
             =           CM ratio


 McGraw-Hill/Irwin                          The McGraw-Hill Companies, Inc. 2008
2-23

             Contribution Margin Ratio
    •Consider the following Income
    Statement:               CM%=$60,000/$100,000=60%
Sales                     $100,000
                                     BE$ = TFC / CM%
- Variable Costs           $40,000       = $30,000 / 60%
Contribution Margin        $60,000       = $50,000
                                     Sales for $60,000 profit
- Fixed Costs              $30,000        = ($30,000+$60,000)/60%
Net Income                 $30,000        = $150,000
                                     Total variable cost at BE
                                          = BE sales * (1 – CM%)
                                          = $50,000 * 40%
What is the Break-even Sales?             = $20,000
What is the Total Sales if the target profit is $60,000?
What is the total Variable Cost at Break-even point?

     McGraw-Hill/Irwin                       The McGraw-Hill Companies, Inc. 2008
2-24


                     CVP Impact Analysis
1.To examine the profit impact of changes
  in fixed costs, variable costs, selling price,
  and the mix of products.
2.To find out the allowable selling price,
  fixed costs, or variable costs, given a
  target level of profit.
3.Examples:


 McGraw-Hill/Irwin                  The McGraw-Hill Companies, Inc. 2008
2-25

    BE and Target Profit Analysis
Equation Method:
Total Sales - Total Variable costs - Total Fixed costs = Desired profit


CM per unit Formula Method:

   Sales volume Fixed costs + Desired profit
                =
      in units    Contribution margin per unit

CM % Formula Method:

         Sales           Fixed costs + Desired profit
                        =
         Dollars             Contribution margin %

    McGraw-Hill/Irwin                             The McGraw-Hill Companies, Inc. 2008

CVP analysis

  • 1.
    CHAPTER 5 Cost-Volume- Profit Relationships McGraw-Hill/Irwin The McGraw-Hill Companies, Inc. 2008
  • 2.
    2-2 Operating Leverage 10% Revenue Increase 10% Gross Profit Increase McGraw-Hill/Irwin The McGraw-Hill Companies, Inc. 2008
  • 3.
    2-3 Operating Leverage 10% Revenue Increase 90% Gross Profit Increase McGraw-Hill/Irwin The McGraw-Hill Companies, Inc. 2008
  • 4.
    2-4 Lessons Learned When all costs are variable, the potential for profits is limited, because costs keep growing with volume. When all costs are fixed, after the fixed costs are covered, every additional sales dollar contributes the whole dollar to gross profit. The profit potential is higher. McGraw-Hill/Irwin The McGraw-Hill Companies, Inc. 2008
  • 5.
    2-5 Operating Leverage A measure of the extent to which fixed costs are being used in an organization to change profit. Operating leverage is greater in companies that have a high proportion of fixed costs in relation to variable costs. Small Large percentage percentage change in change in revenue profits McGraw-Hill/Irwin Fixed Costs The McGraw-Hill Companies, Inc. 2008
  • 6.
    2-6 Measuring Operating Leverage Using Contribution Margin Operating Contribution margin = Leverage Net income Show me an example. McGraw-Hill/Irwin The McGraw-Hill Companies, Inc. 2008
  • 7.
    2-7 Measuring Operating Leverage Using Contribution Margin Operating $20,000 = = 4 Leverage $5,000 A 10% increase in sales will result in a 40% increase (10% × 4) in net income. McGraw-Hill/Irwin The McGraw-Hill Companies, Inc. 2008
  • 8.
    2-8 Operating Leverage 10% Sales Increase 40% Profit Increase Verify: ($7,000 - $5,000) / $5,000 = 40 % McGraw-Hill/Irwin The McGraw-Hill Companies, Inc. 2008
  • 9.
    2-9 Effect of Cost Structure on Profit Stability Earnings Level of Operating Volatility Fixed Cost Leverage & Risk High High High Low Low Low McGraw-Hill/Irwin The McGraw-Hill Companies, Inc. 2008
  • 10.
    2-10 Effect of Cost Structure on Profit Stability If the number of units sold increases by 10% for all three companies, which company will enjoy the highest net income? Is it true that If the number of units sold decreases by 15% for all three companies, All Variable Company will have higher net income than All Fixed Company? McGraw-Hill/Irwin The McGraw-Hill Companies, Inc. 2008
  • 11.
    2-11 Cost-Volume-Profit (CVP) Analysis CVP analysis summarizes the relationship between an organization’s volume of activity and its costs, revenue and profit within the relevant range. McGraw-Hill/Irwin The McGraw-Hill Companies, Inc. 2008
  • 12.
    2-12 CVP Analysis When running any business – • The first concern is if it can sell enough to cover all its costs (Breakeven analysis). • The second concern is whether it can reach a desired profit (Target profit analysis). • The third concern is how to assess and select different strategies (CVP impact analysis) McGraw-Hill/Irwin The McGraw-Hill Companies, Inc. 2008
  • 13.
    2-13 Determining the Break-even Point •The break-even point is the point where total revenue equals to total costs (both variable and fixed), and therefore the profit is zero. McGraw-Hill/Irwin The McGraw-Hill Companies, Inc. 2008
  • 14.
    2-14 Dollars Cost-Volume-Profit Graph Break-even Point Revenue Total Cost Fixed Cost Units Sold McGraw-Hill/Irwin The McGraw-Hill Companies, Inc. 2008
  • 15.
    2-15 The Equation Method We can use the profit equation to find out the BE point in units. At the break-even point: Total Sales – Total Costs = Zero Total Sales - Total Variable costs - Total Fixed Costs = Zero where: Total Sales = Selling price per unit * BE Units Total Variable Costs = Variable cost per unit * BE Units McGraw-Hill/Irwin The McGraw-Hill Companies, Inc. 2008
  • 16.
    2-16 Reachinga Target Profit Level If we want to consider the desired profit, the profit equation would be: Total Sales – Total Costs = Desired Profit Total Sales - Total Variable Costs - Total Fixed costs = Desired profit McGraw-Hill/Irwin The McGraw-Hill Companies, Inc. 2008
  • 17.
    2-17 Determining the Break-even Point Using a Formula By re-arranging the Profit Equation at break- even, we can derive a formula to quickly compute Break-even Point in Units. Break-even Fixed costs = volume in units (Unit Selling Price – Unit Variable Cost)  Break-even volume in units = Fixed costs Contribution margin per unit McGraw-Hill/Irwin The McGraw-Hill Companies, Inc. 2008
  • 18.
    2-18 Reaching a Target Profit Using the Formula The formula can be expanded to include a target profit analysis. Sales volume Fixed costs + Desired profit = in units (Unit Selling Price – Unit Variable Cost) Sales volume Fixed costs + Desired profit  in units = Contribution margin per unit McGraw-Hill/Irwin The McGraw-Hill Companies, Inc. 2008
  • 19.
    2-19 CVP Analysis What do you think “units” mean in giant retailers, such as Wal Mart? Can Wal Mart do a Break-even analysis? Can it figure out the level of Sales to reach its desired profit? The answers to both are YES! It uses Contribution Margin Ratio! McGraw-Hill/Irwin The McGraw-Hill Companies, Inc. 2008
  • 20.
    2-20 Contribution Margin Ratio The contribution margin ratio (CM%) measures the percentage of sales that is contribution margin. For example, a 25% CM ratio means for every $100 of sales, $25 (25% of $100) is CM, and $75 (75% of $100) is variable cost. Contribution Margin (CM) Ratio = Total CM  Total sales = Unit CM  Unit selling price McGraw-Hill/Irwin The McGraw-Hill Companies, Inc. 2008
  • 21.
    2-21 Contribution Margin Ratio By re-arranging the Profit Equation at break- even, we can derive a formula to quickly compute Break-even in Sales Dollars, using CM ratio. Break-even in Sales Dollars Fixed costs = CM ratio McGraw-Hill/Irwin The McGraw-Hill Companies, Inc. 2008
  • 22.
    2-22 Contribution Margin Ratio The formula with CM ratio can be further expanded to include a target profit analysis. Sales Dollars to reach a desired profit Fixed costs + Desired profit = CM ratio McGraw-Hill/Irwin The McGraw-Hill Companies, Inc. 2008
  • 23.
    2-23 Contribution Margin Ratio •Consider the following Income Statement: CM%=$60,000/$100,000=60% Sales $100,000 BE$ = TFC / CM% - Variable Costs $40,000 = $30,000 / 60% Contribution Margin $60,000 = $50,000 Sales for $60,000 profit - Fixed Costs $30,000 = ($30,000+$60,000)/60% Net Income $30,000 = $150,000 Total variable cost at BE = BE sales * (1 – CM%) = $50,000 * 40% What is the Break-even Sales? = $20,000 What is the Total Sales if the target profit is $60,000? What is the total Variable Cost at Break-even point? McGraw-Hill/Irwin The McGraw-Hill Companies, Inc. 2008
  • 24.
    2-24 CVP Impact Analysis 1.To examine the profit impact of changes in fixed costs, variable costs, selling price, and the mix of products. 2.To find out the allowable selling price, fixed costs, or variable costs, given a target level of profit. 3.Examples: McGraw-Hill/Irwin The McGraw-Hill Companies, Inc. 2008
  • 25.
    2-25 BE and Target Profit Analysis Equation Method: Total Sales - Total Variable costs - Total Fixed costs = Desired profit CM per unit Formula Method: Sales volume Fixed costs + Desired profit = in units Contribution margin per unit CM % Formula Method: Sales Fixed costs + Desired profit = Dollars Contribution margin % McGraw-Hill/Irwin The McGraw-Hill Companies, Inc. 2008