Download as PDF, PPTX


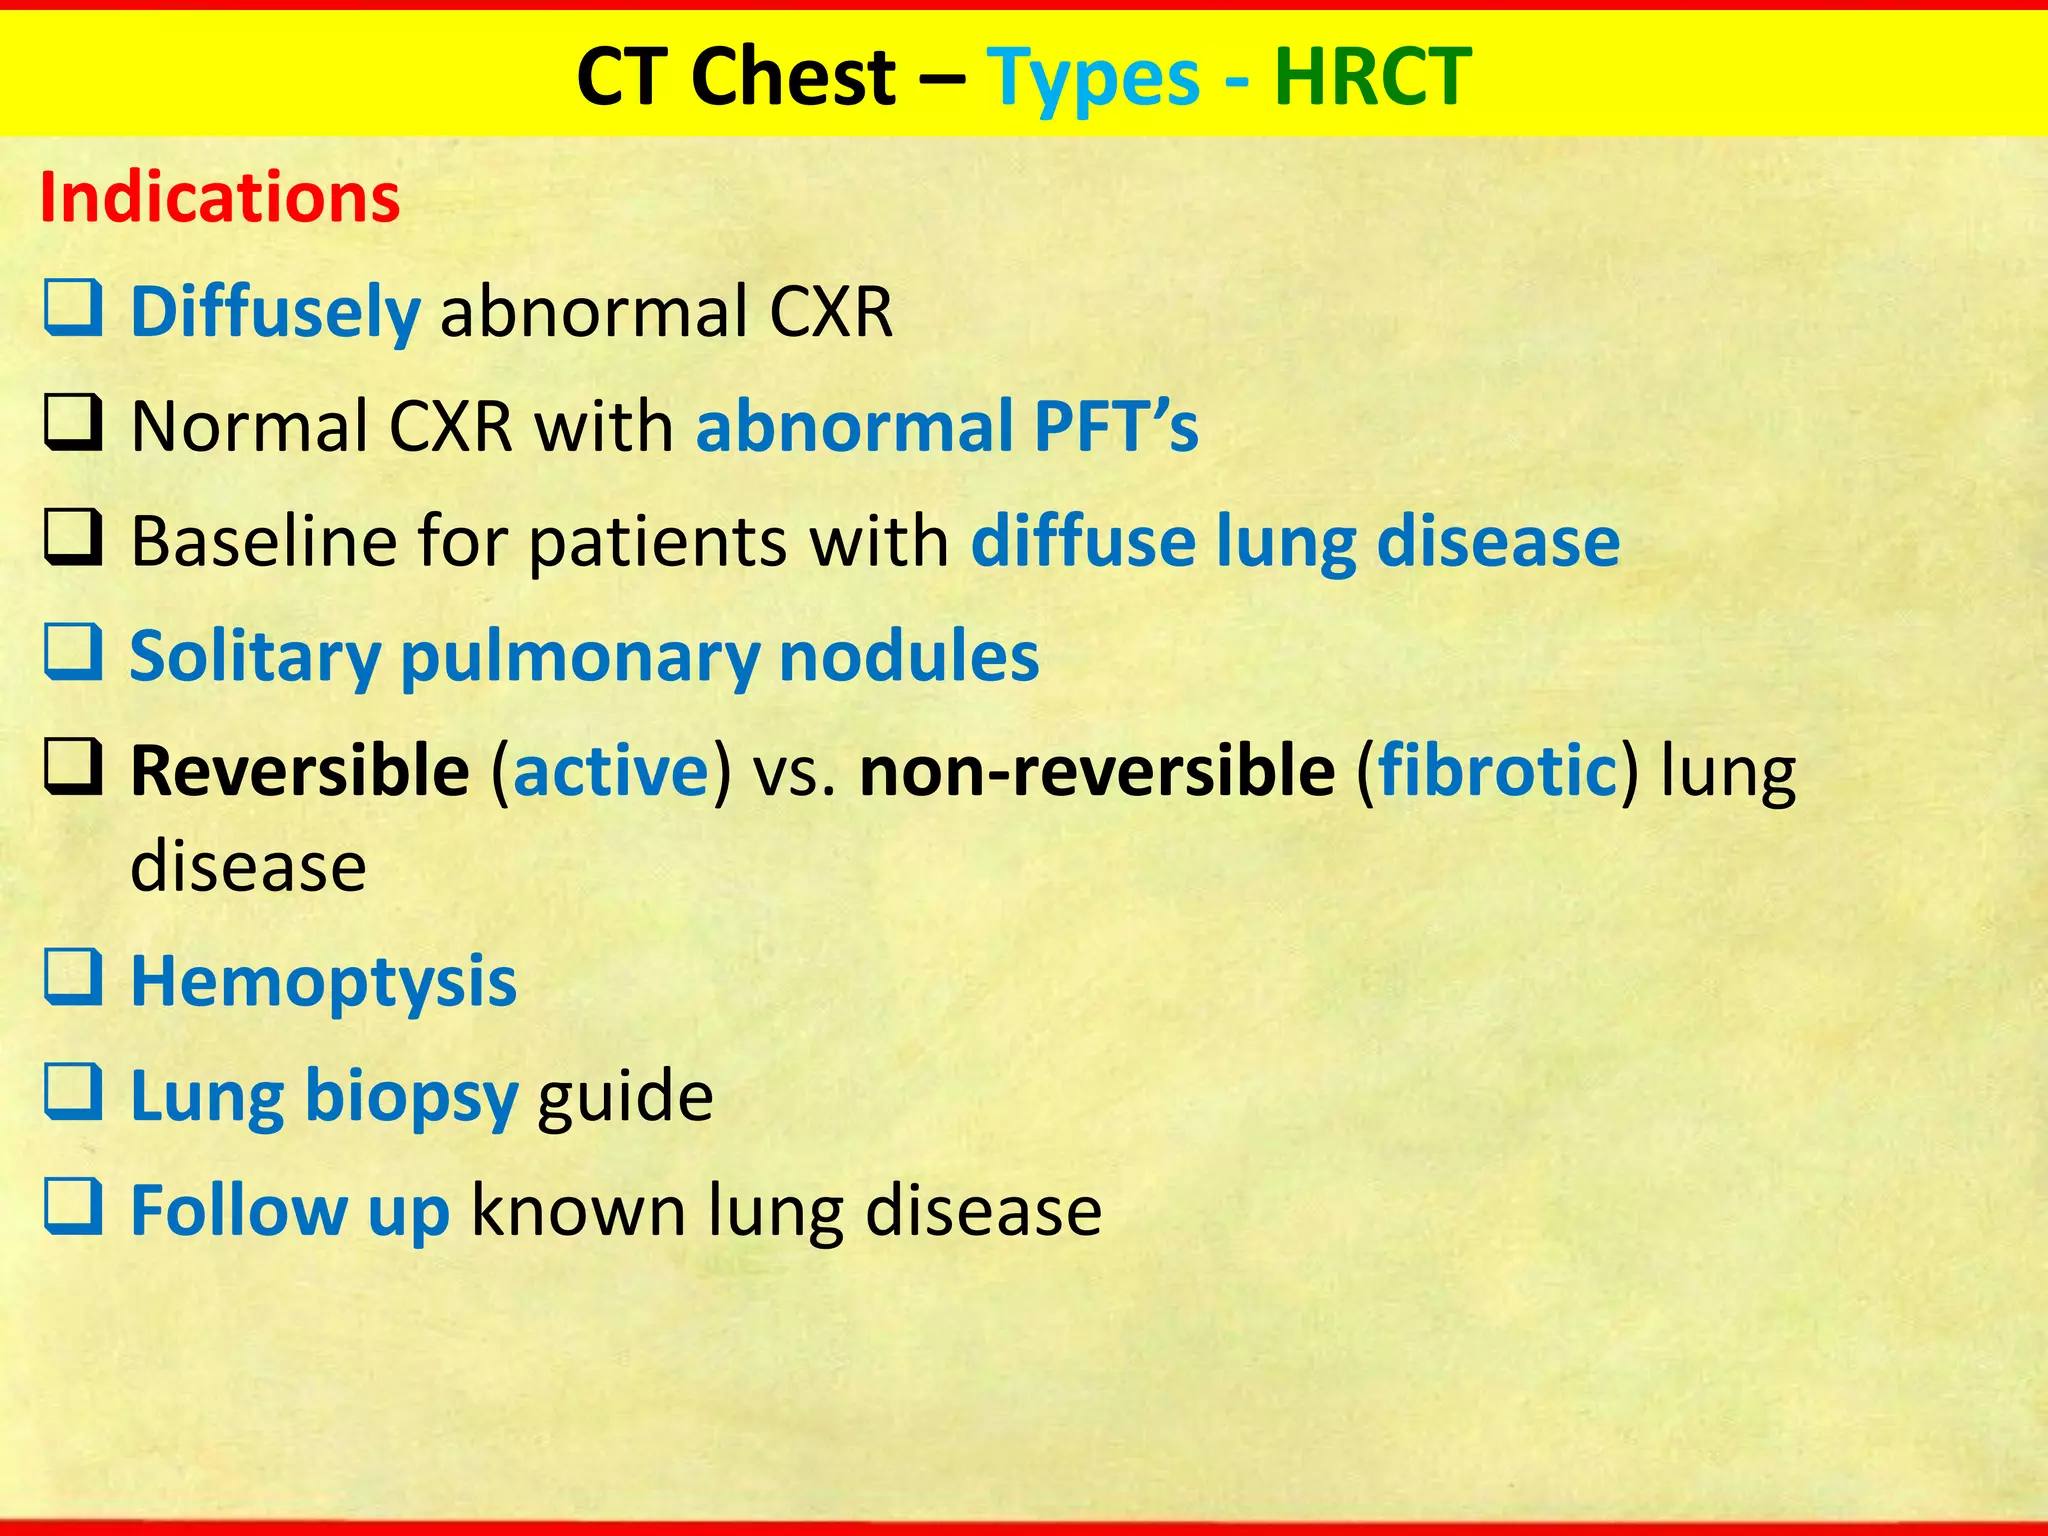

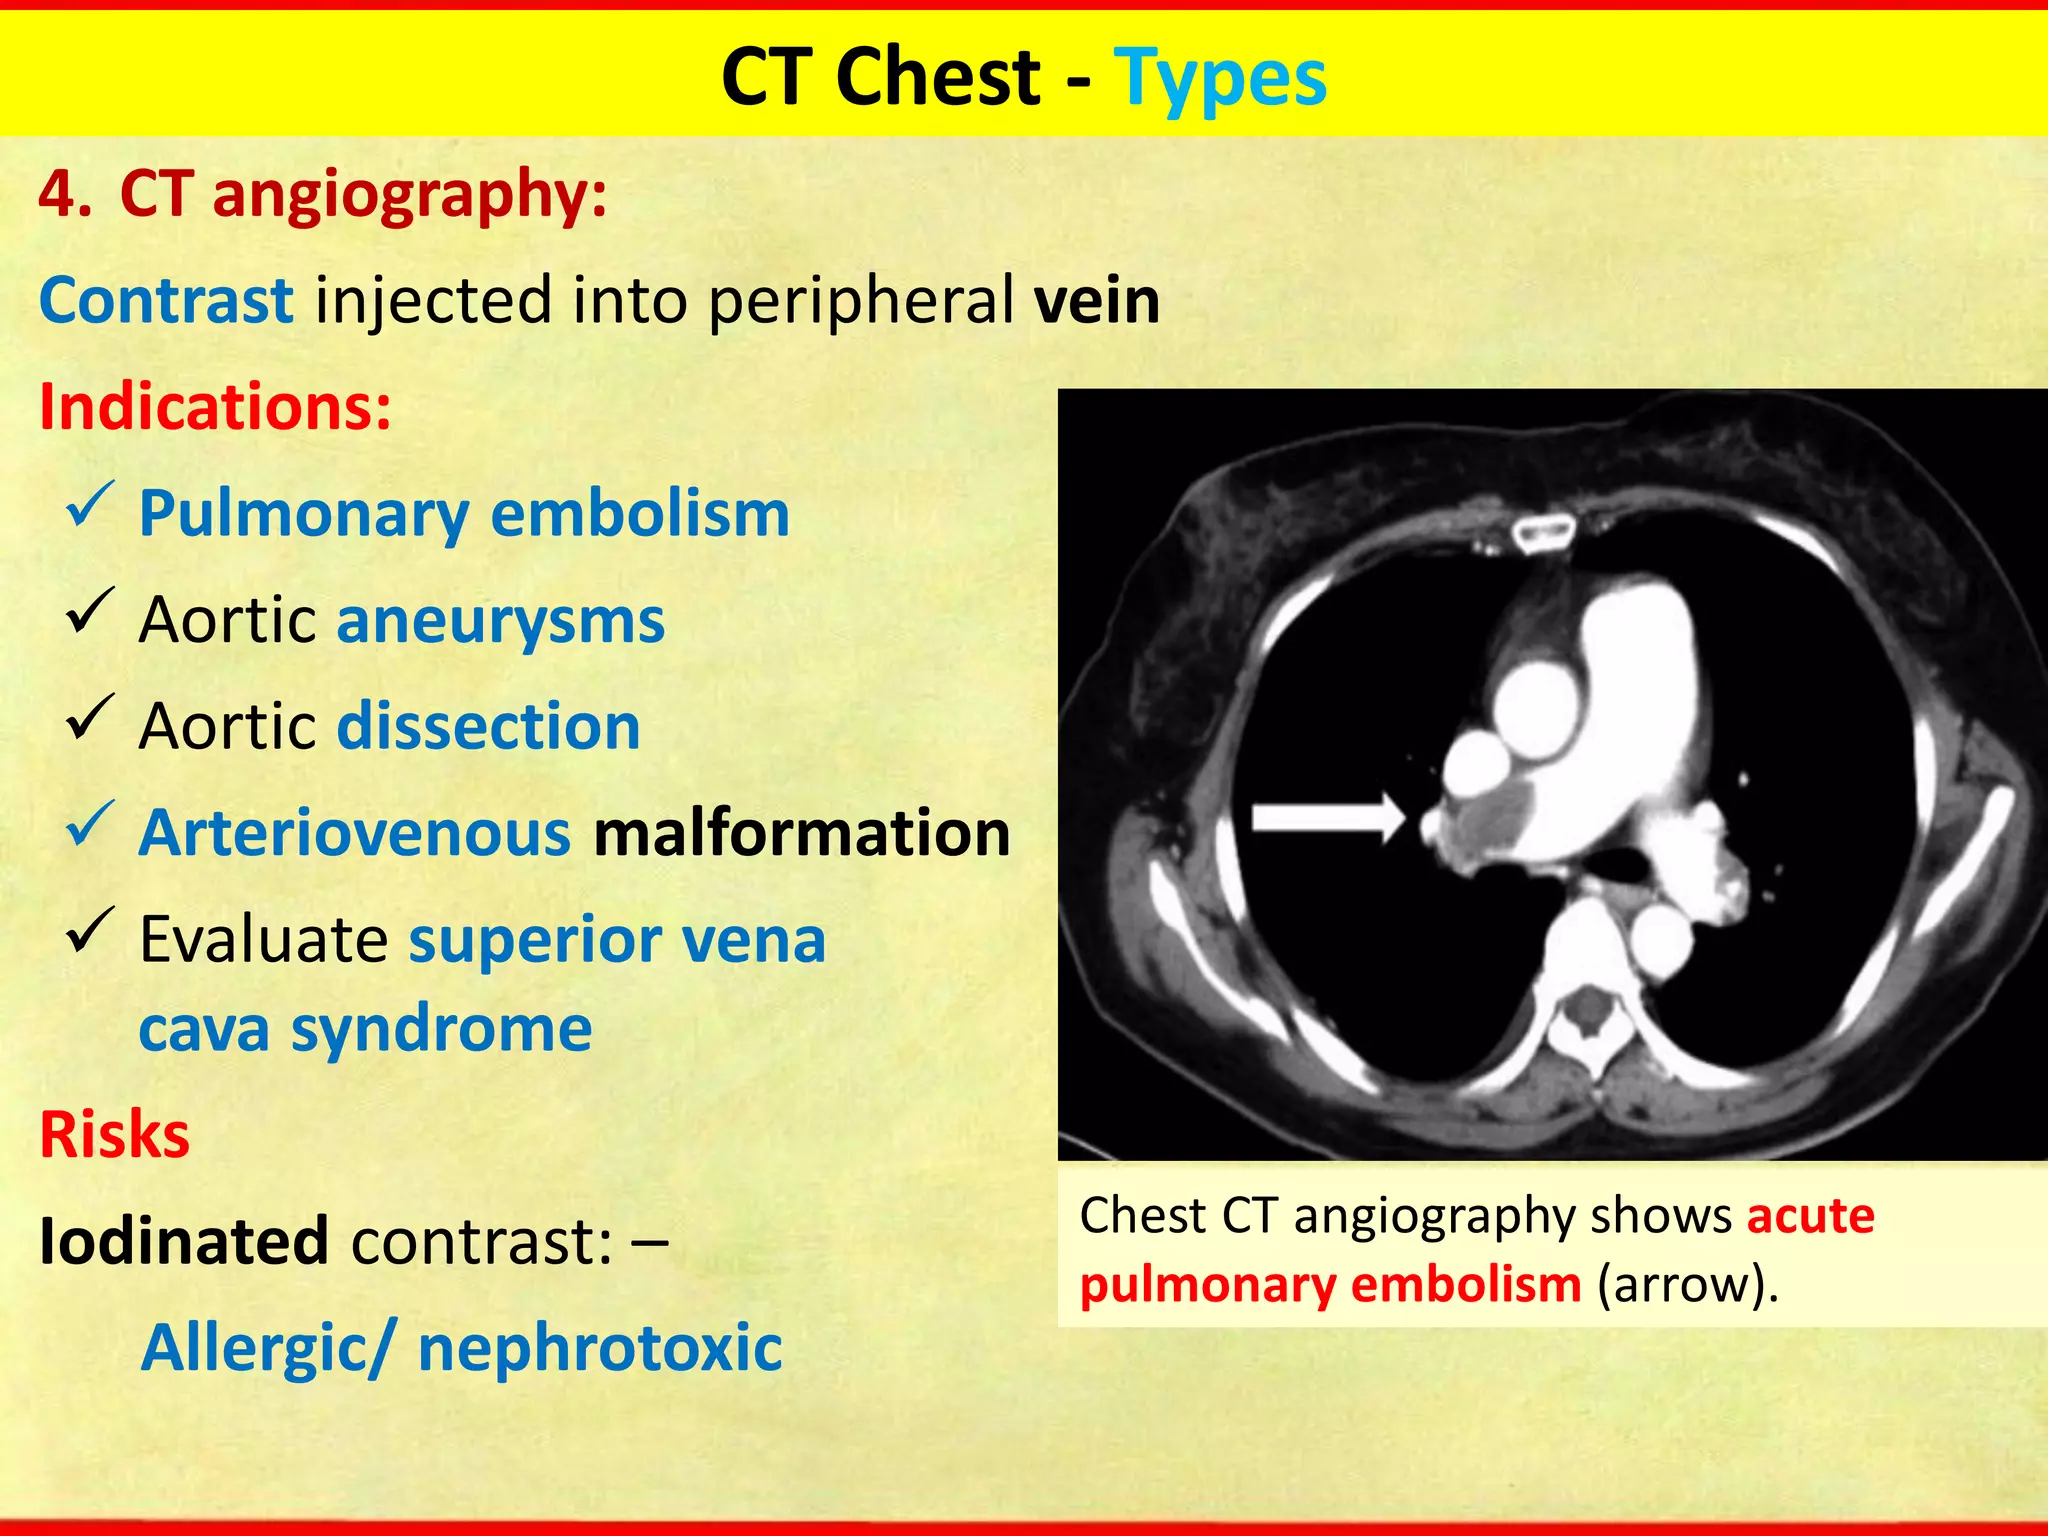


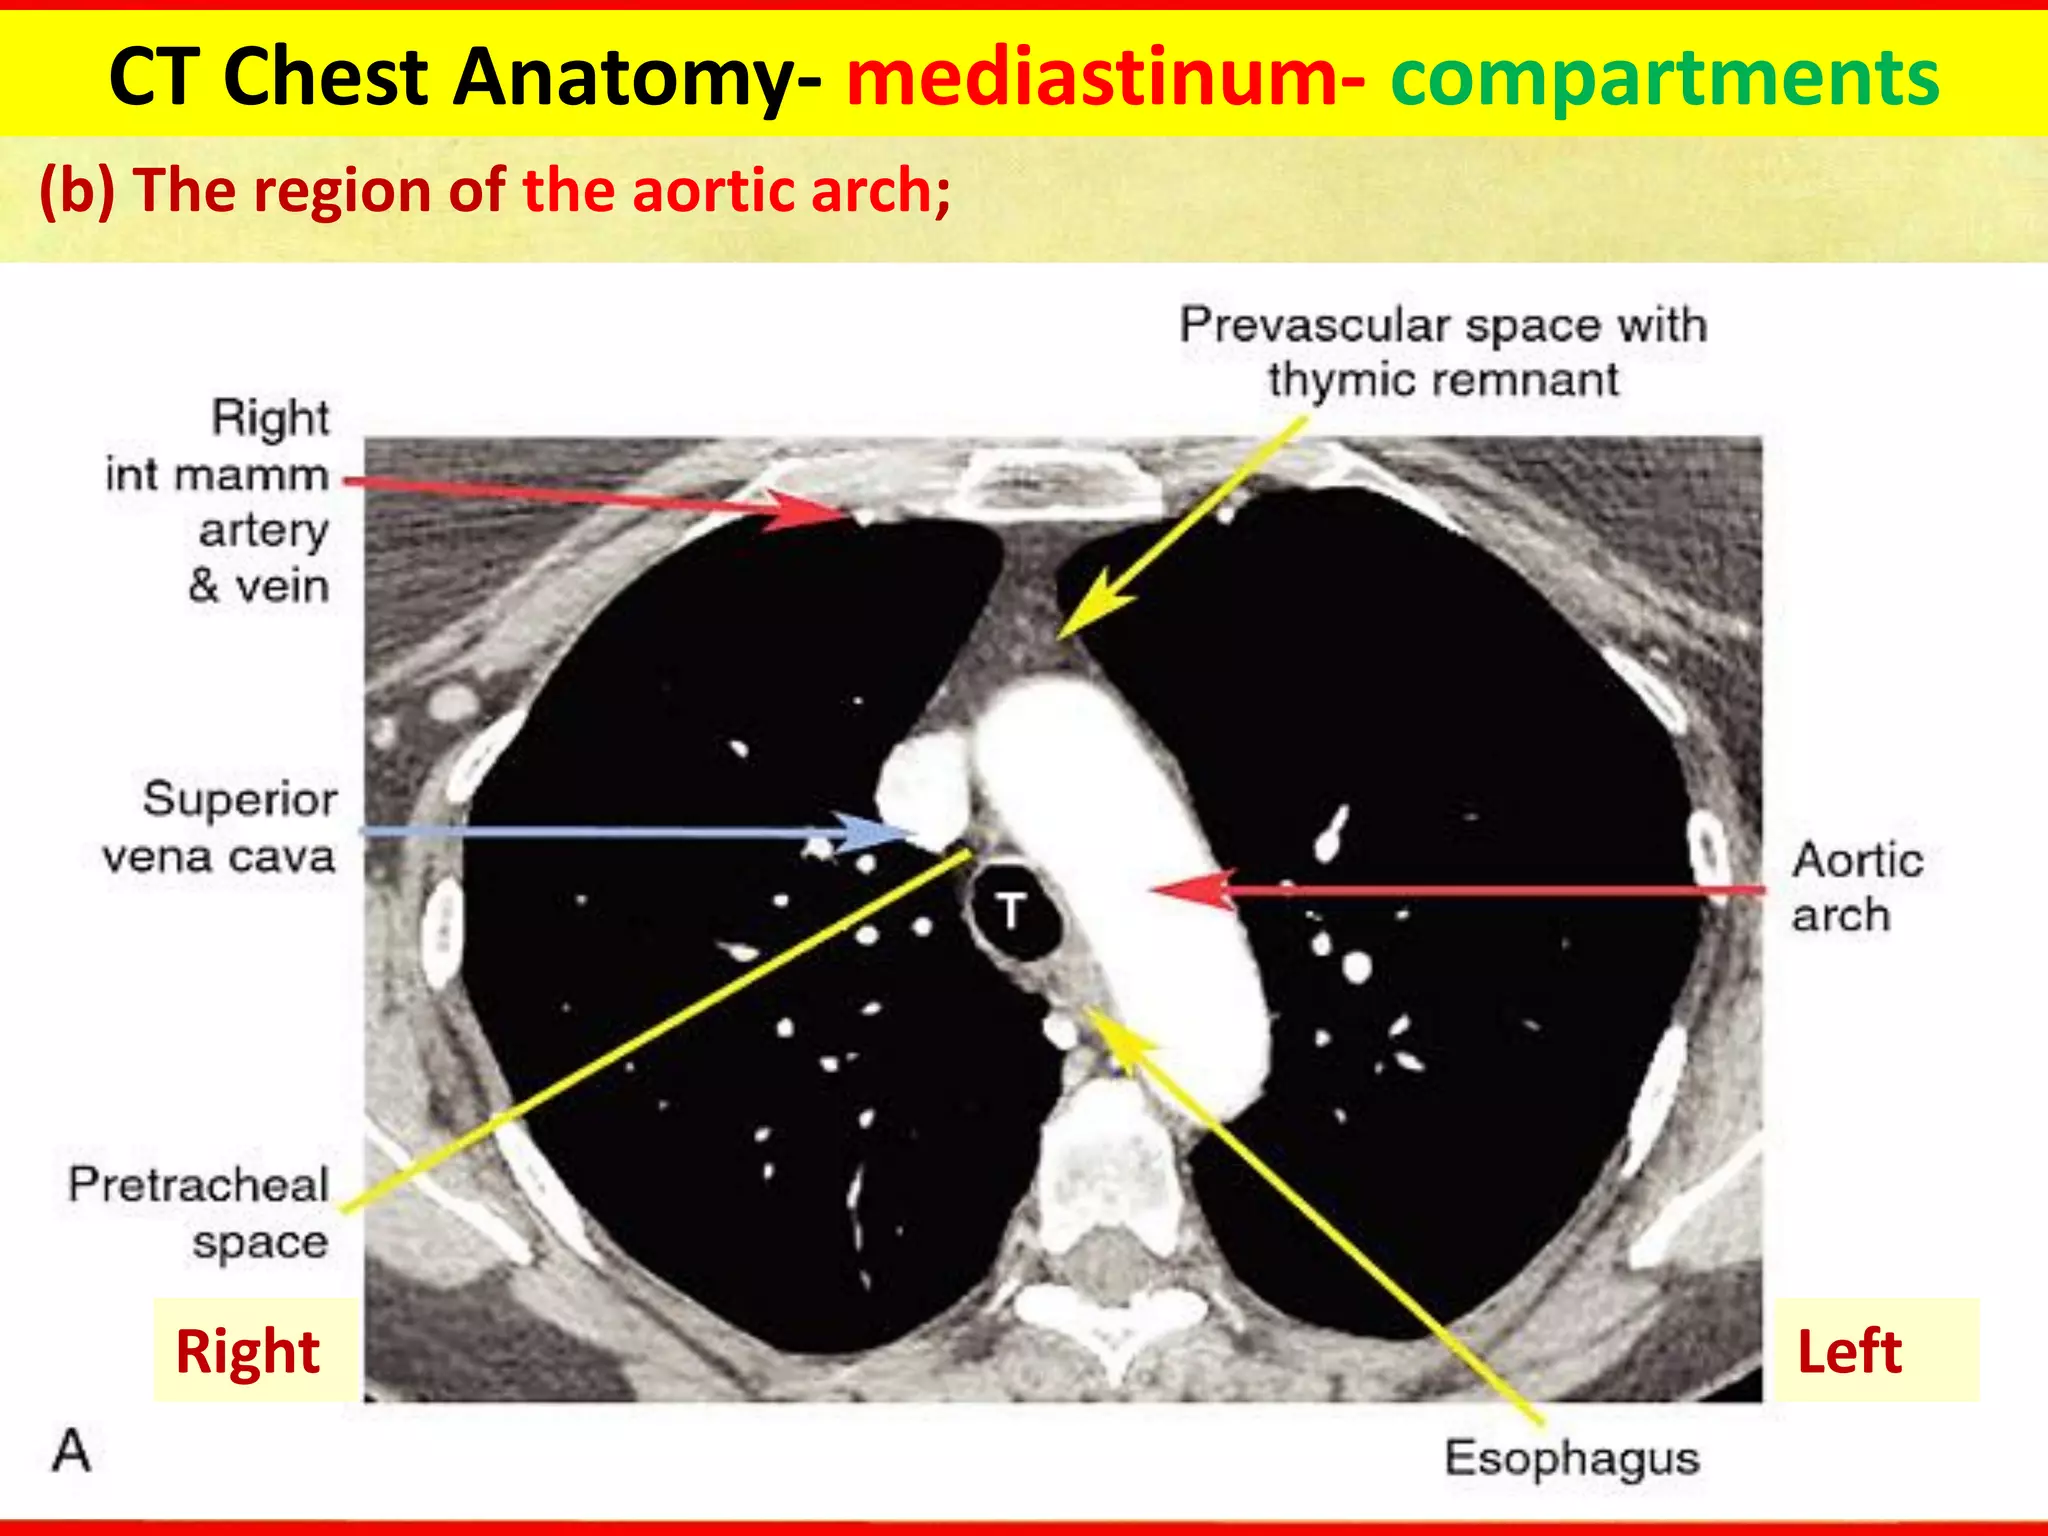
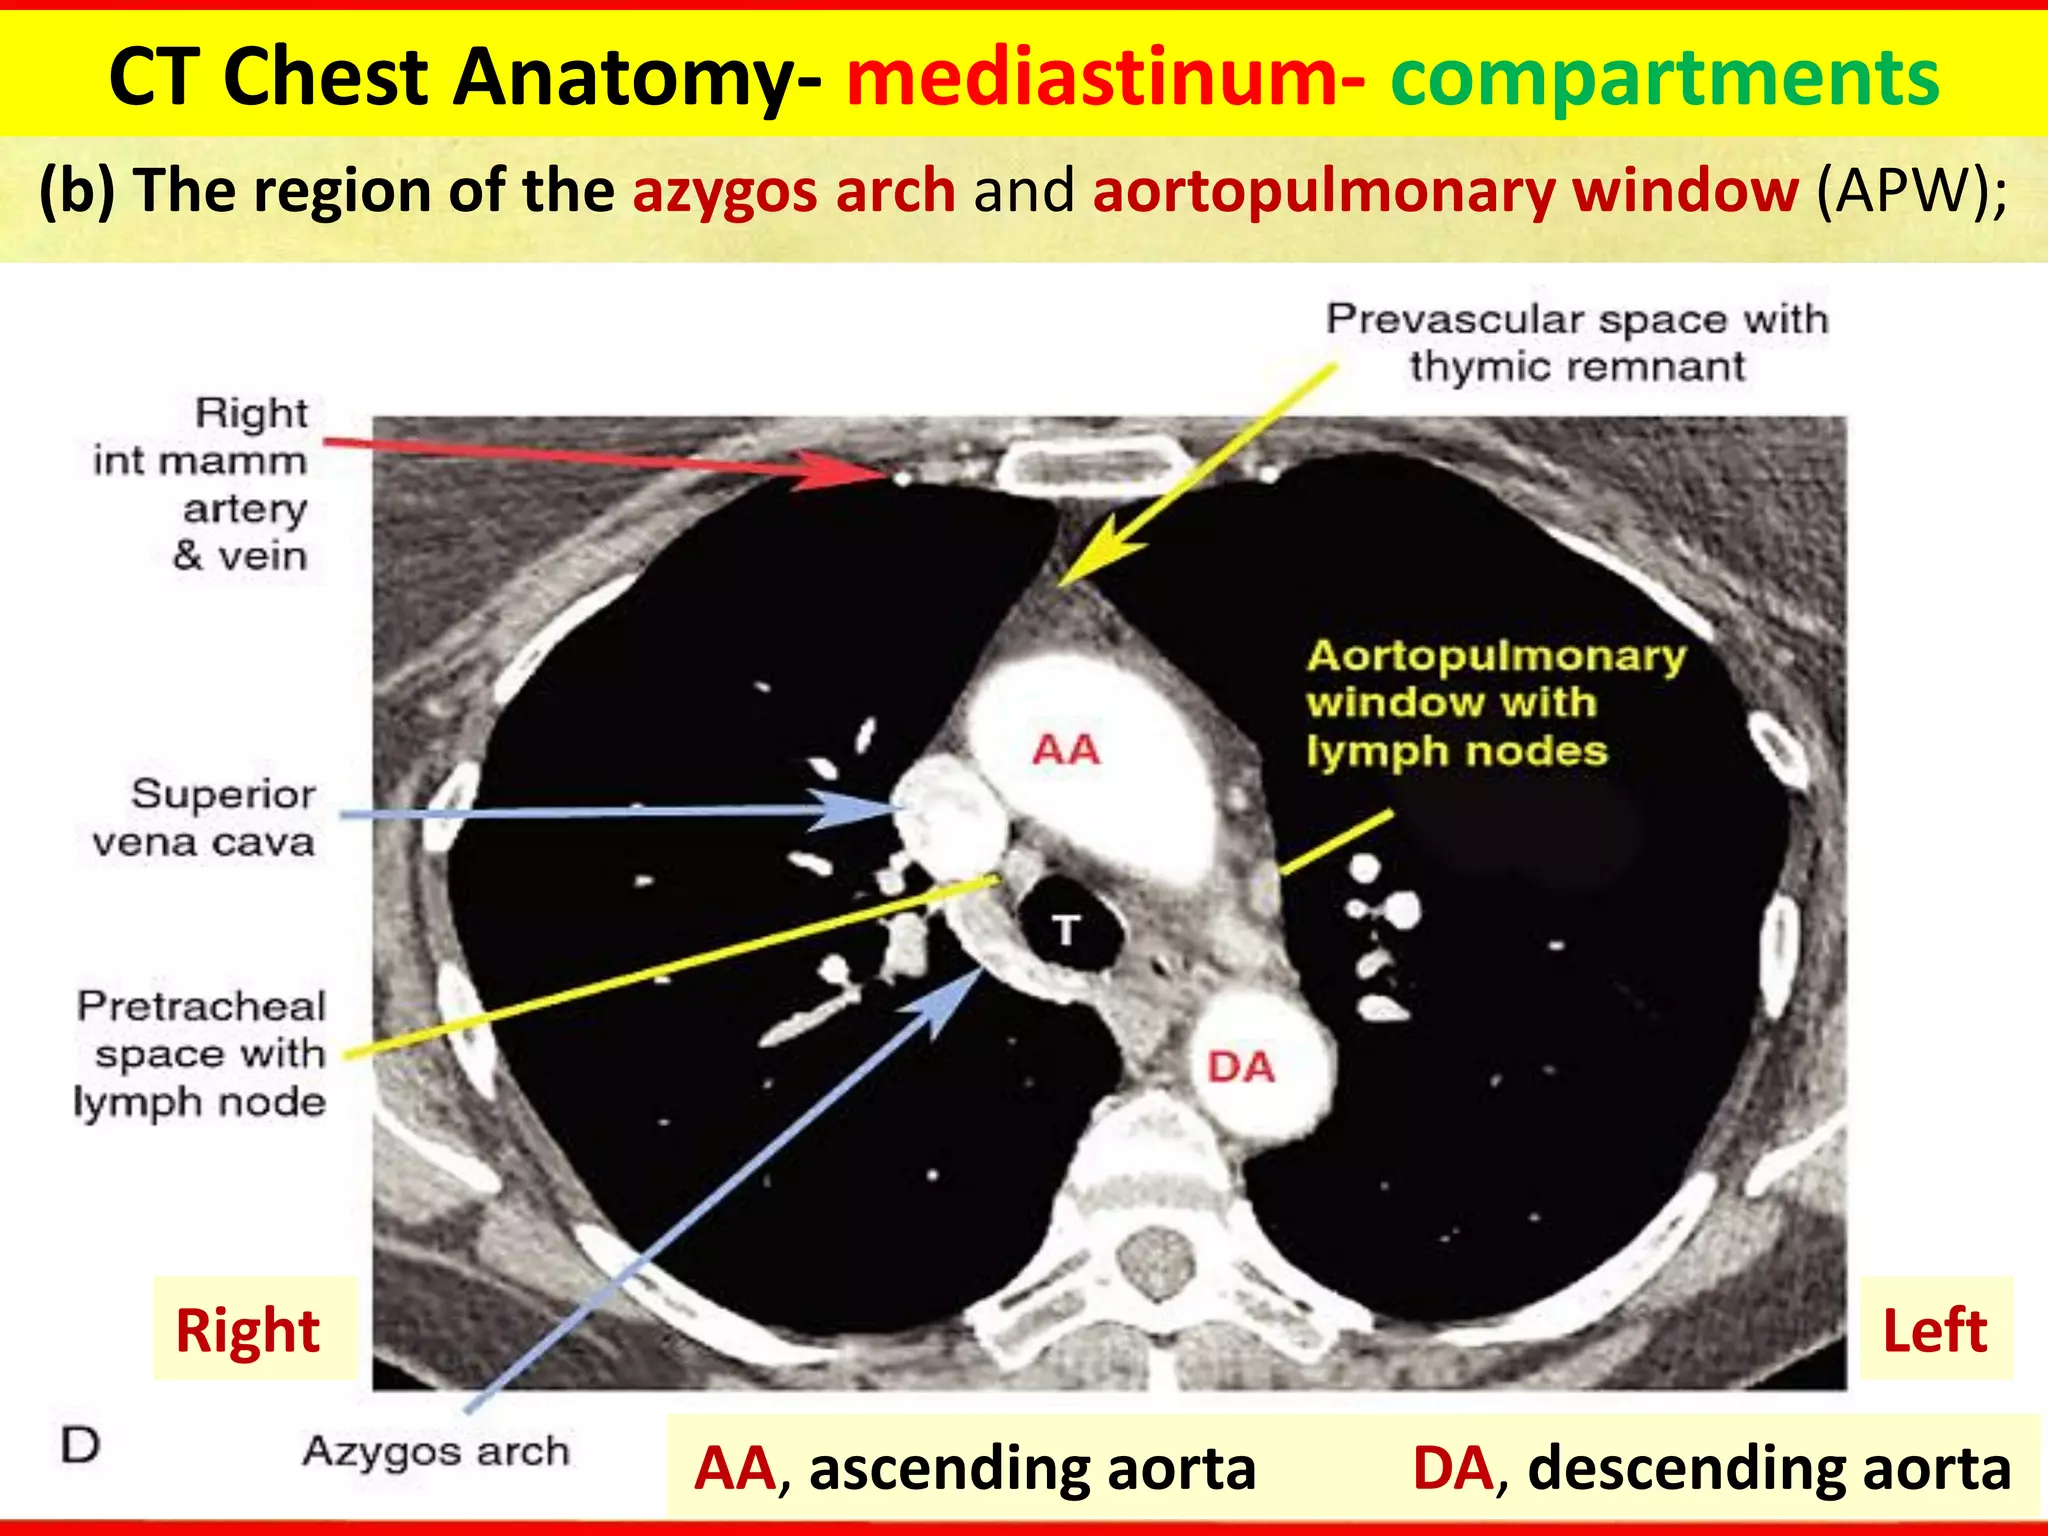


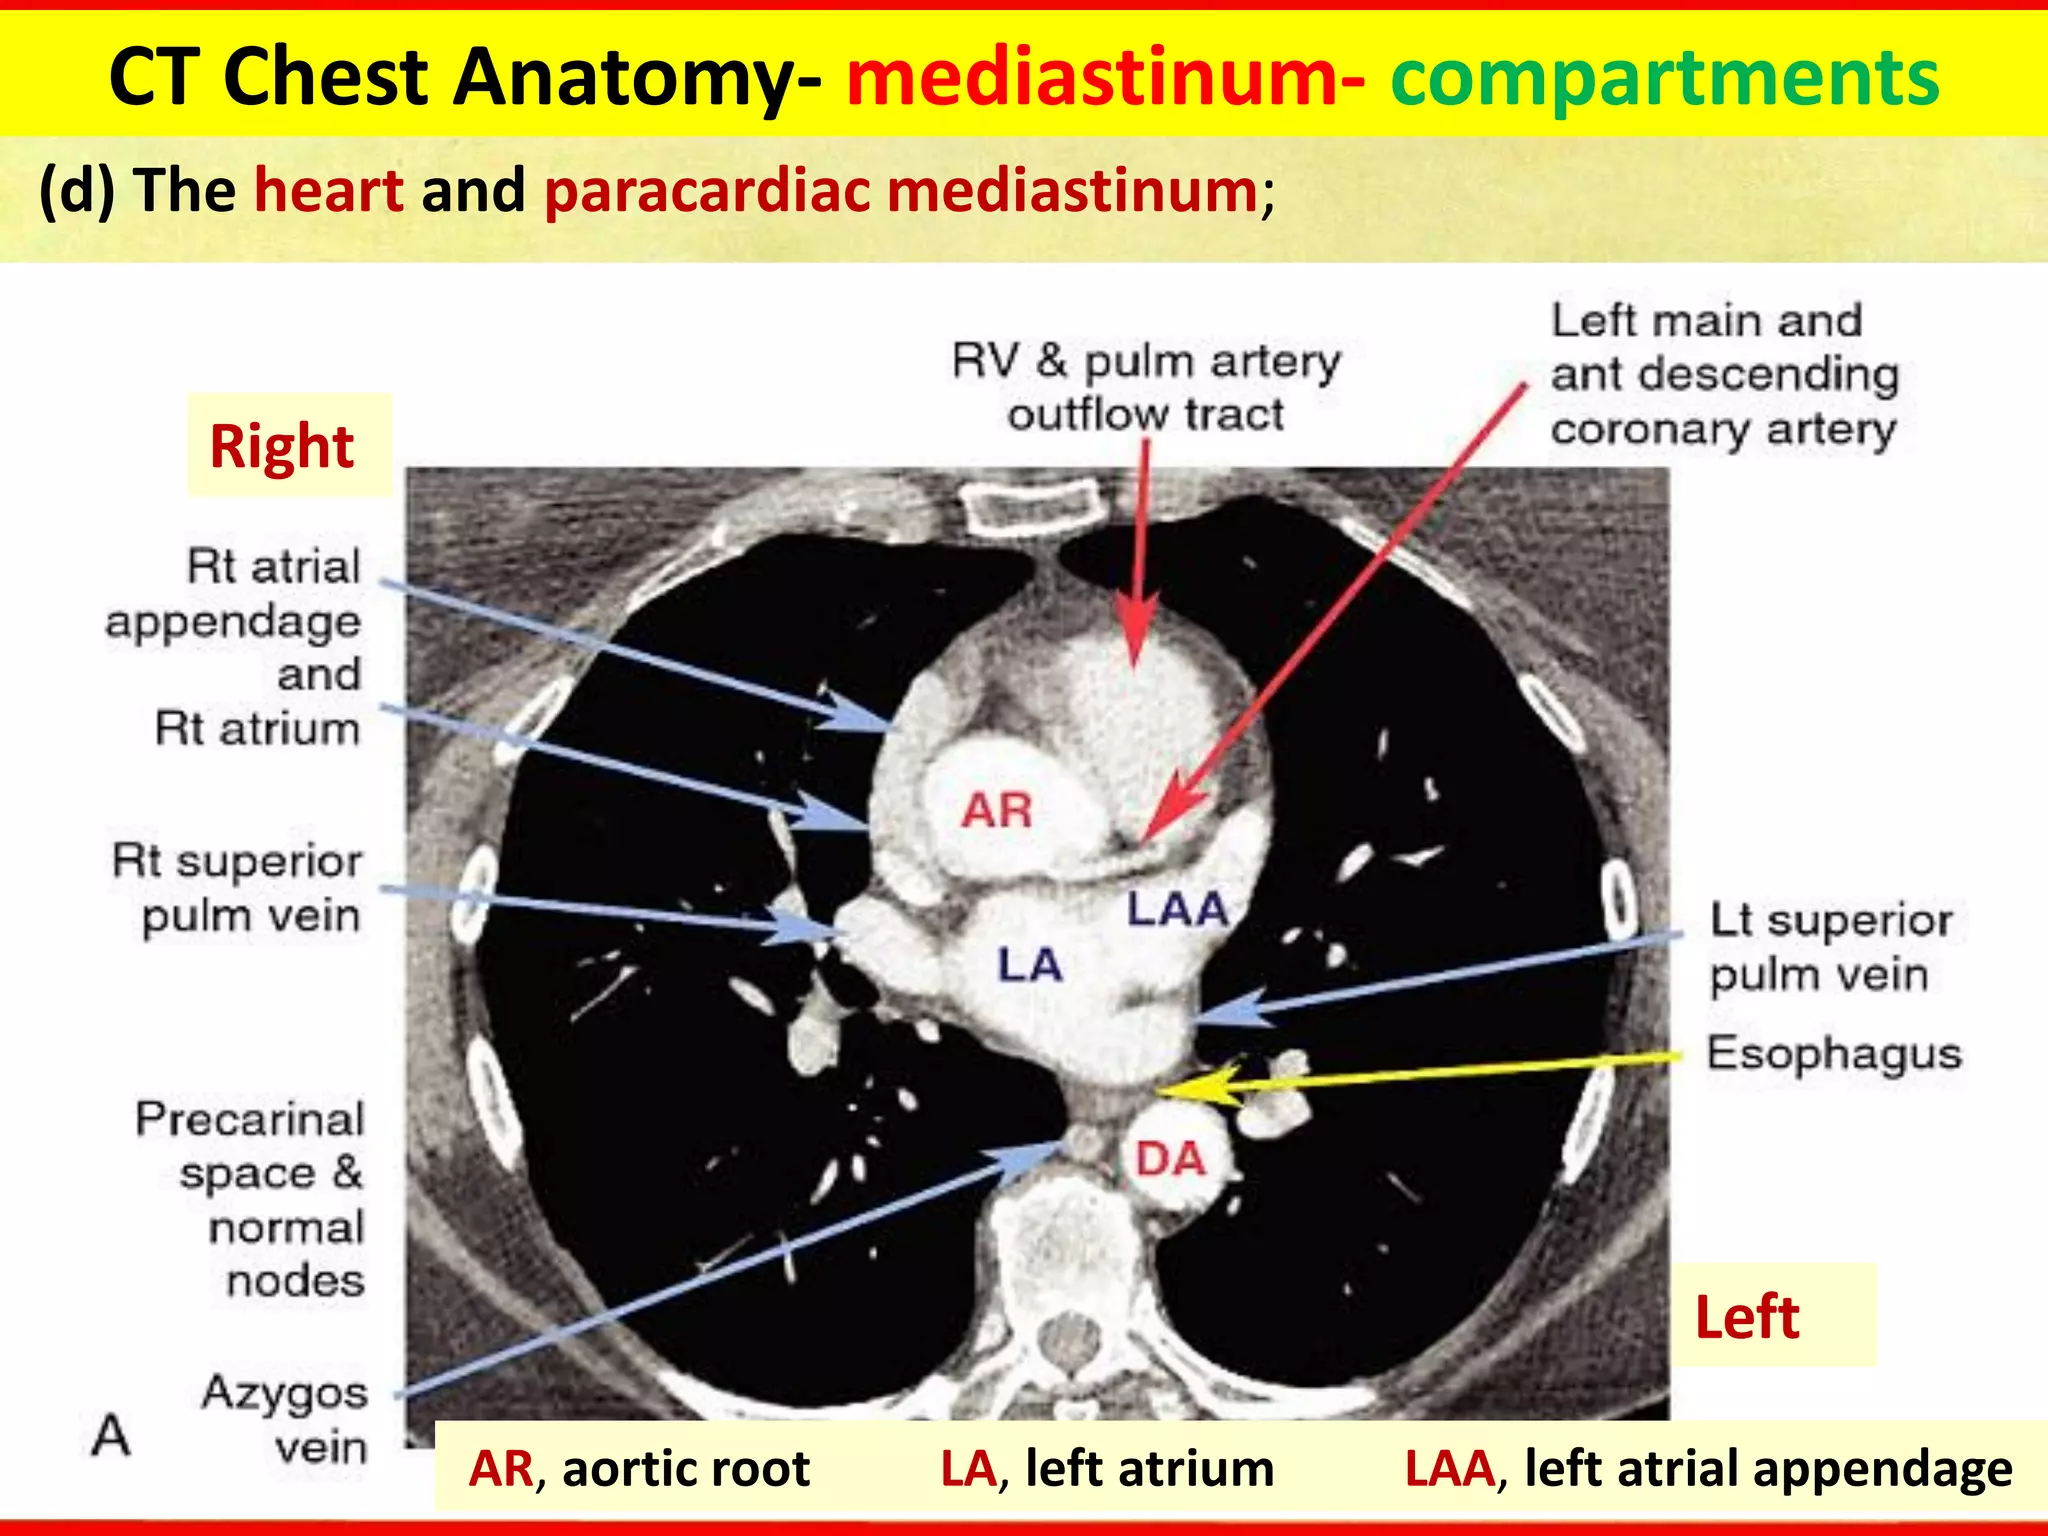


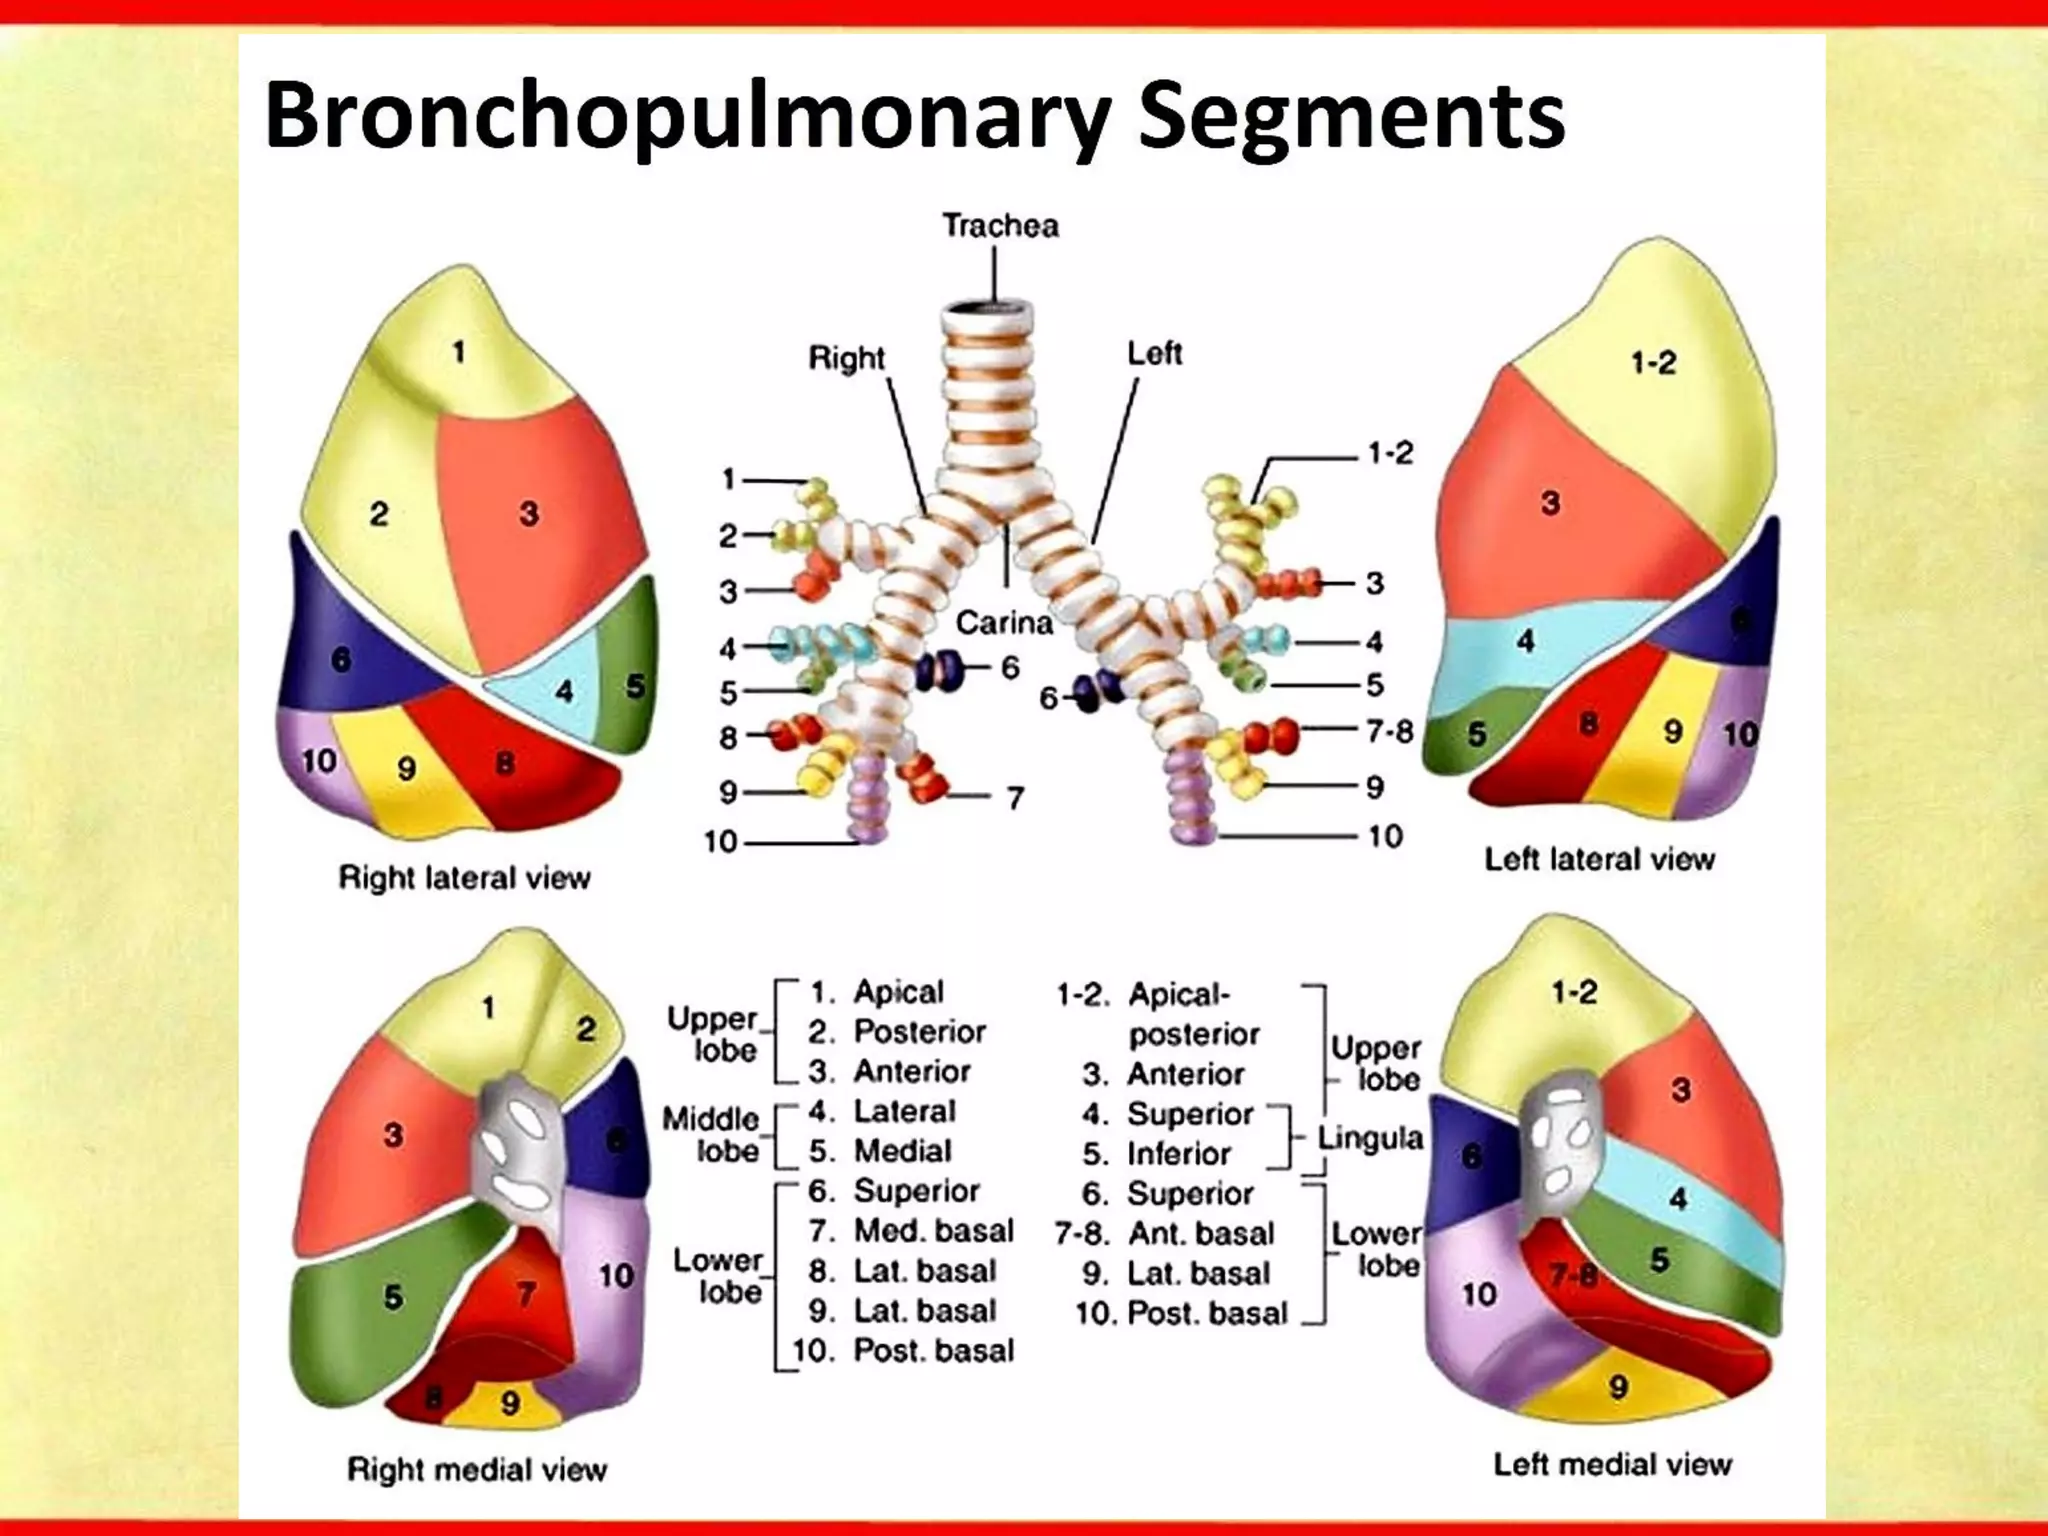
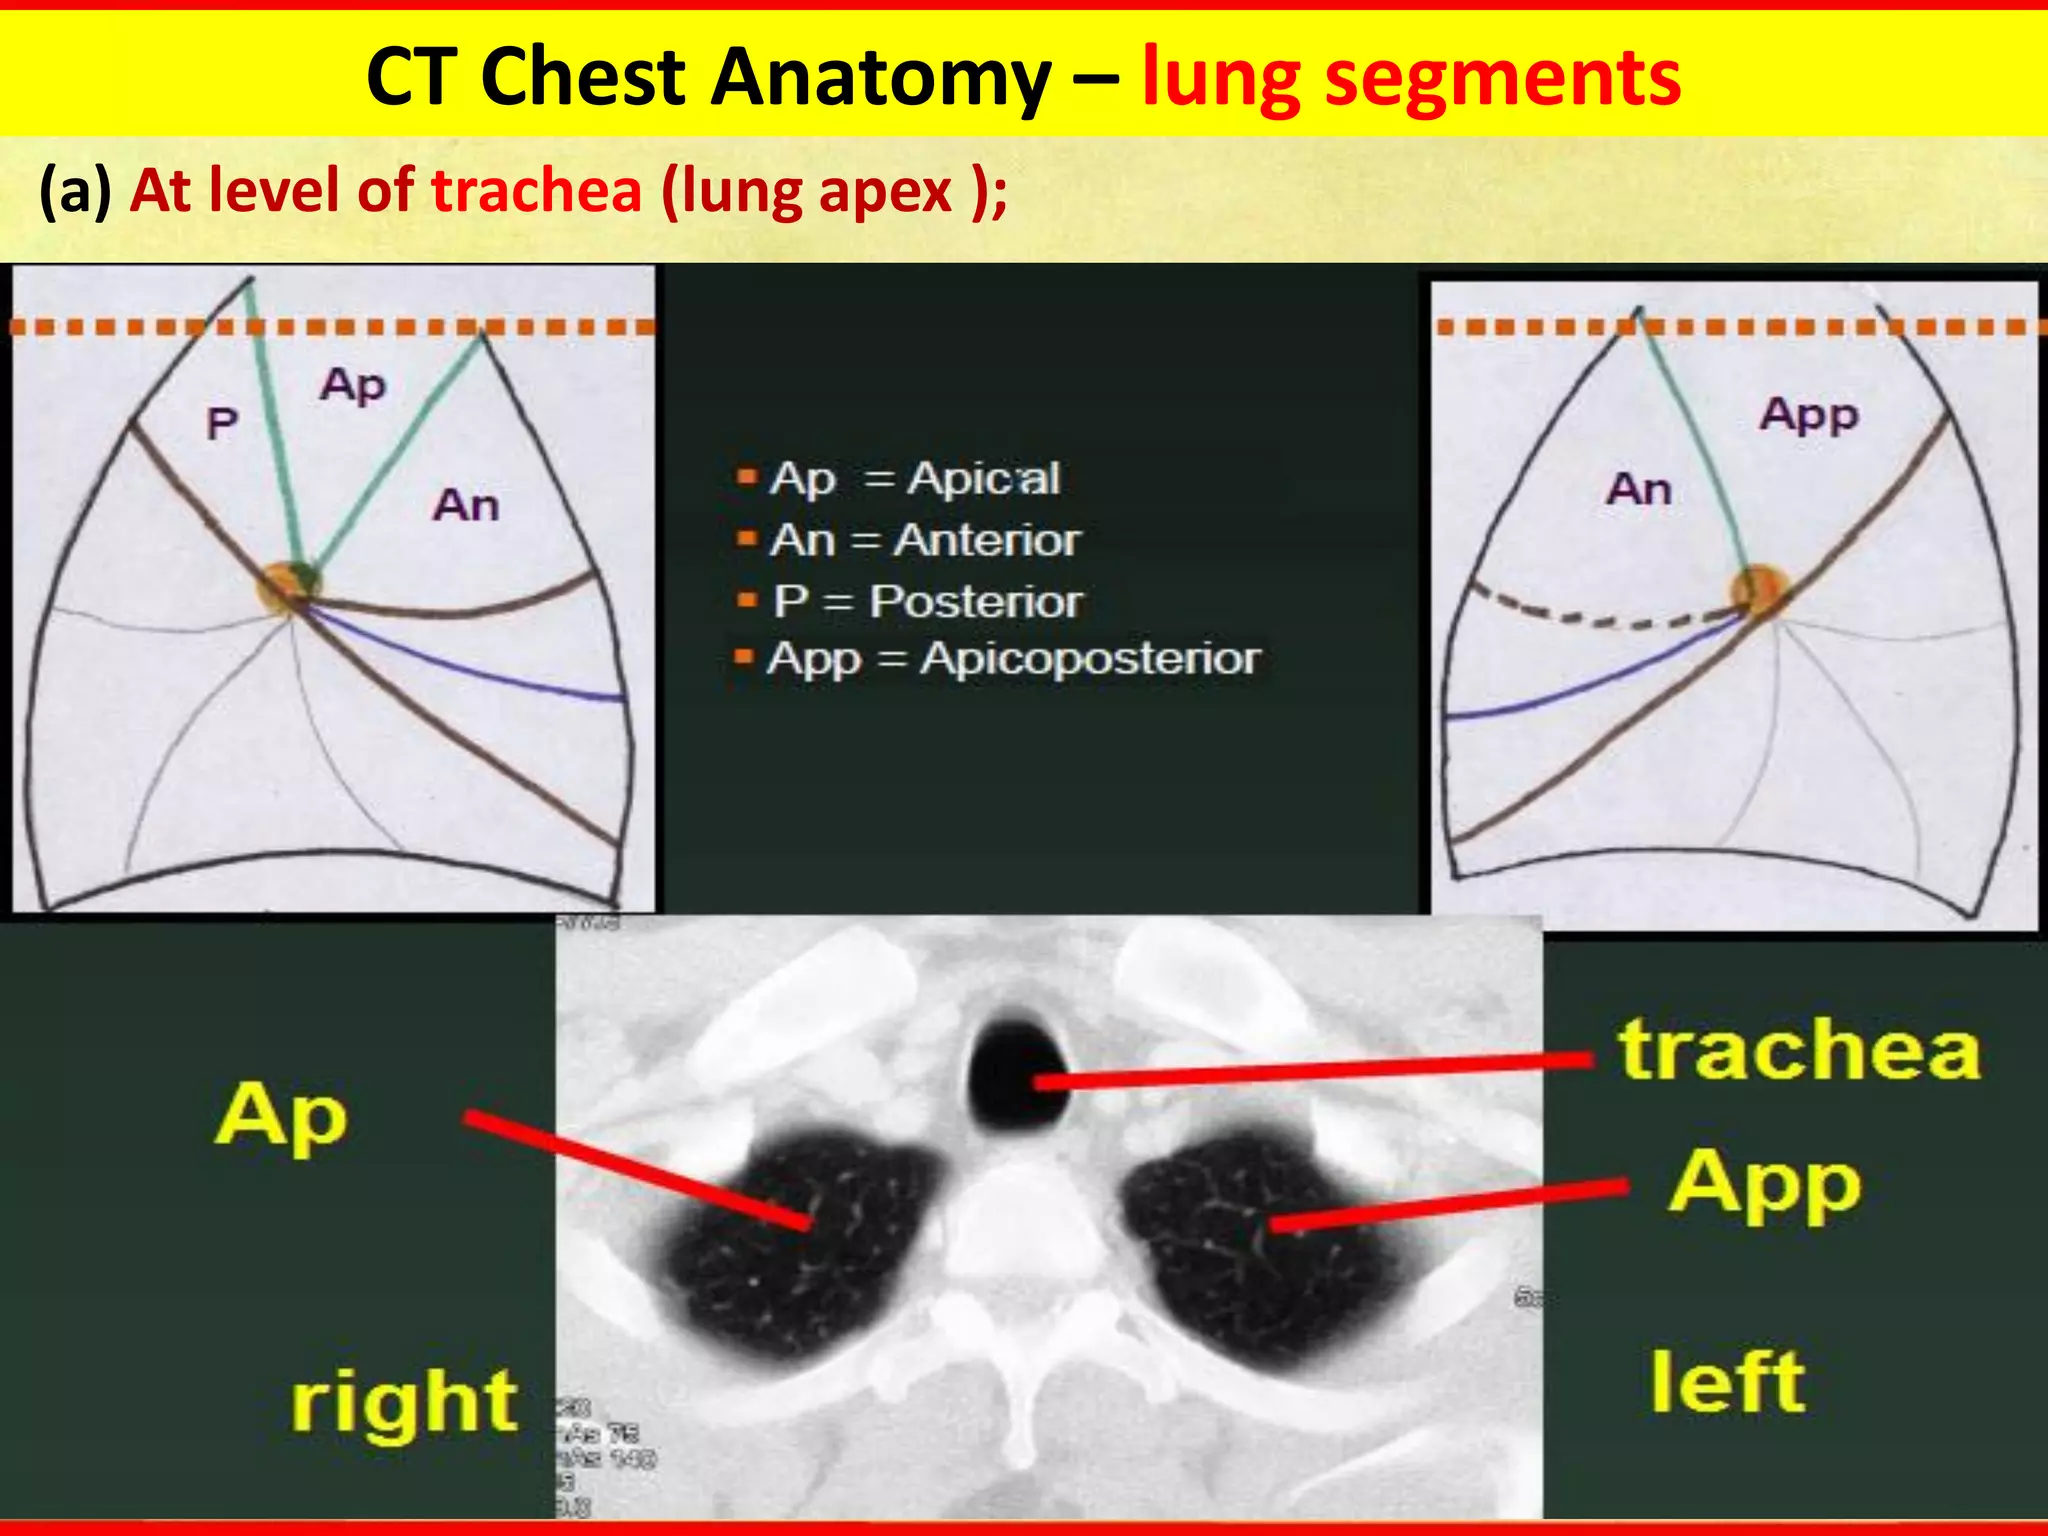

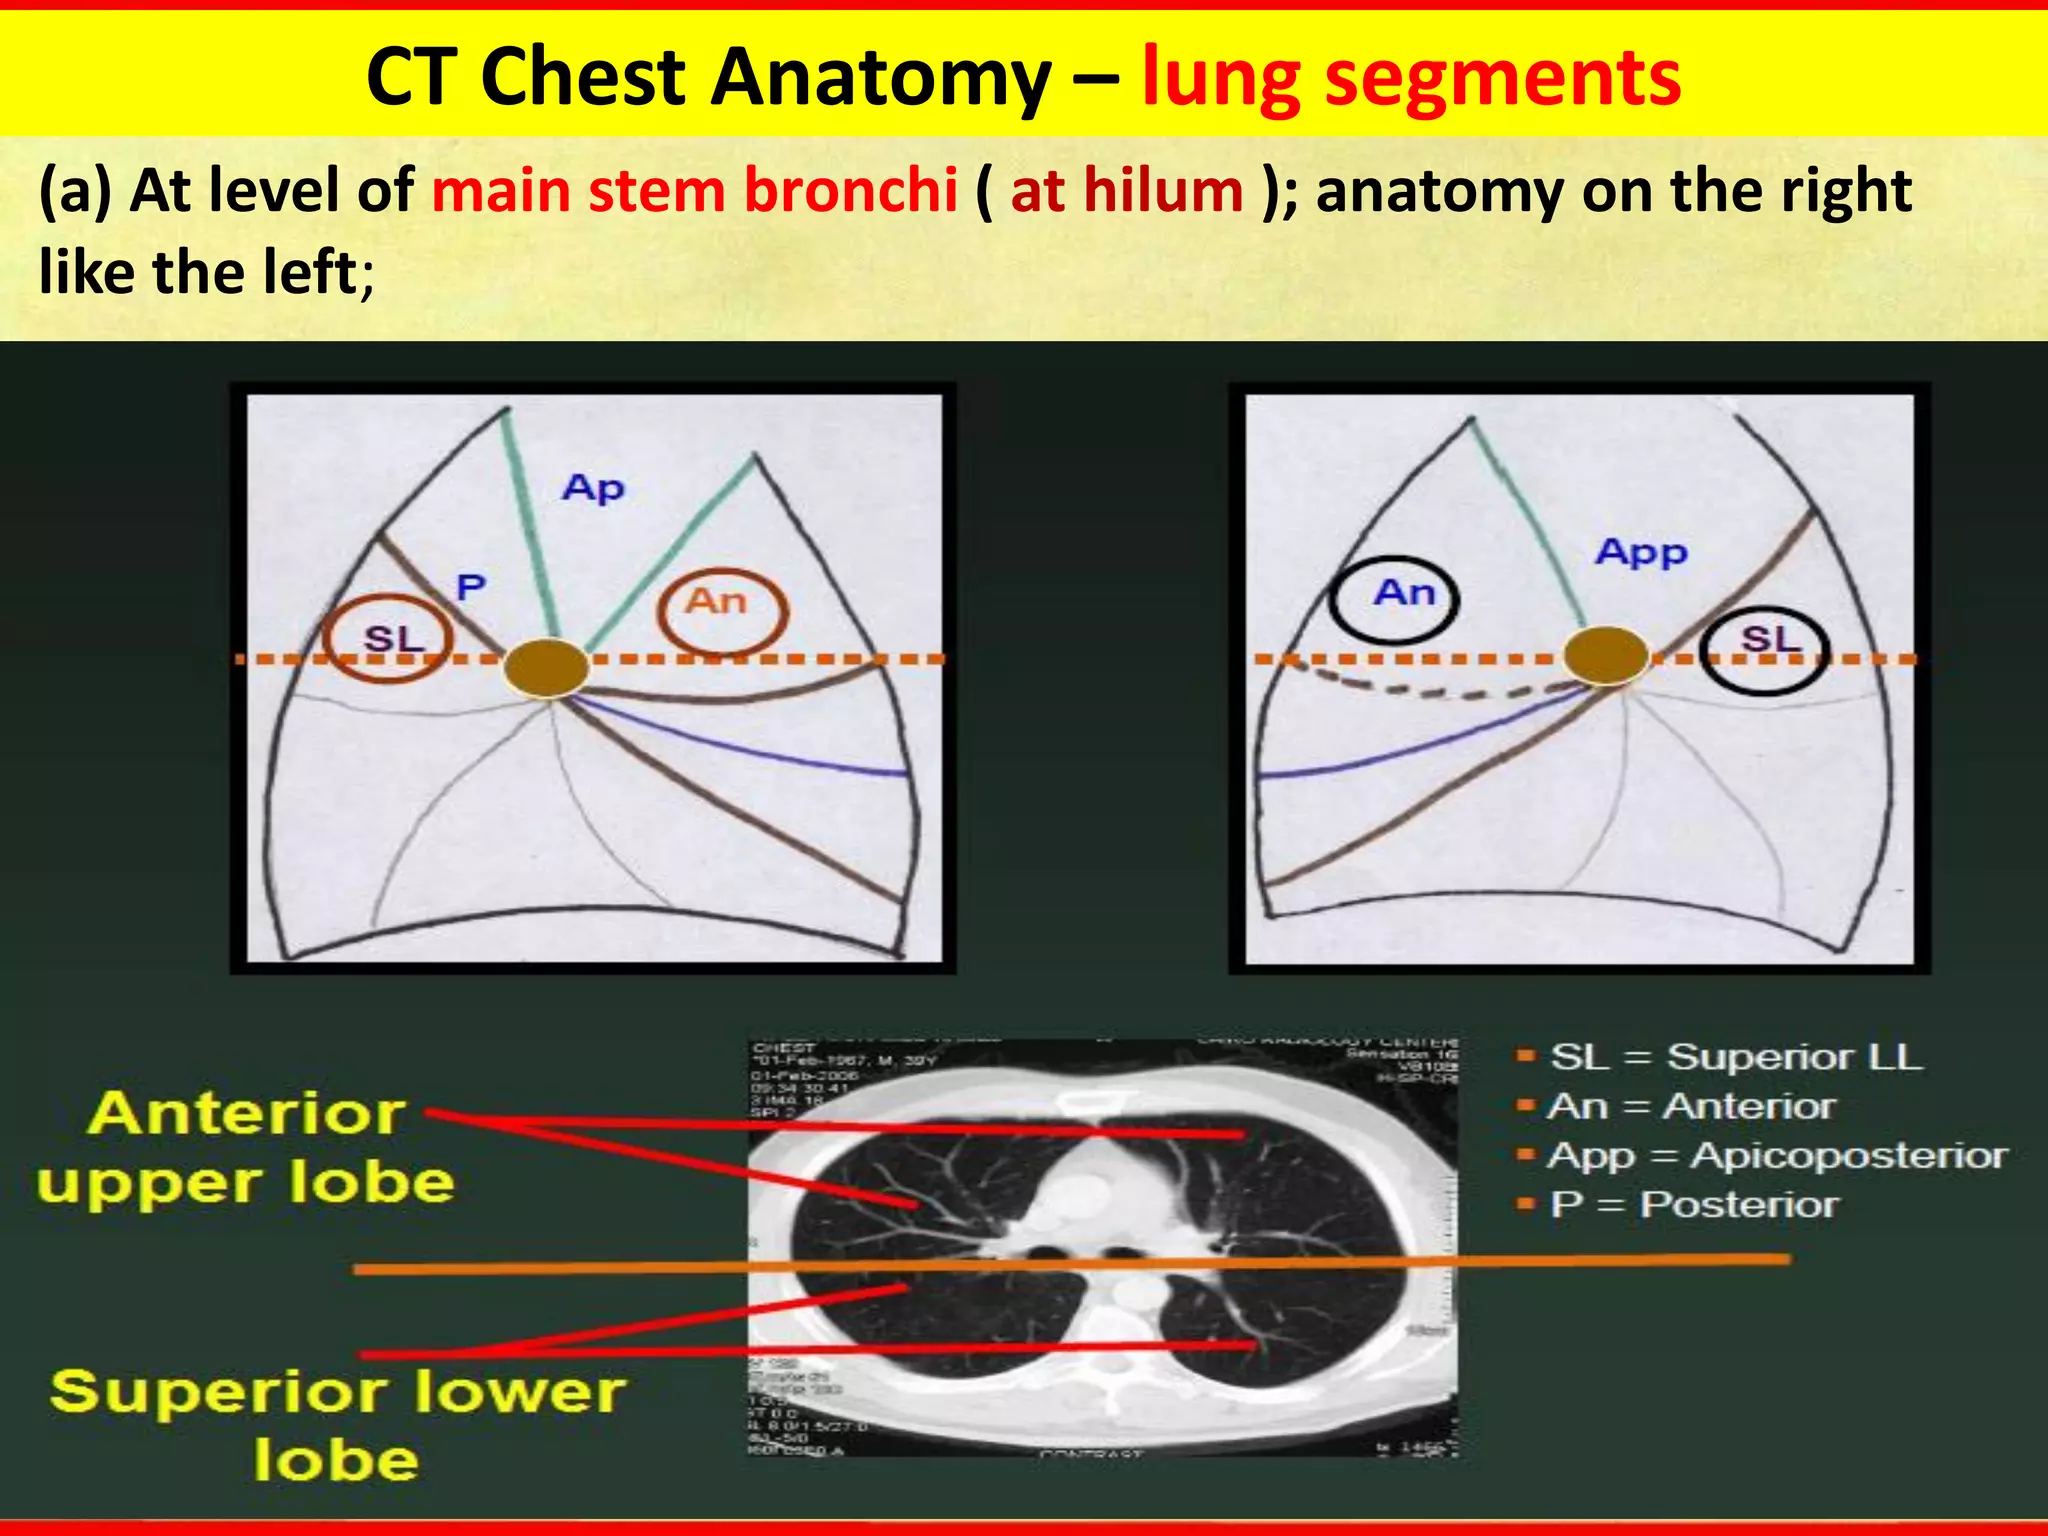


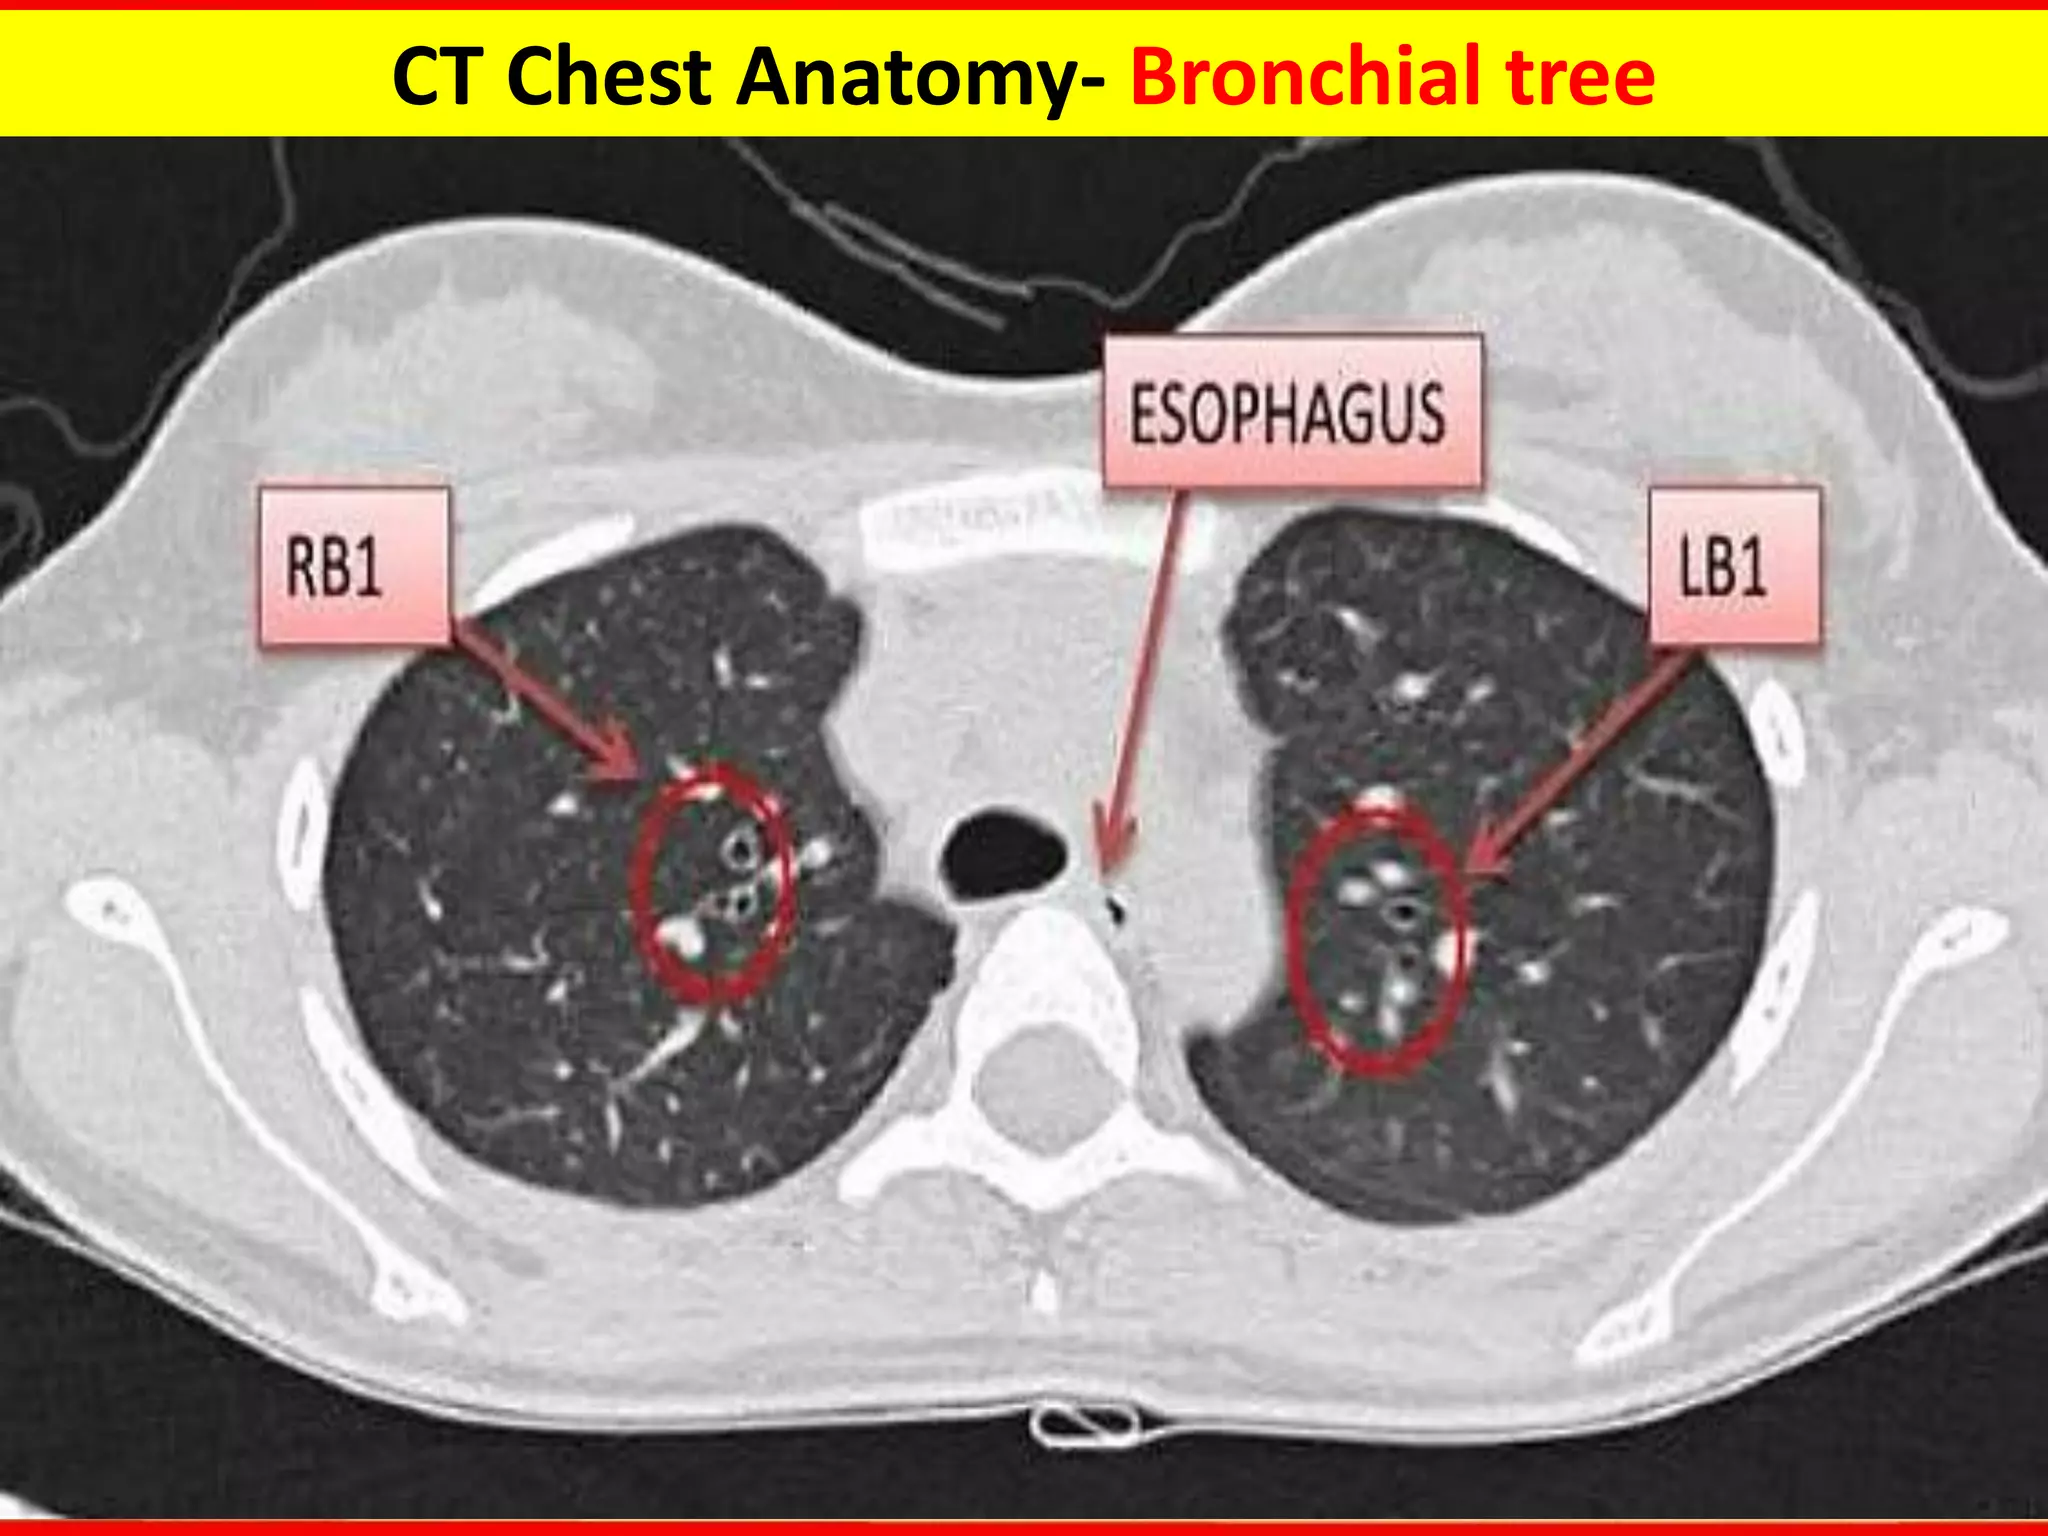
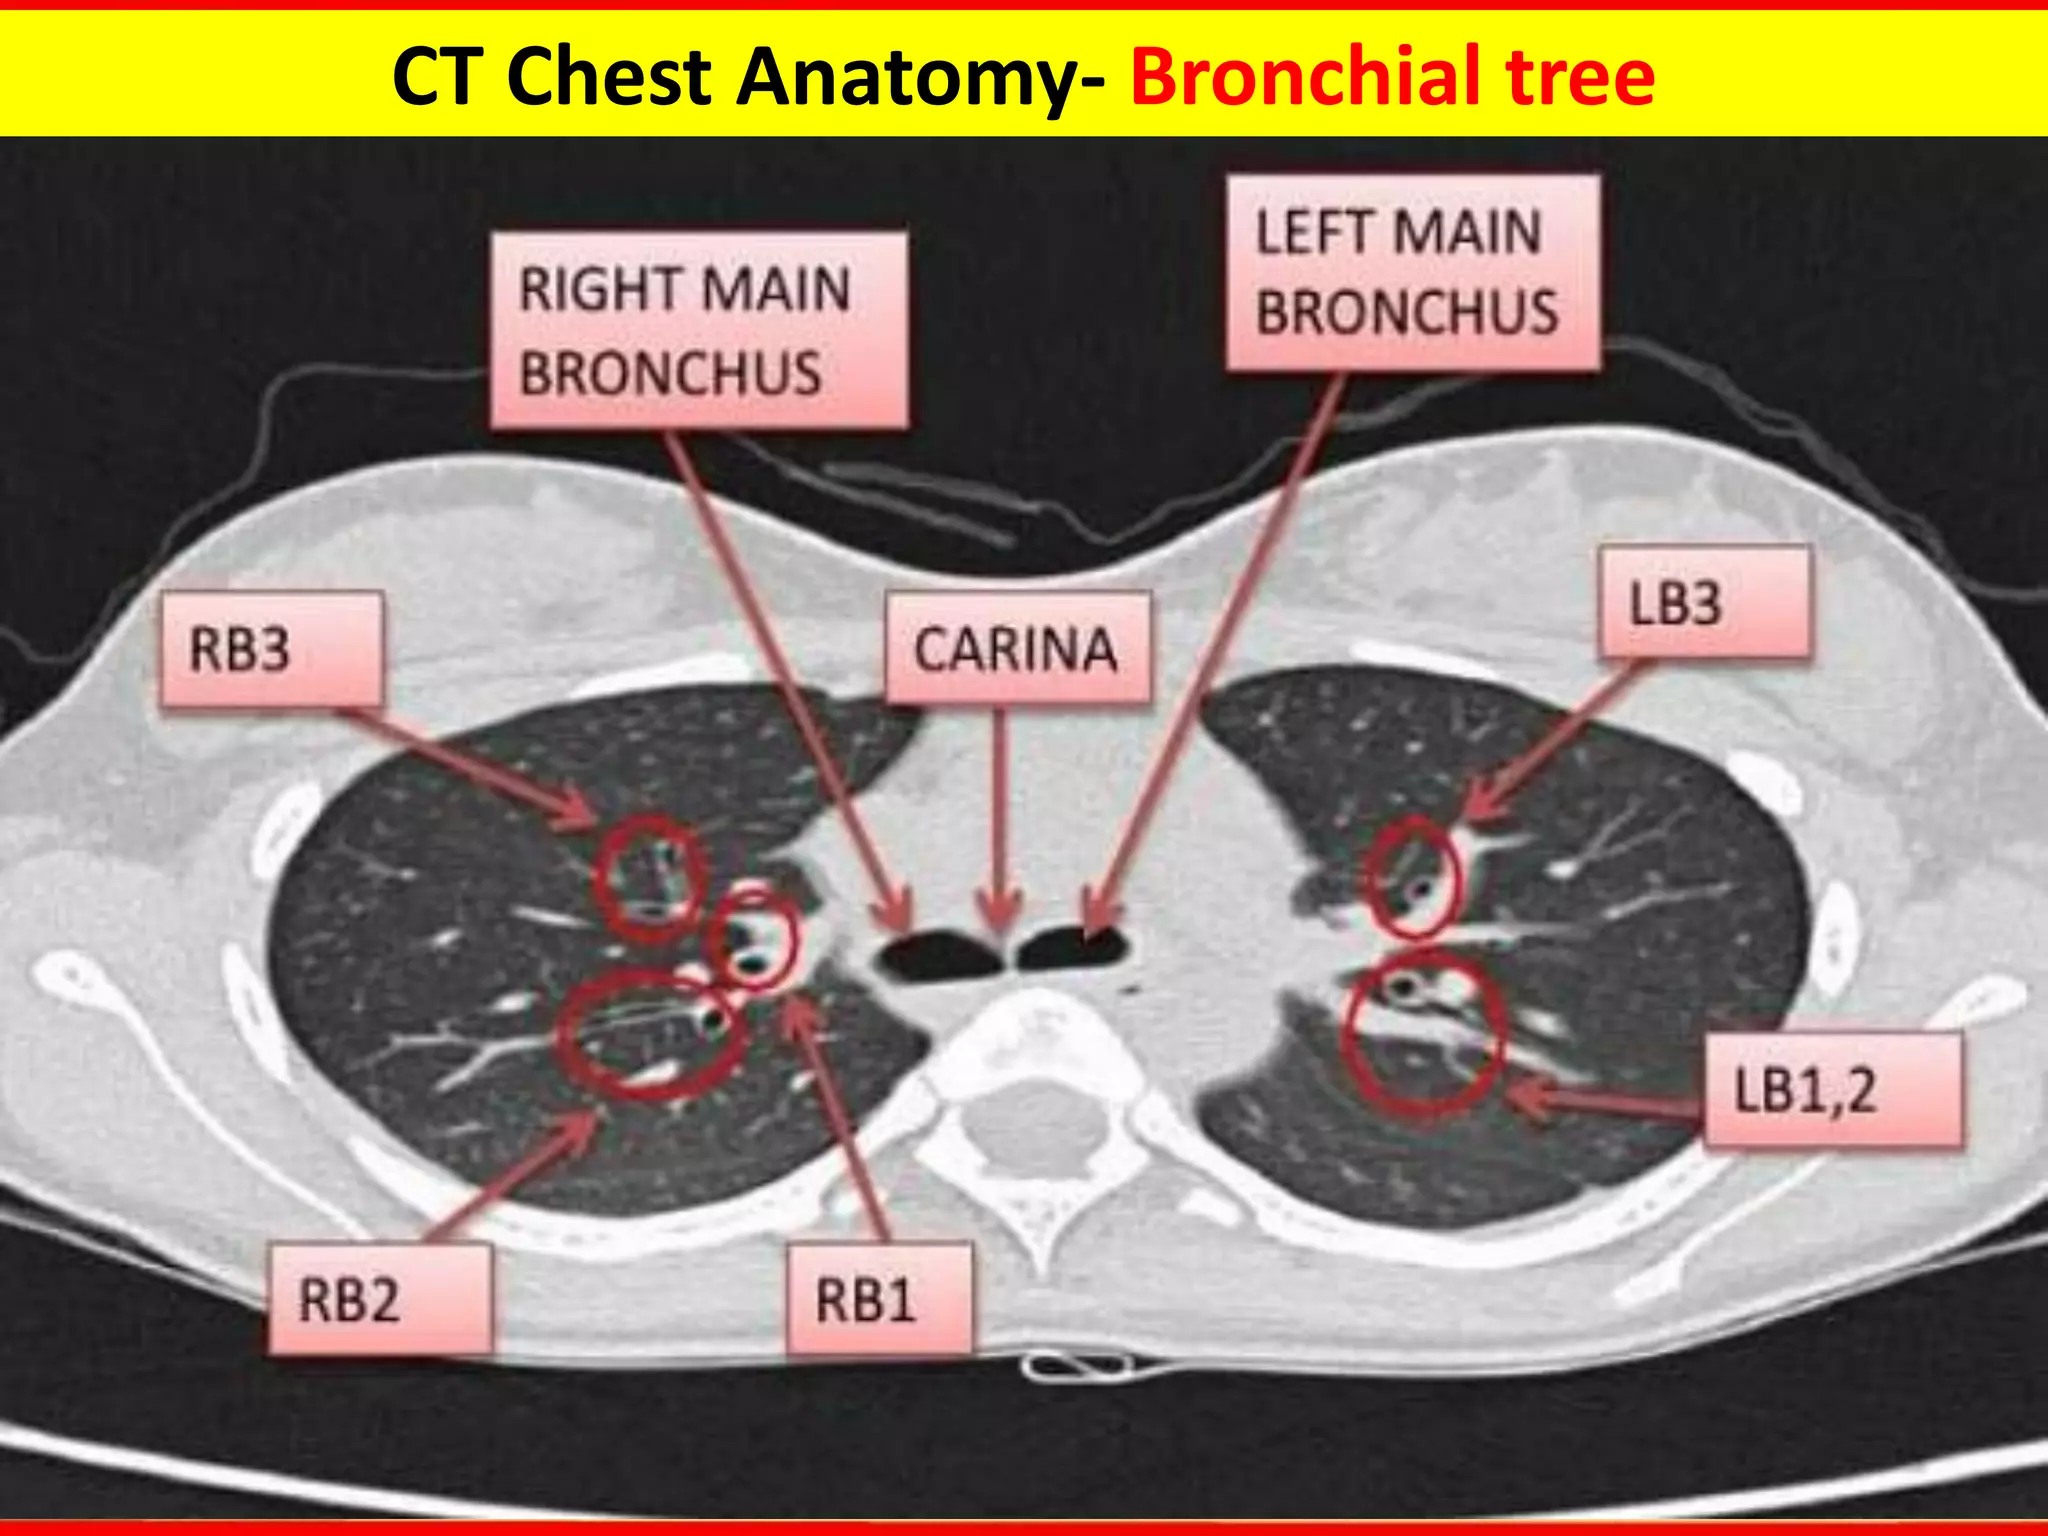


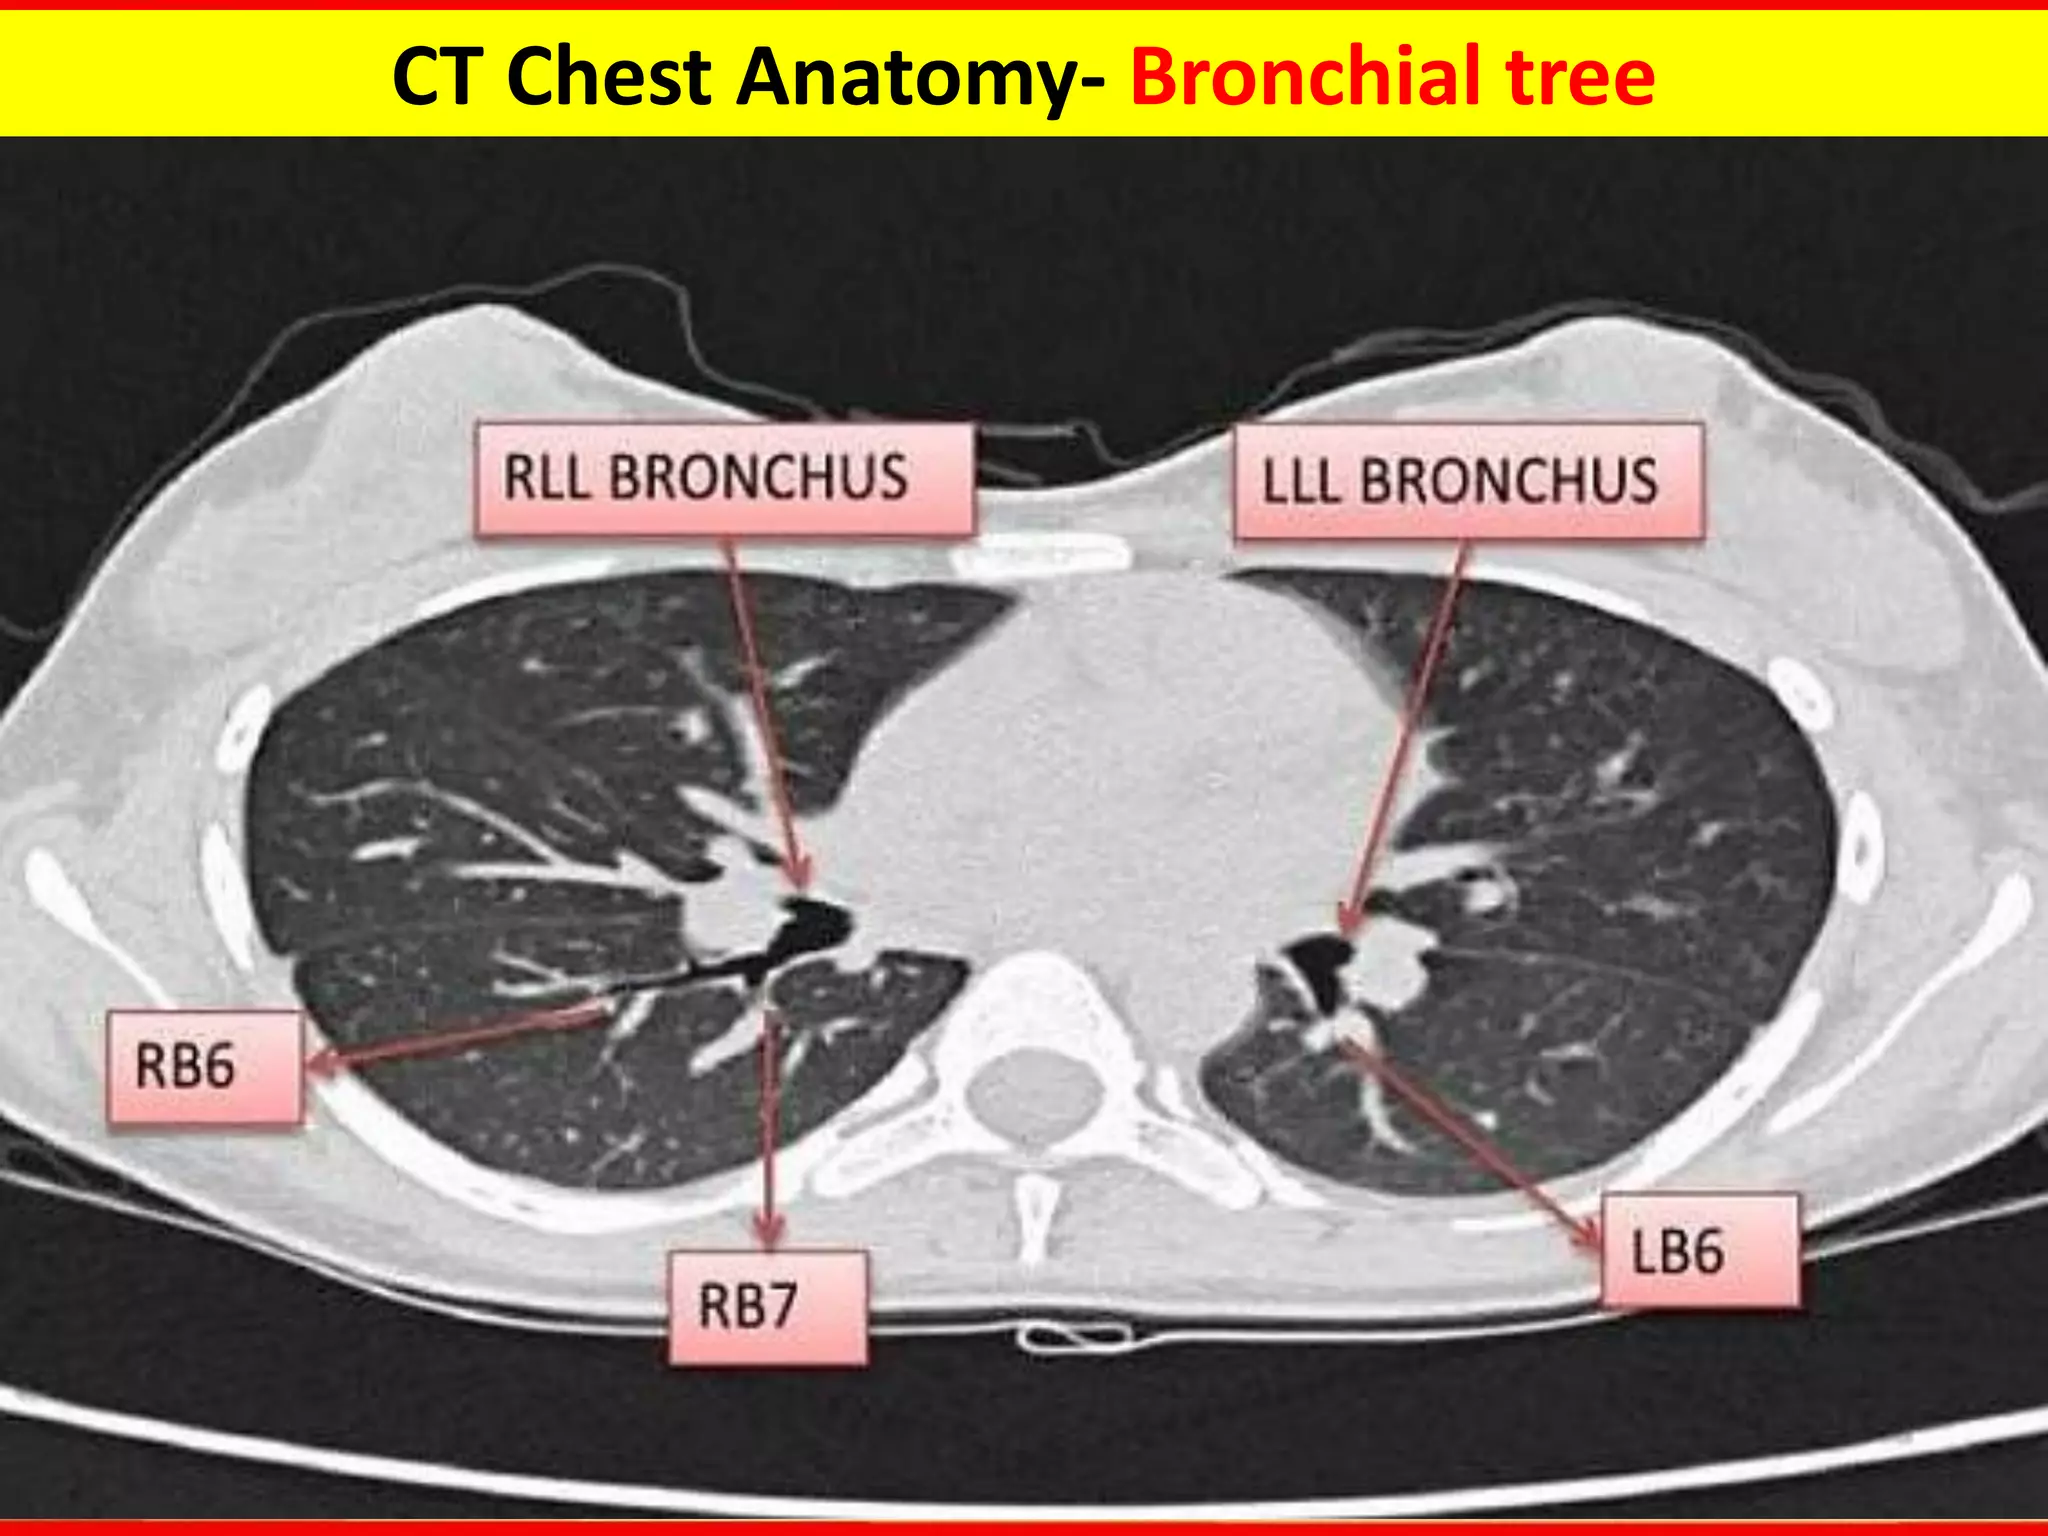


CT Chest Fundamentals provides an overview of CT imaging of the chest. There are several types of CT scans discussed including standard, high-resolution, low-dose, CT angiography, and paired inspiratory-expiratory scans. CT allows visualization of chest anatomy including the lungs, mediastinum, bronchi, vessels, and lymph nodes. Common chest abnormalities that can be identified on CT include tracheal and bronchial abnormalities, masses or nodules in the lungs or hilum, lymph node enlargement, and vascular abnormalities. CT is useful for evaluating many lung diseases and conditions.


