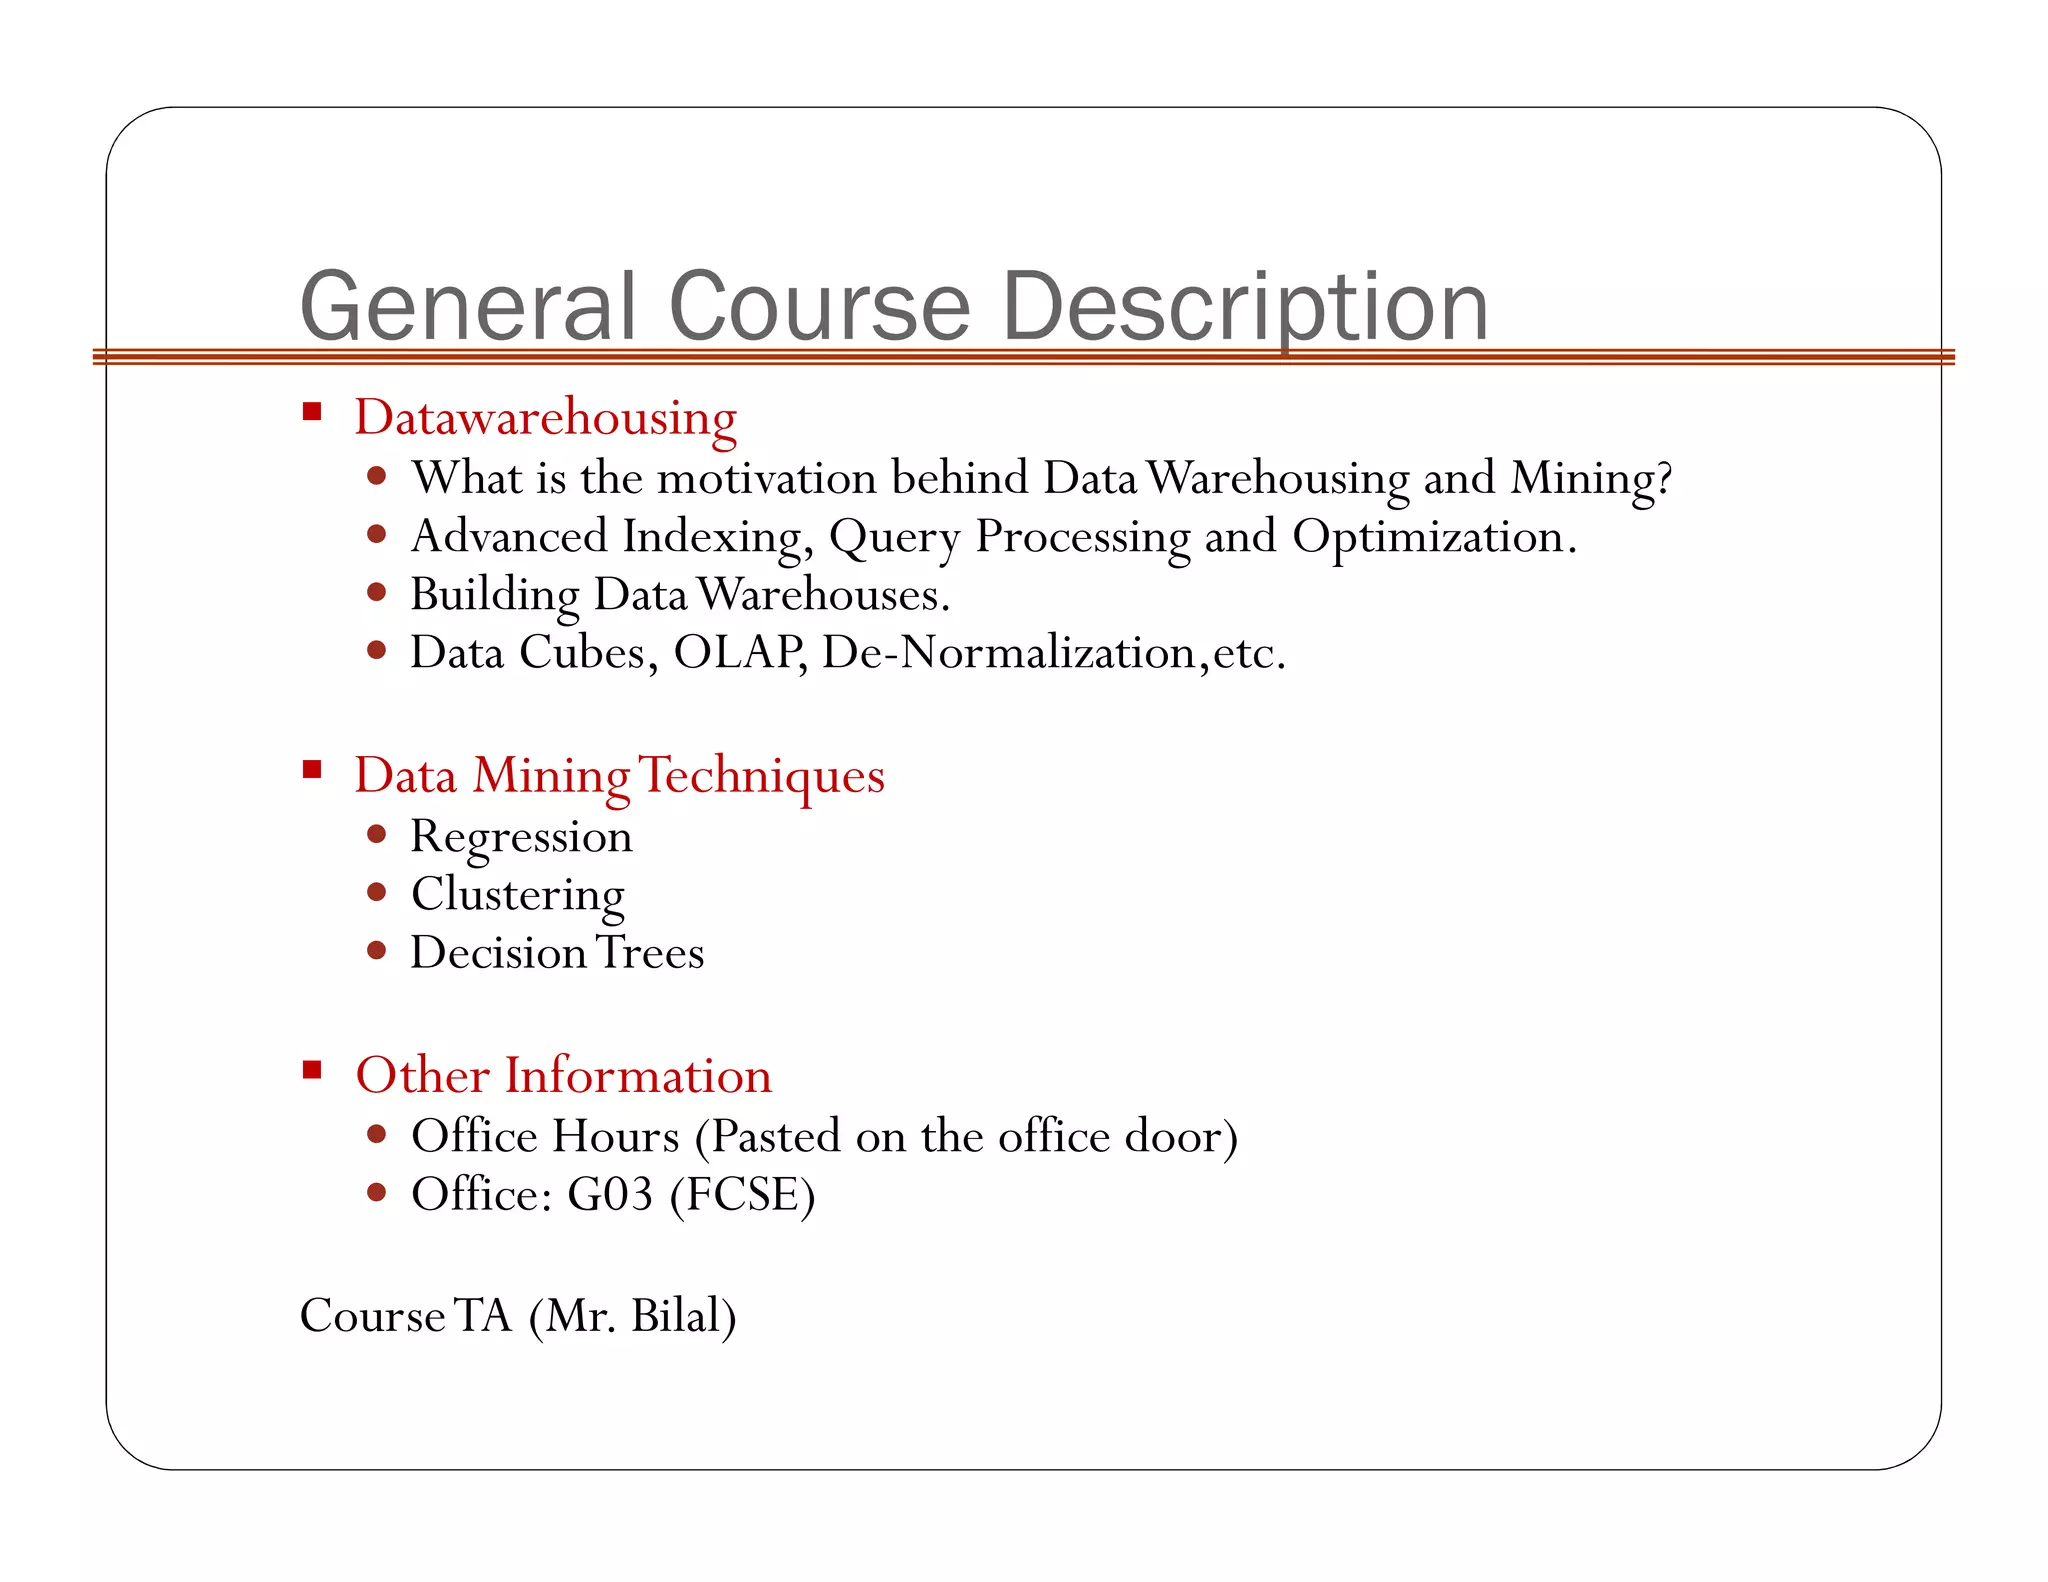
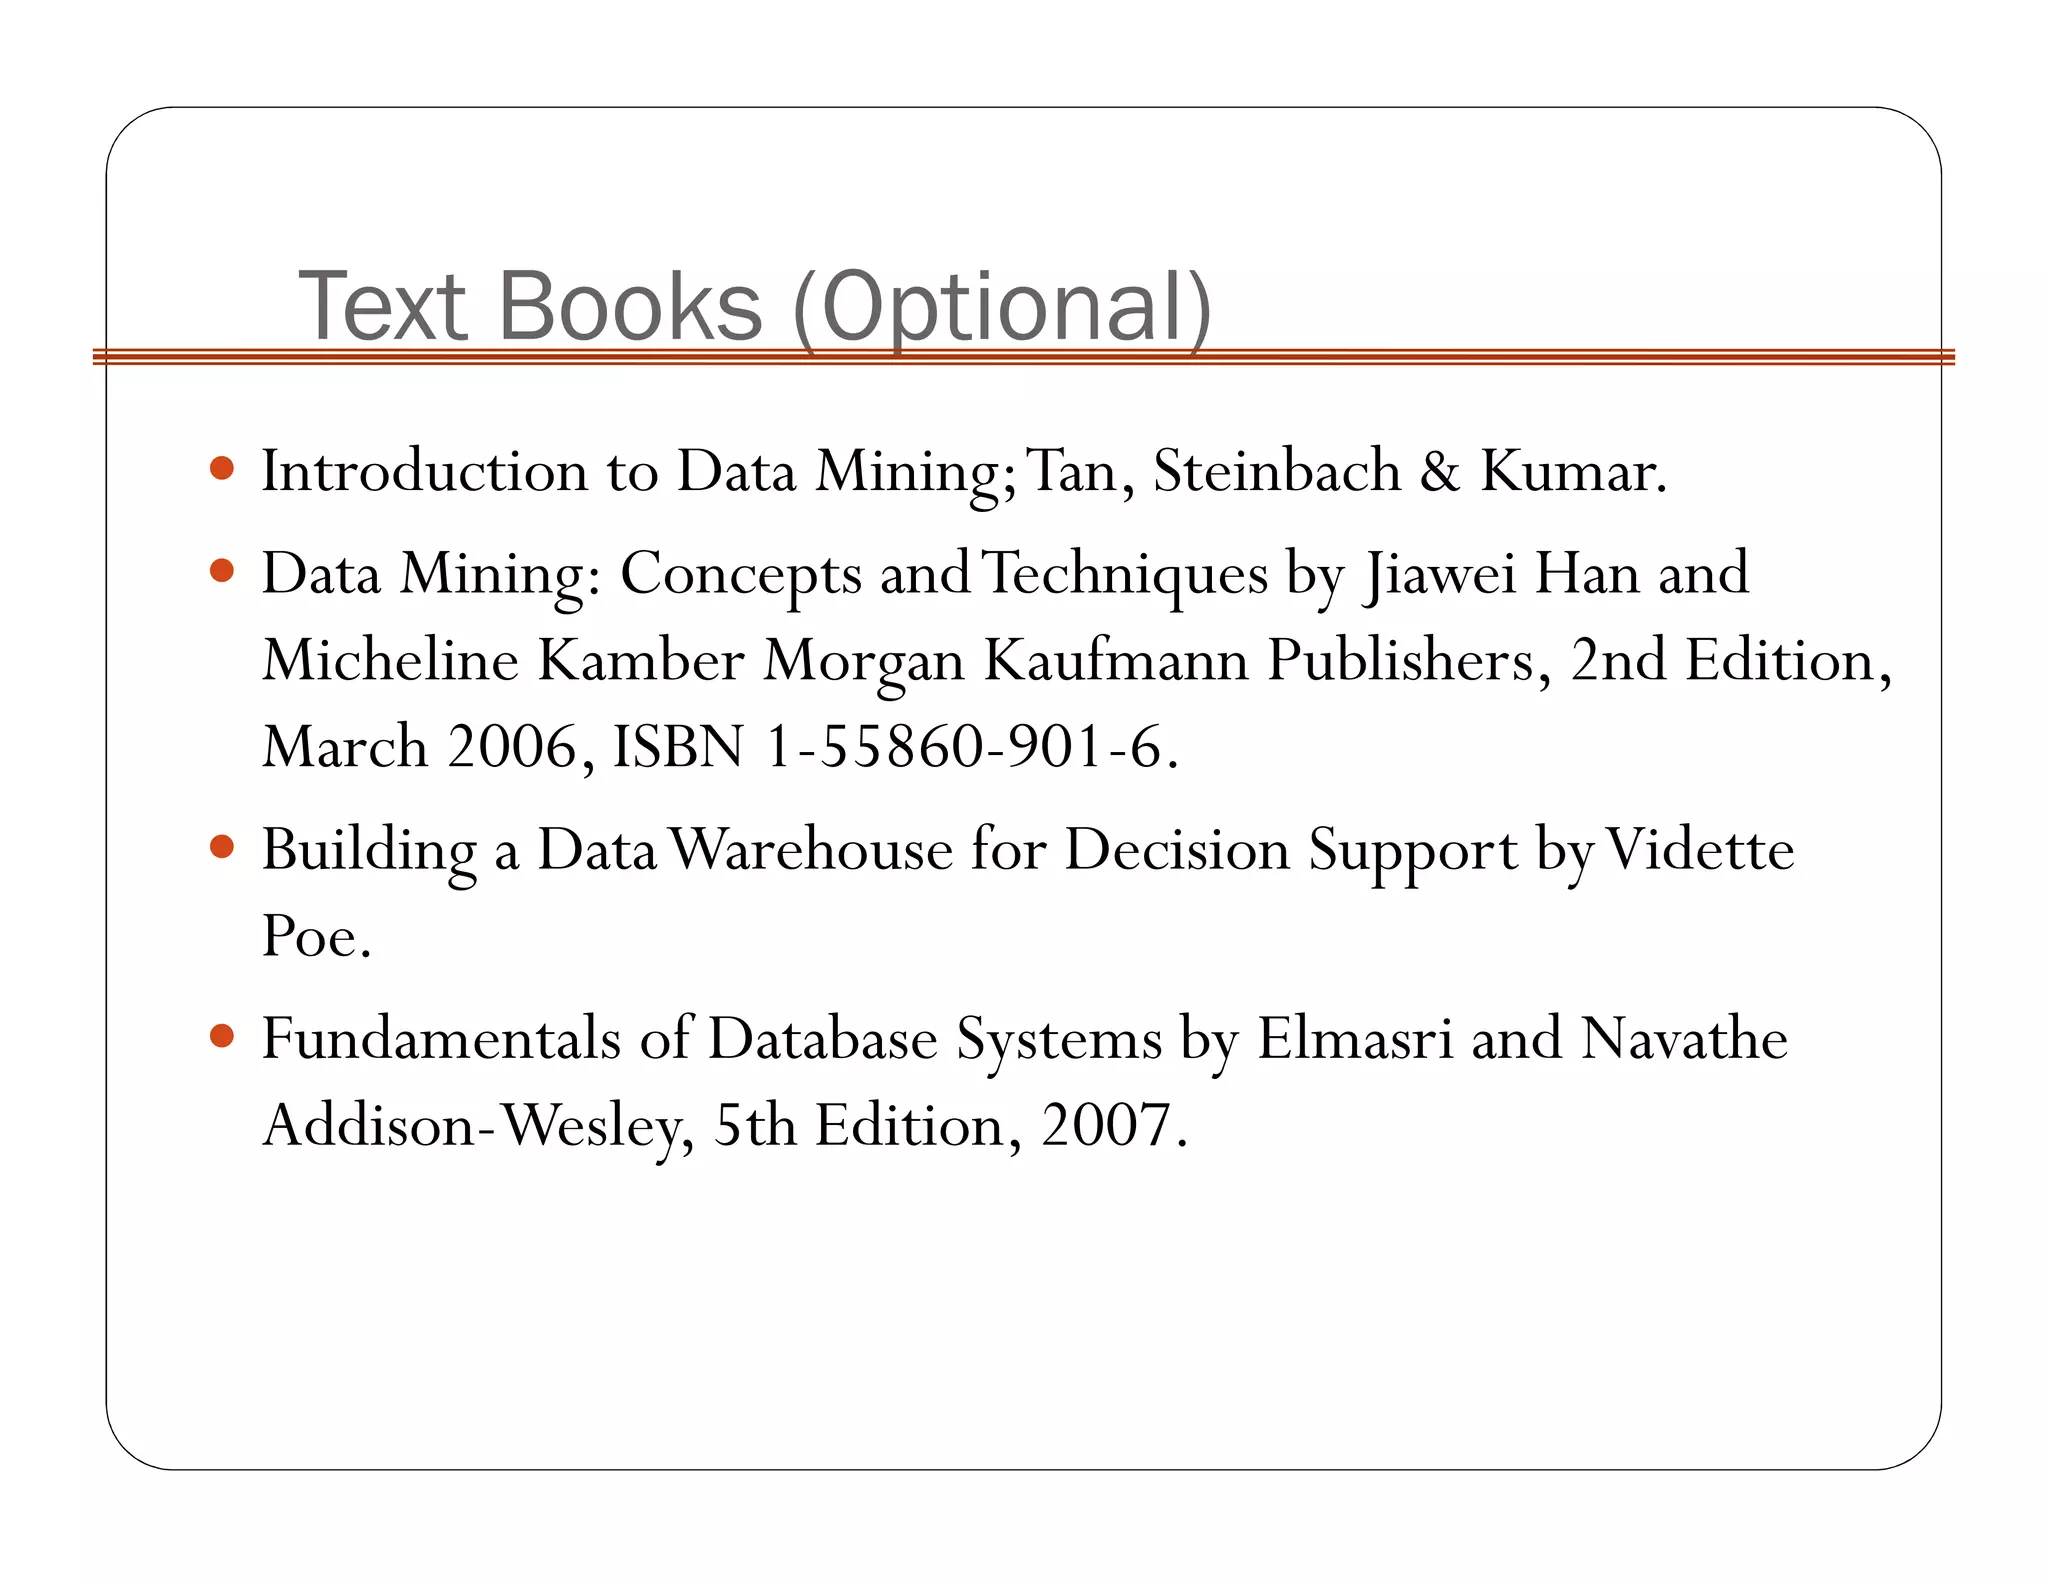
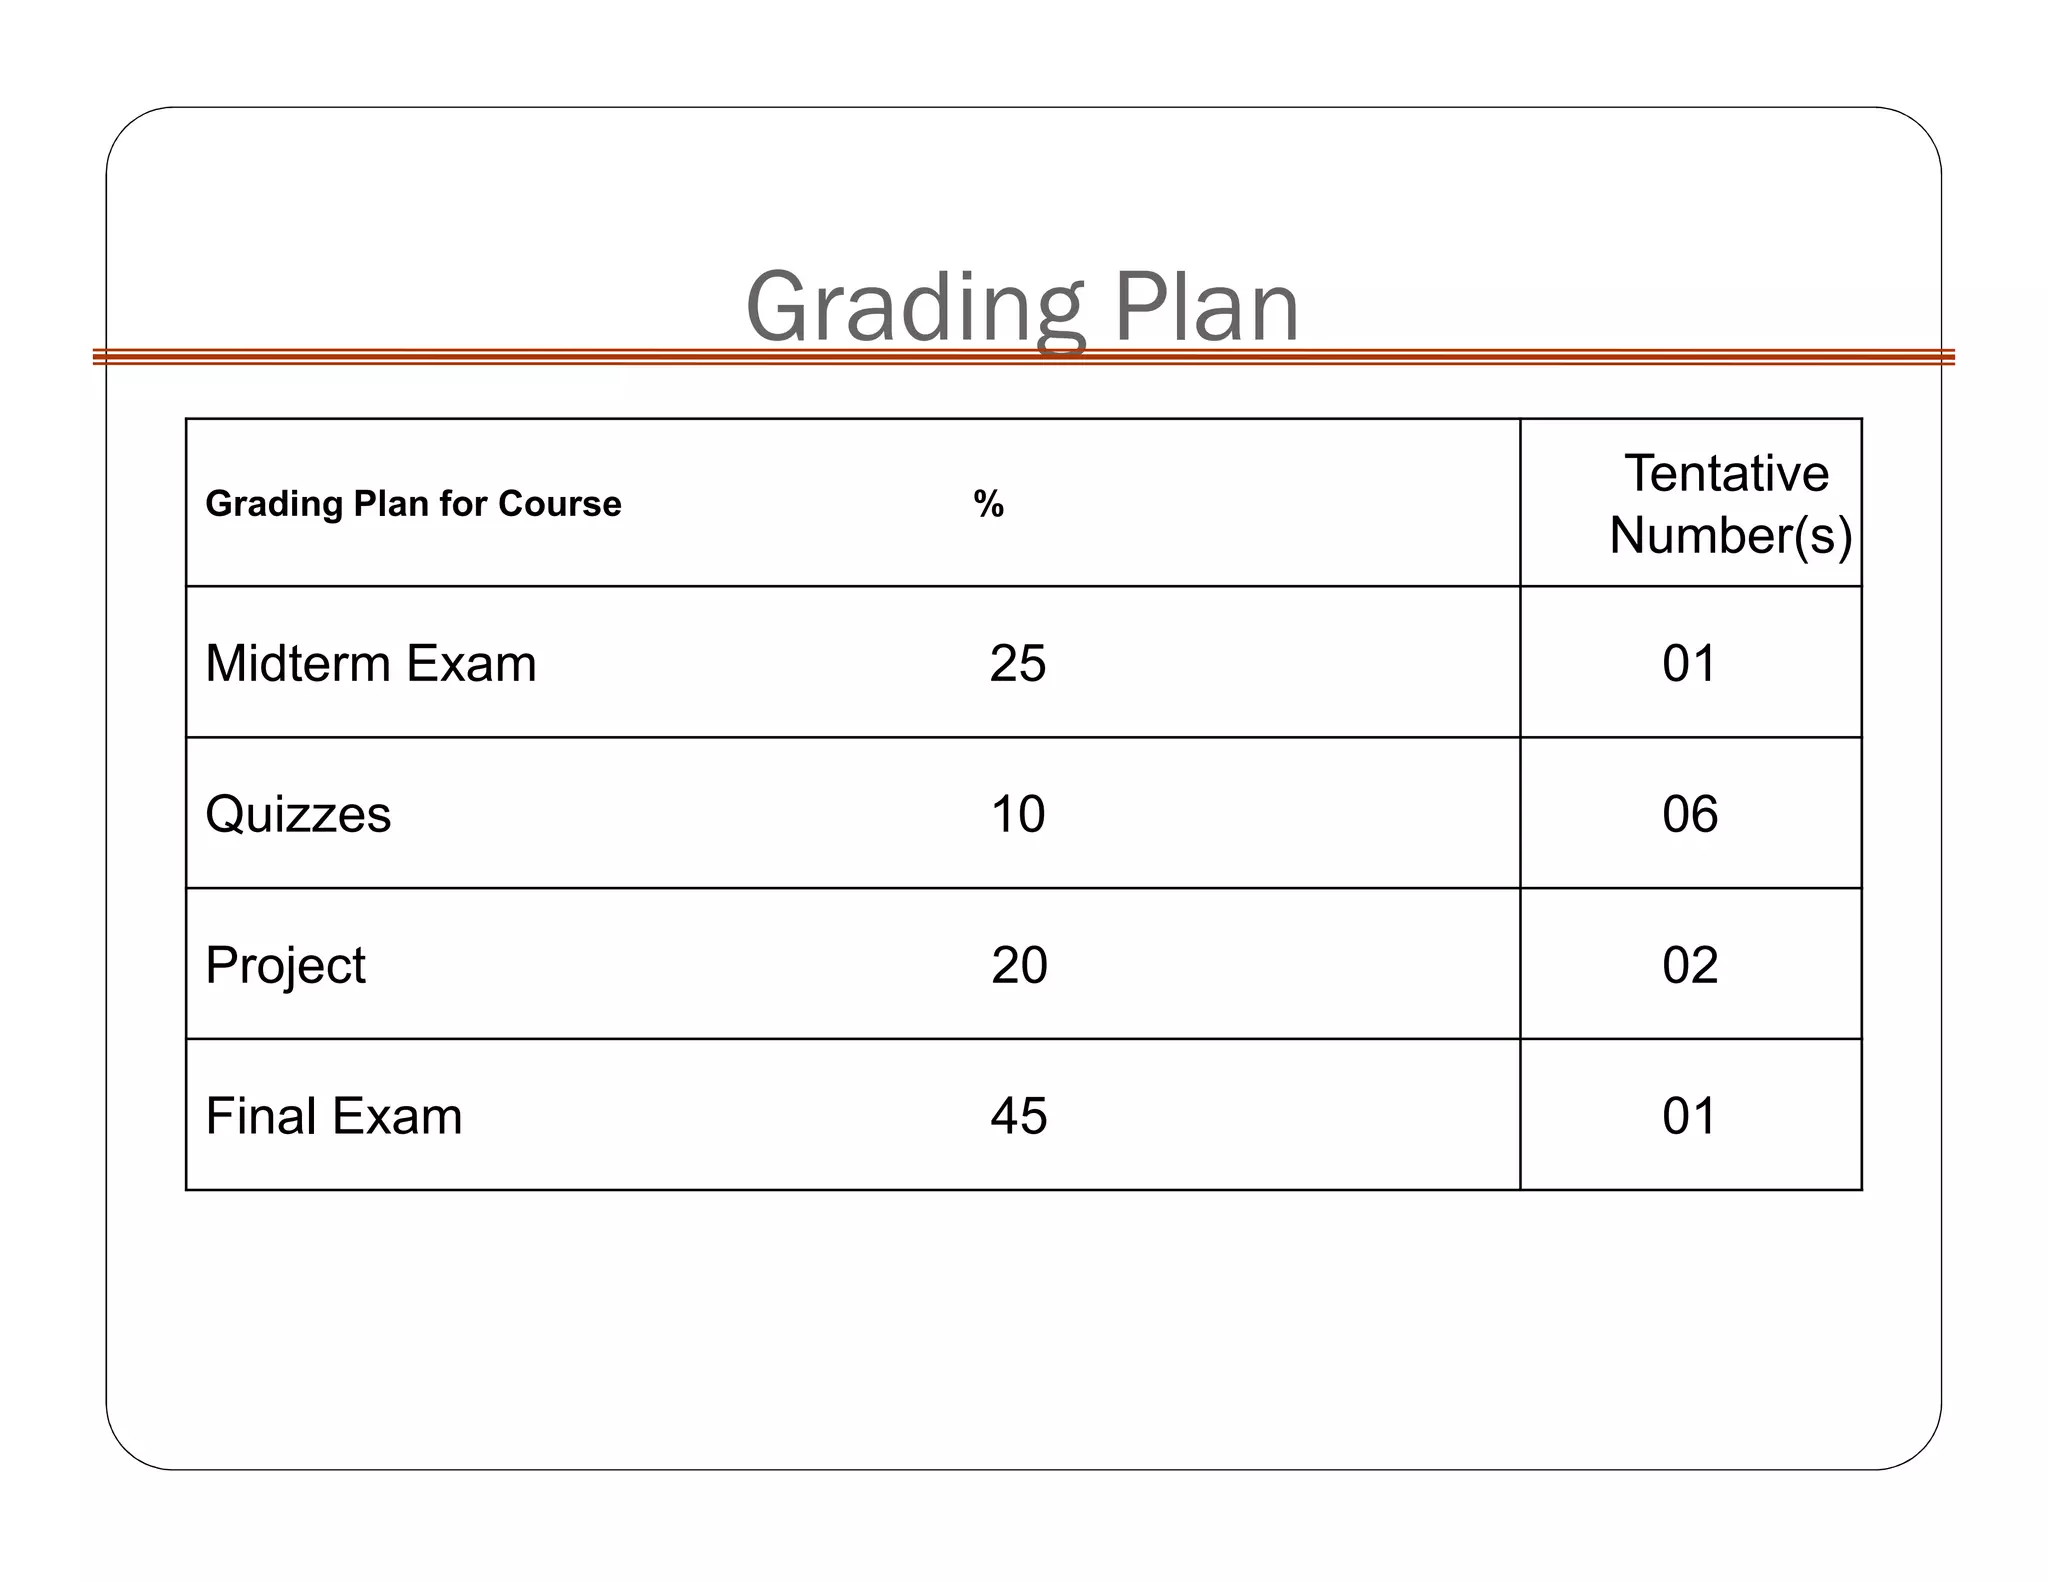
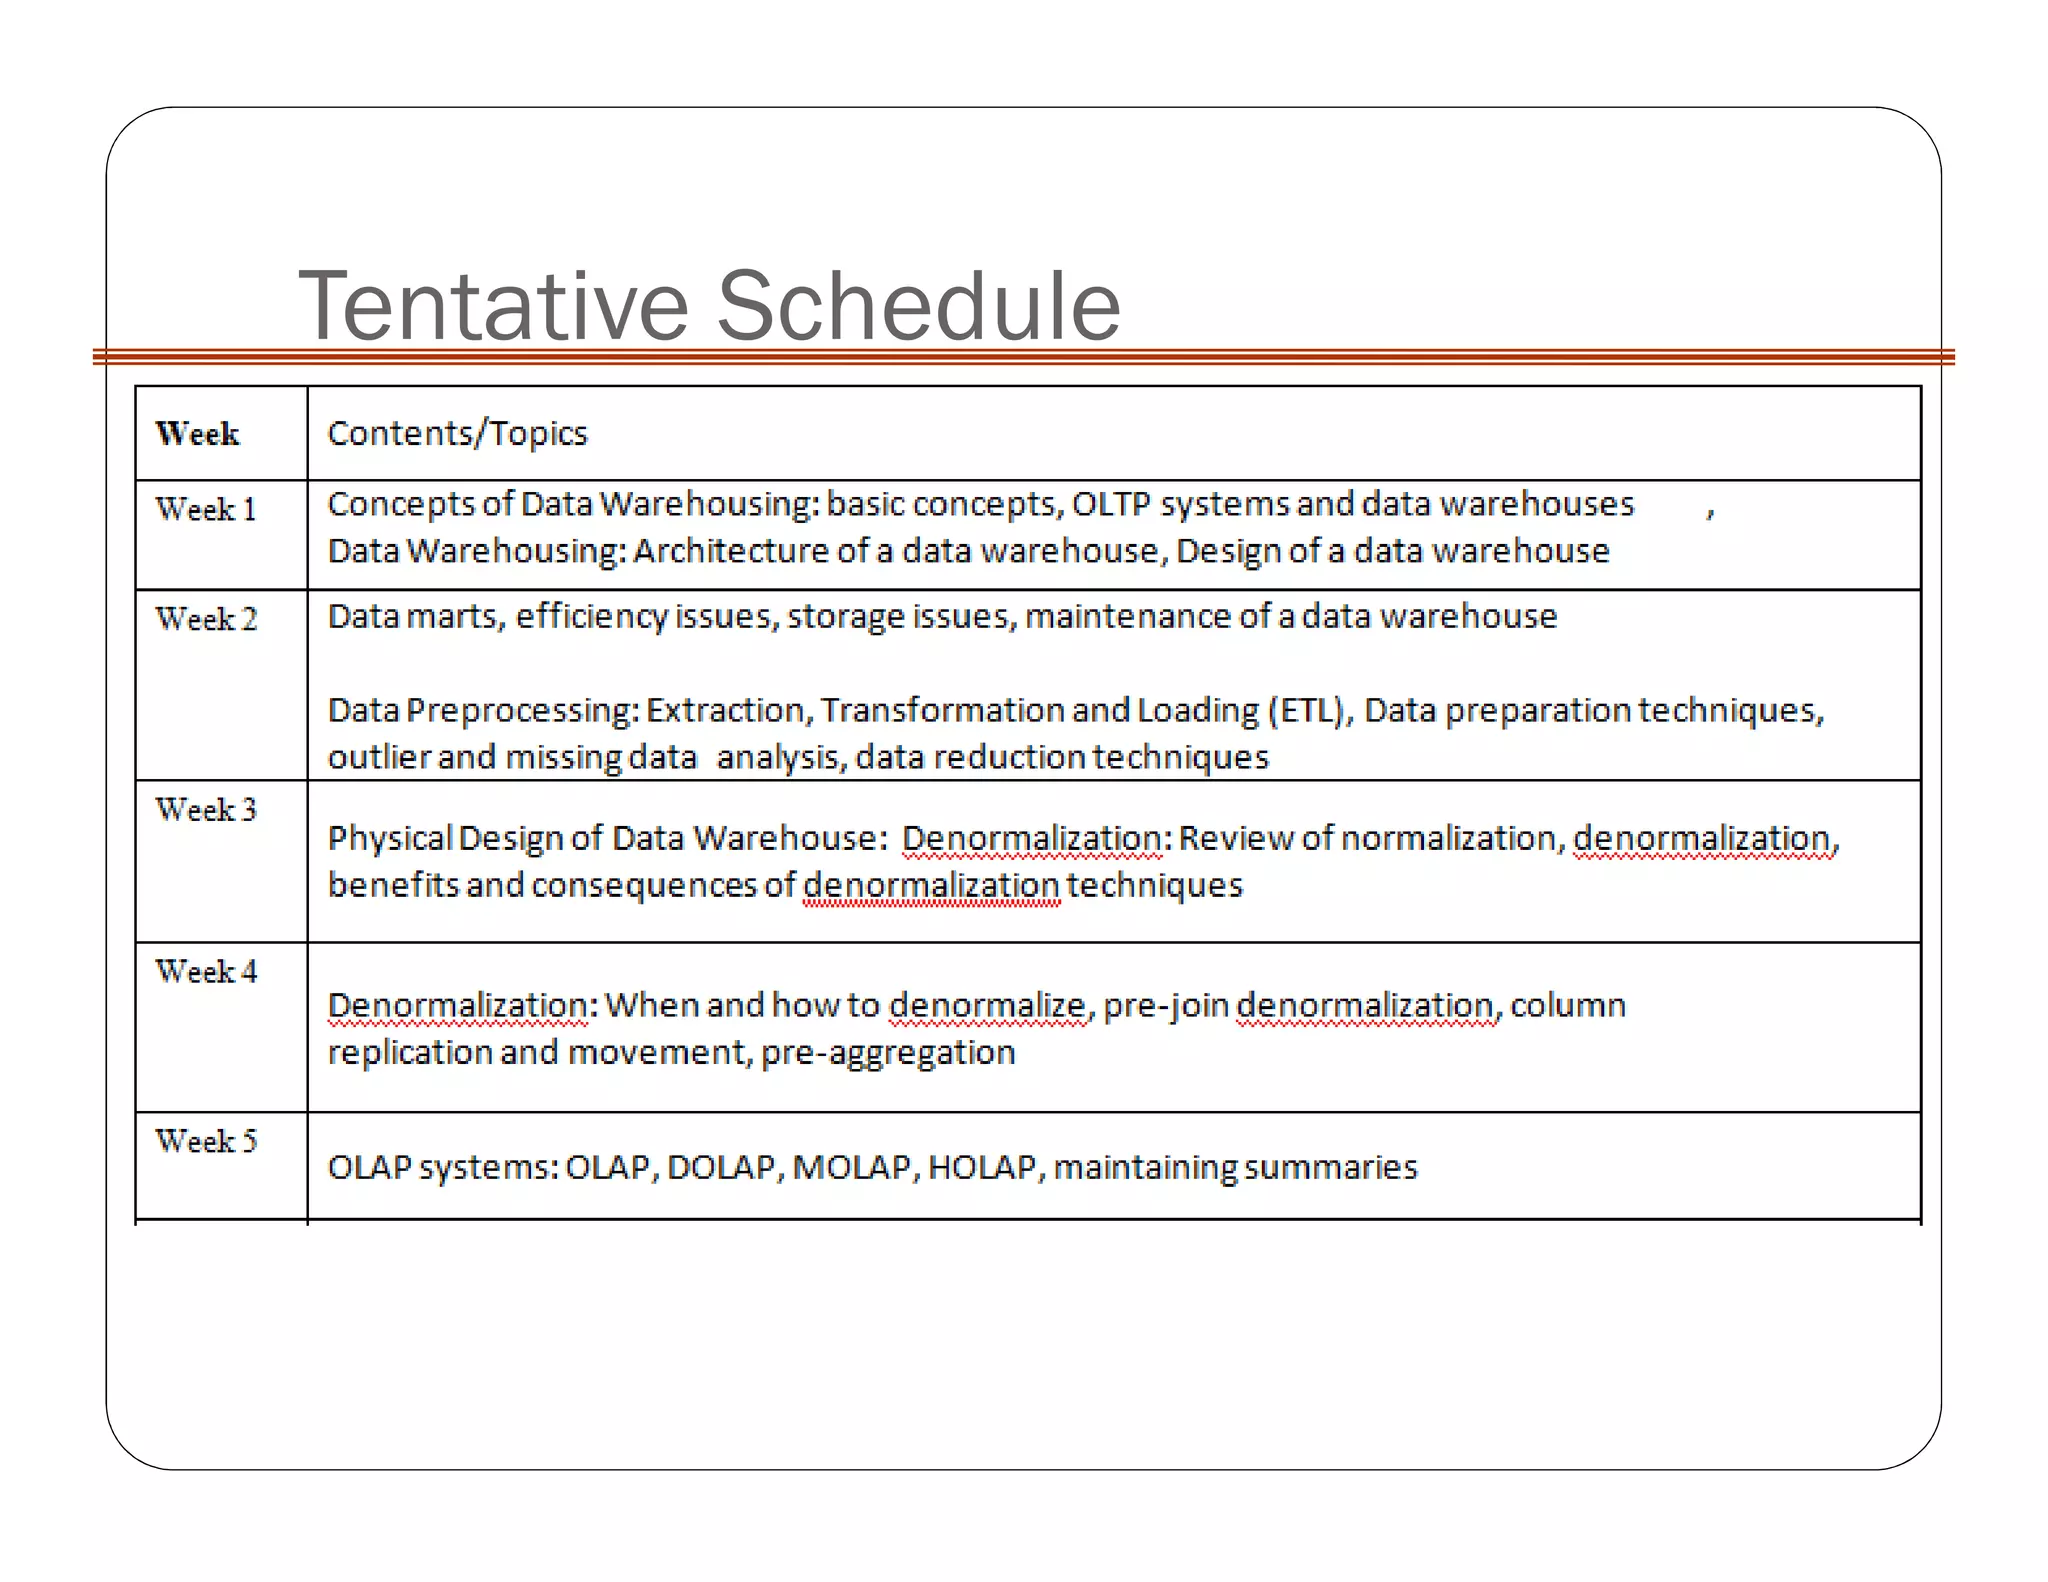
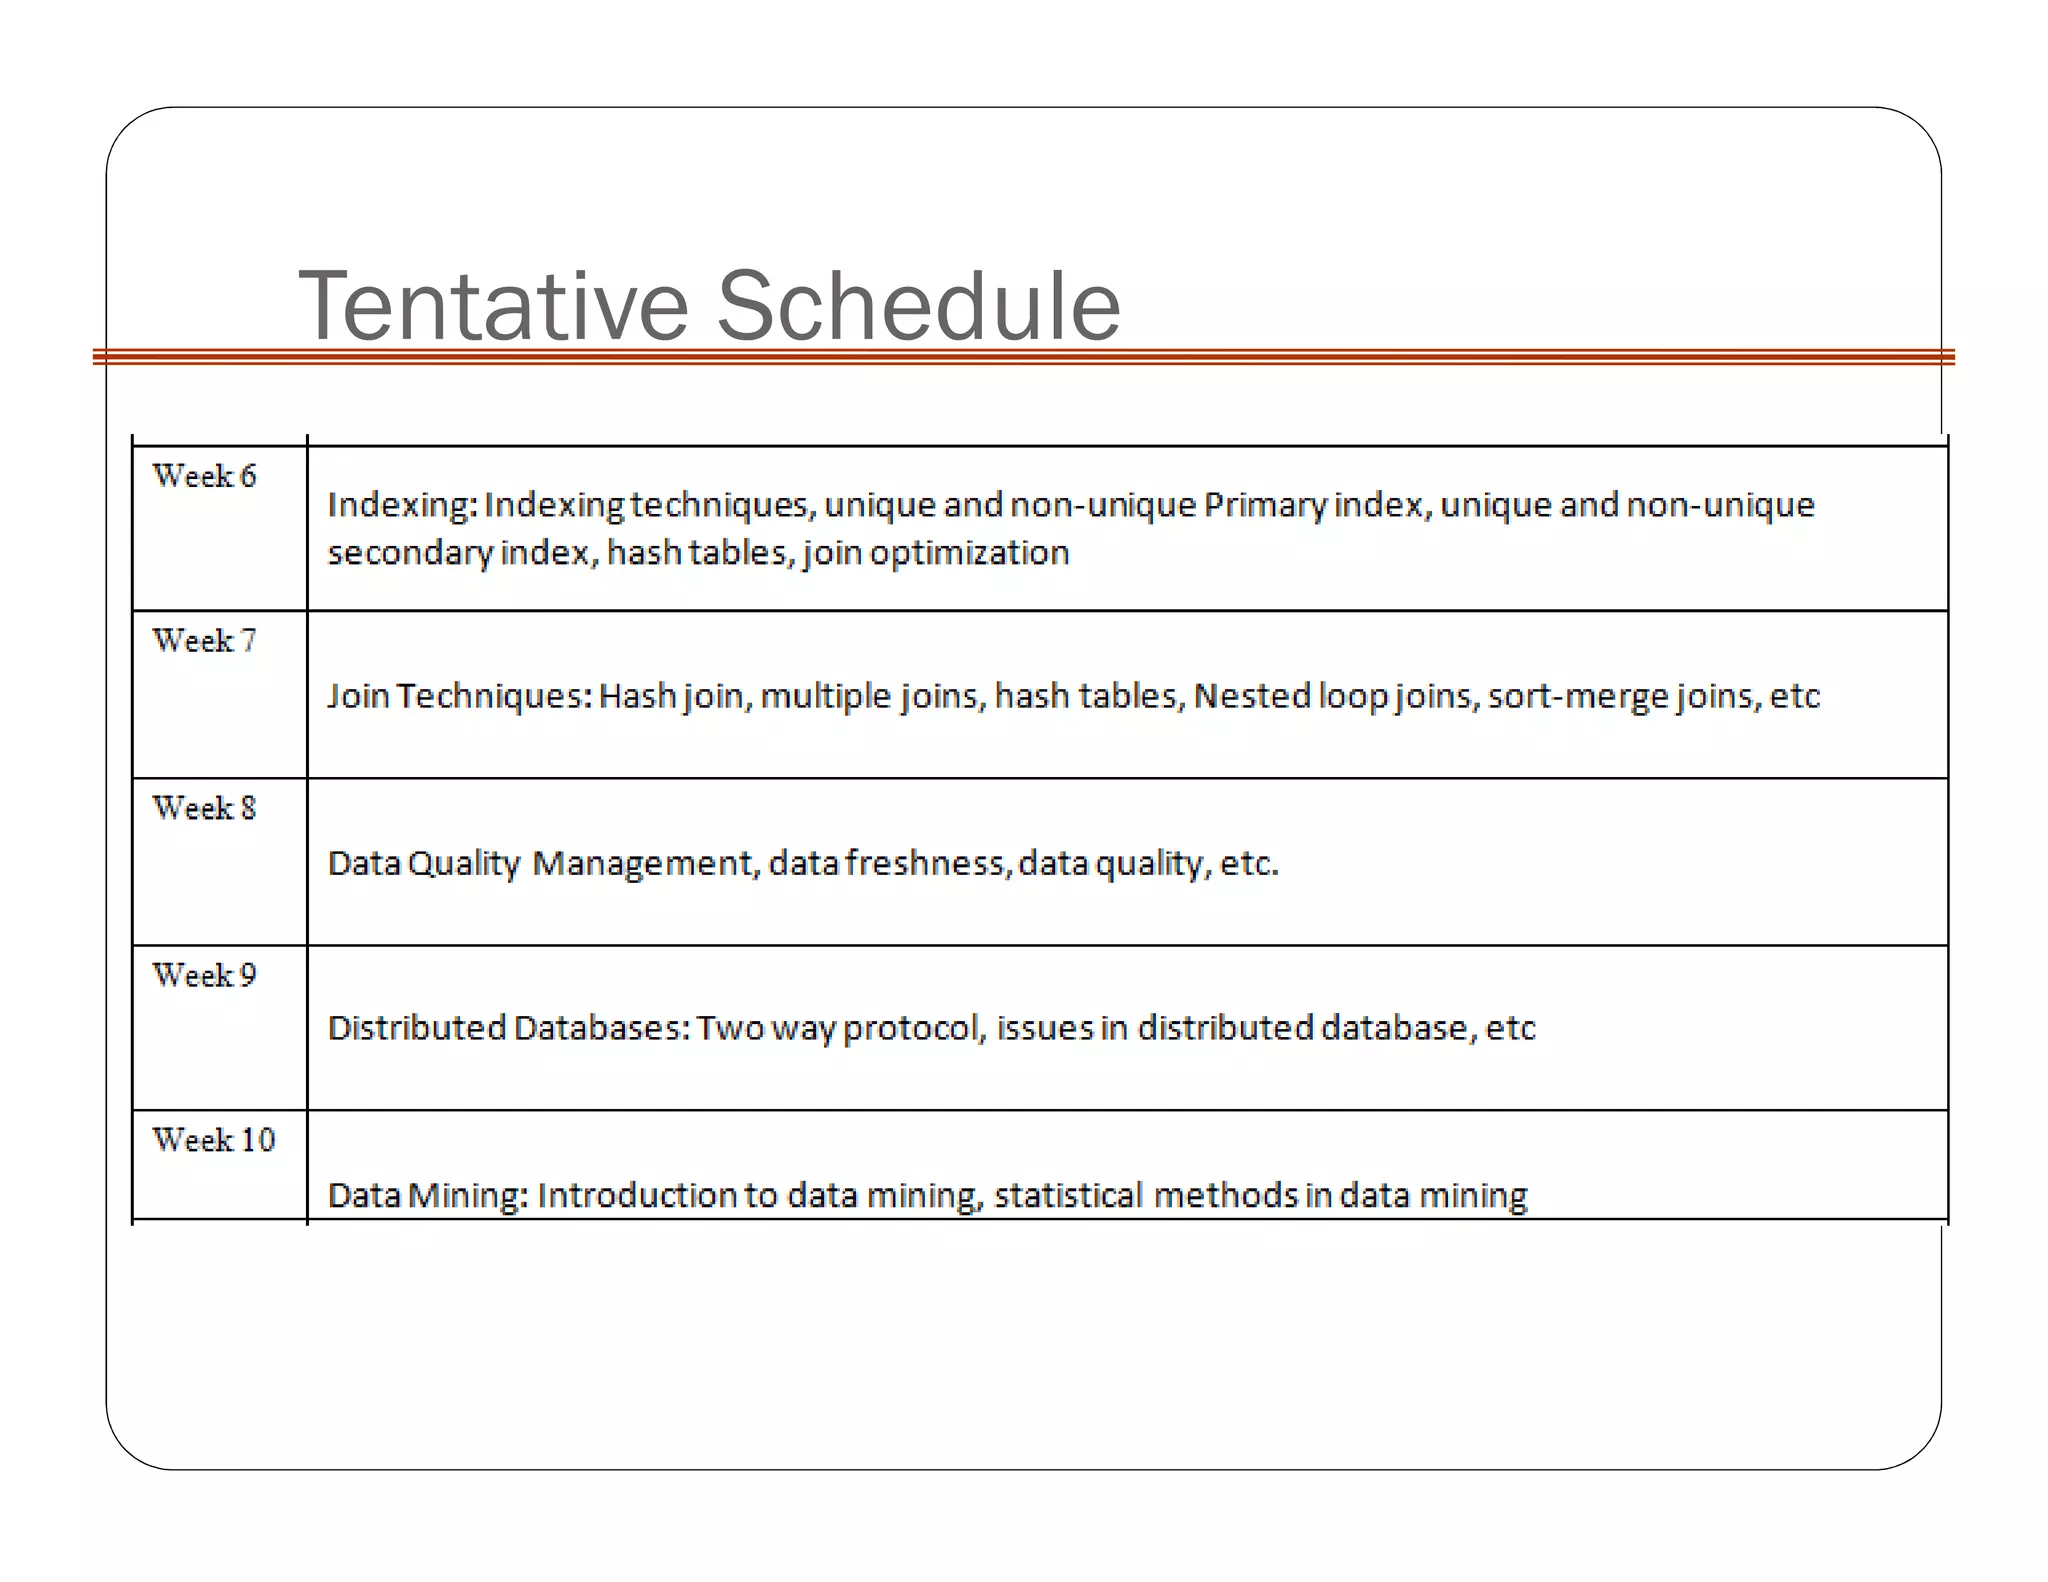
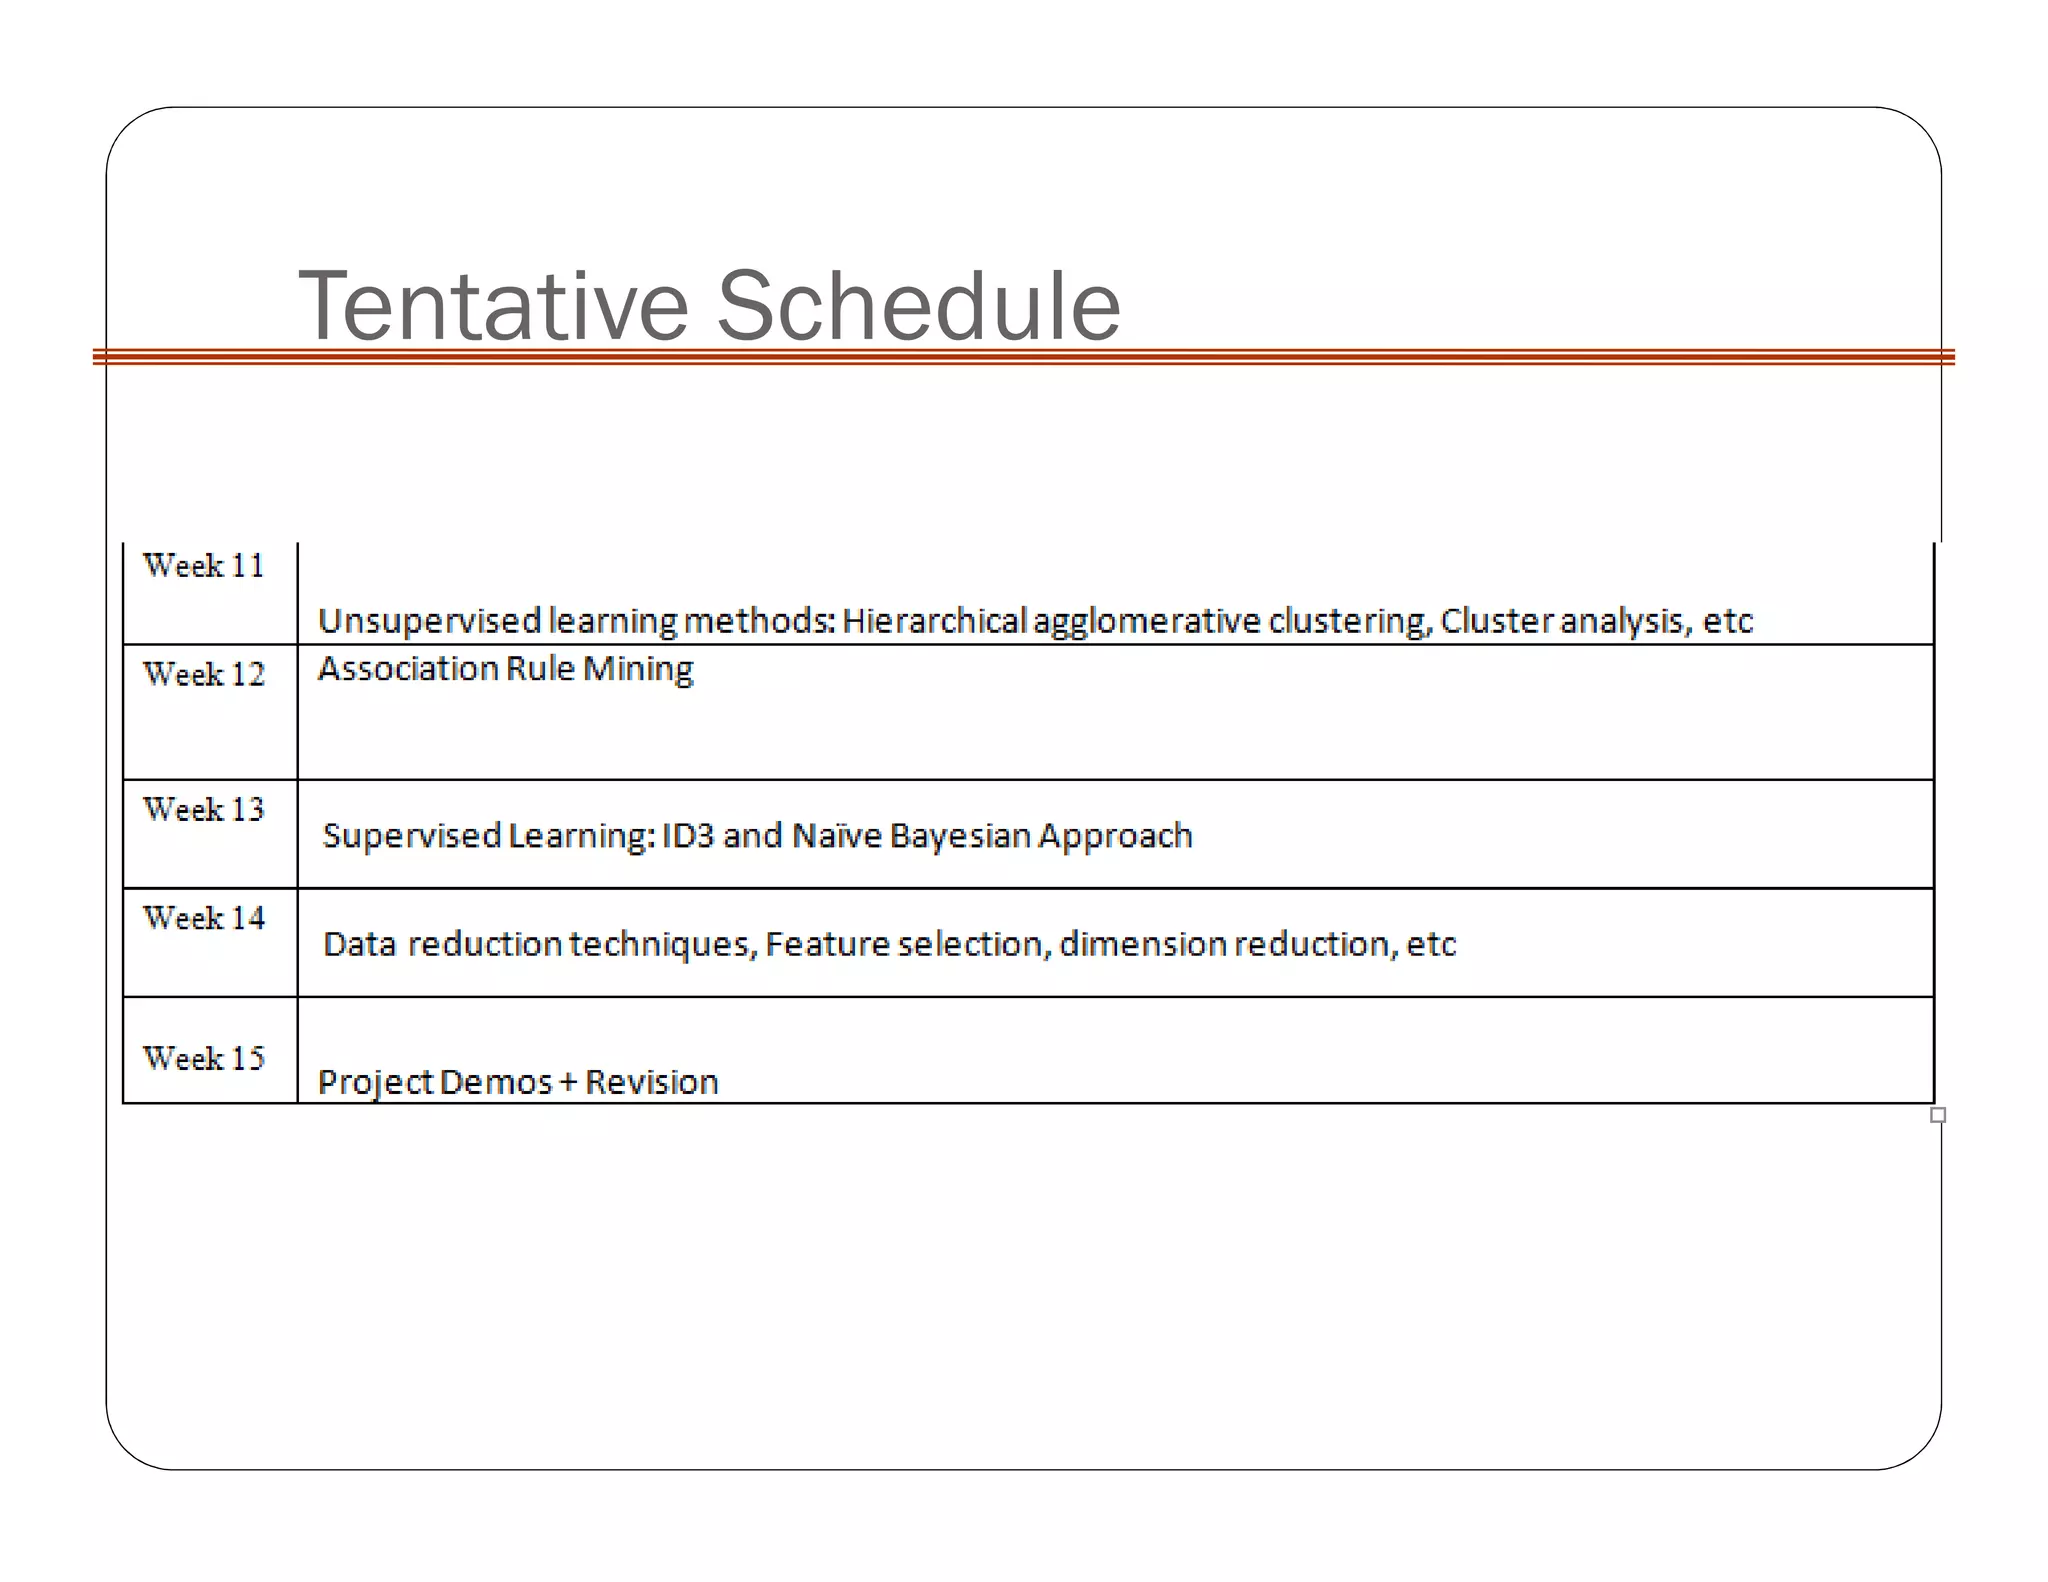
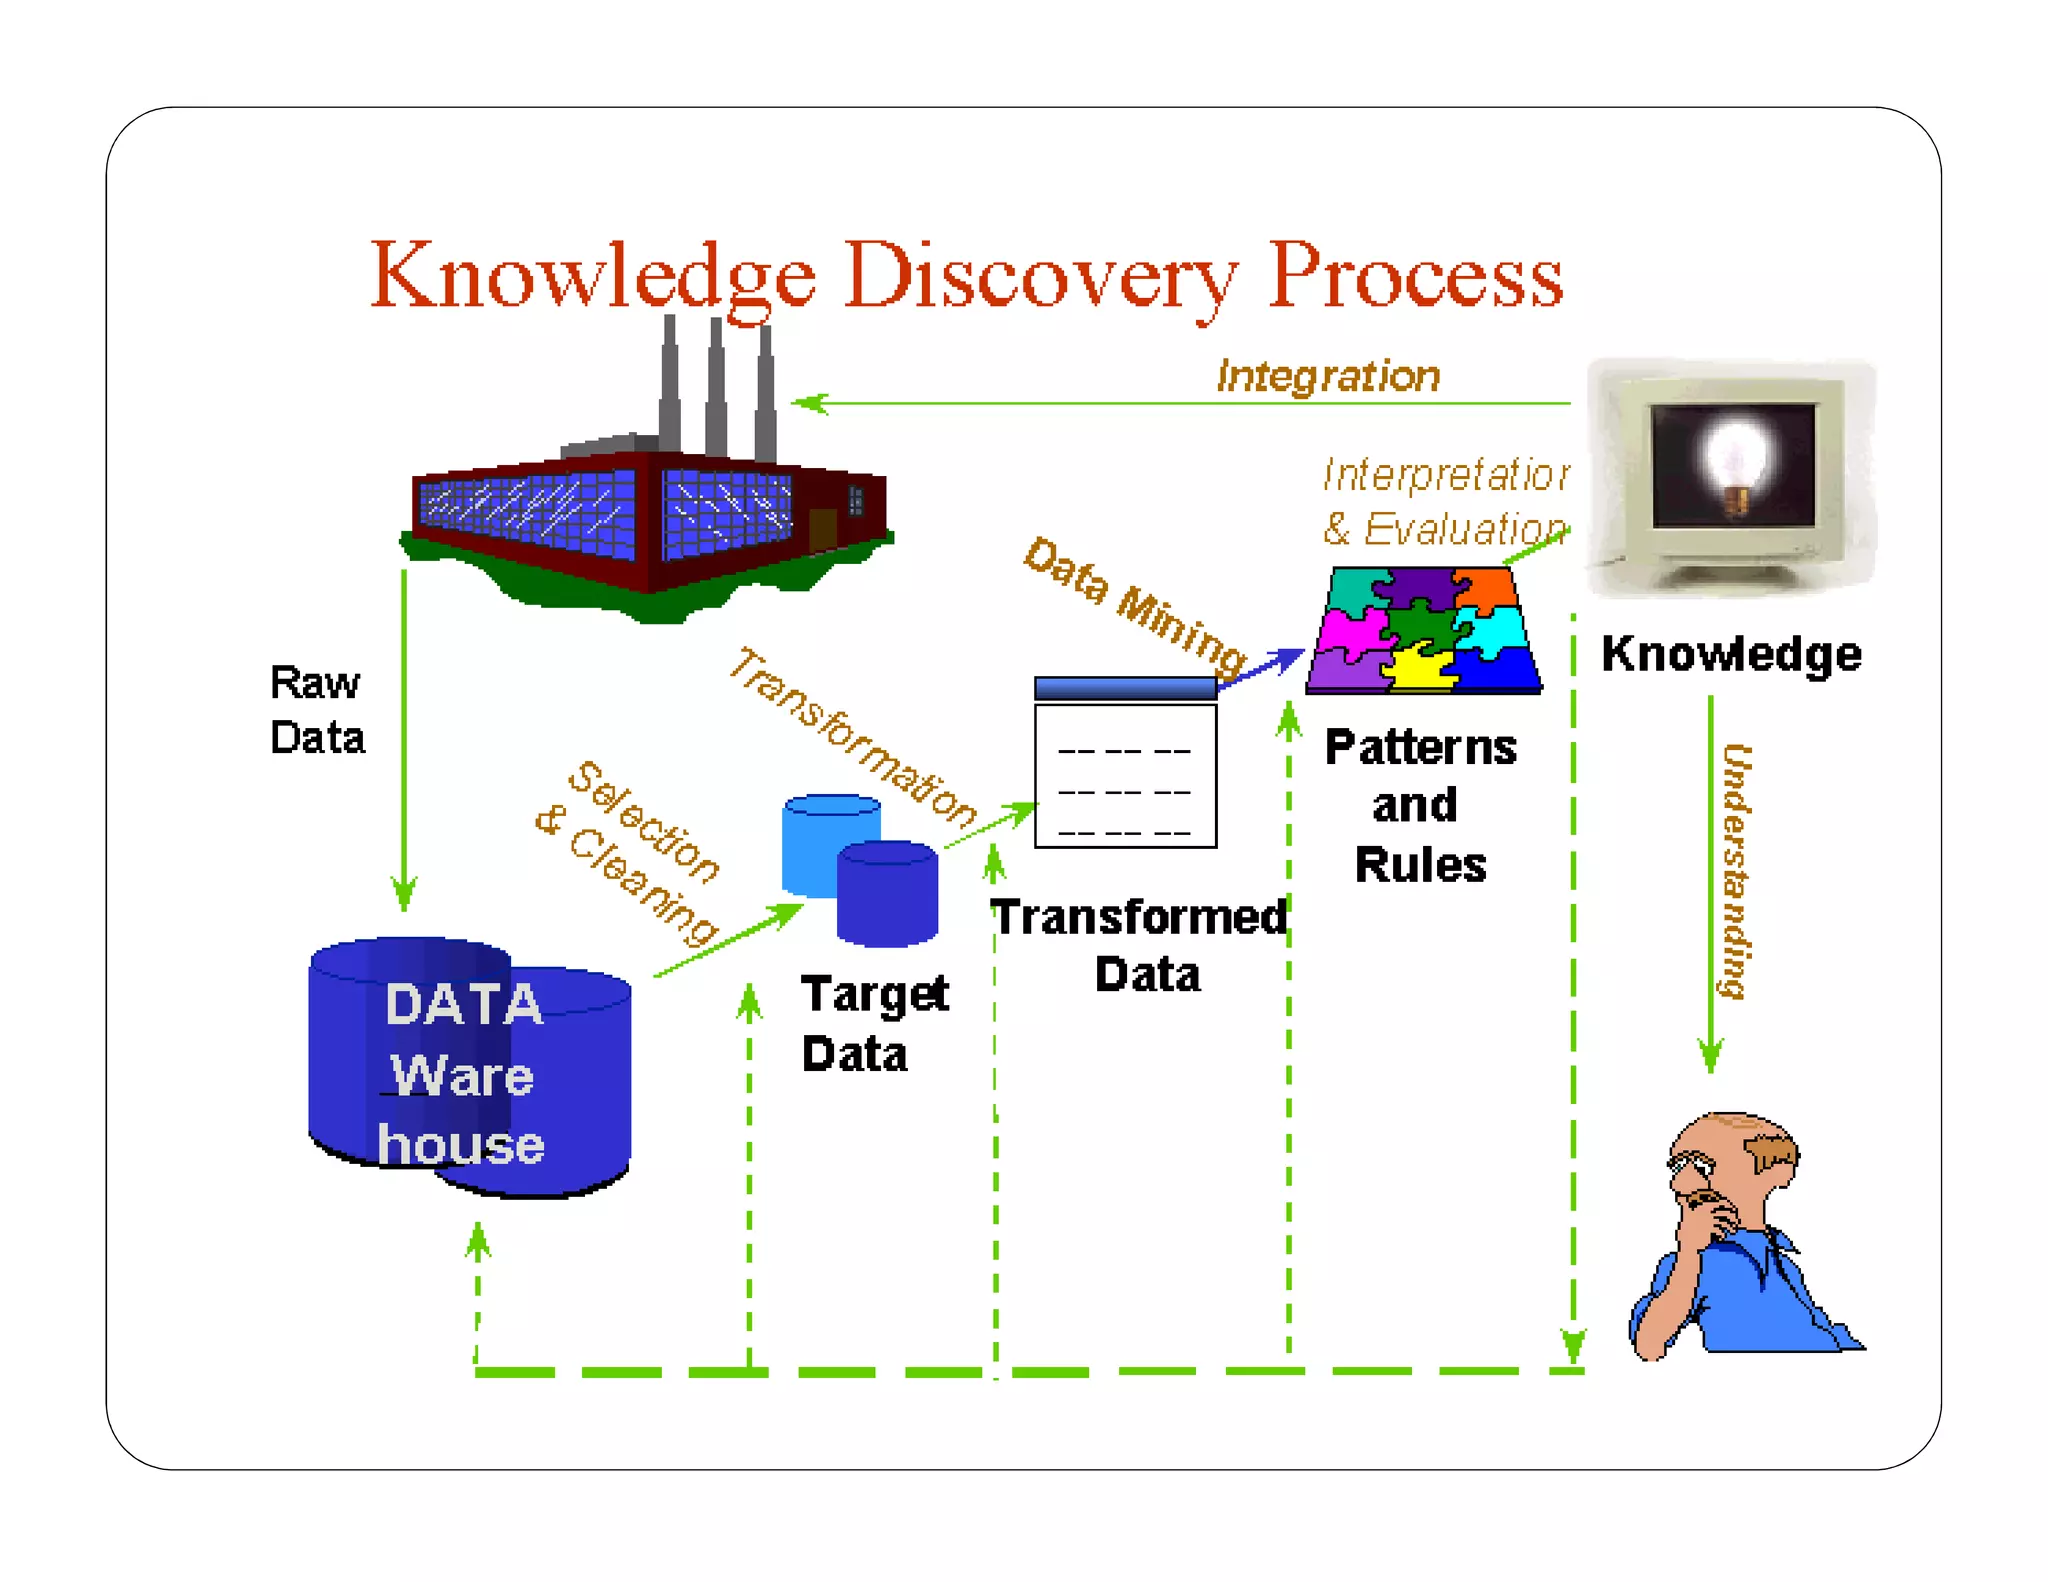
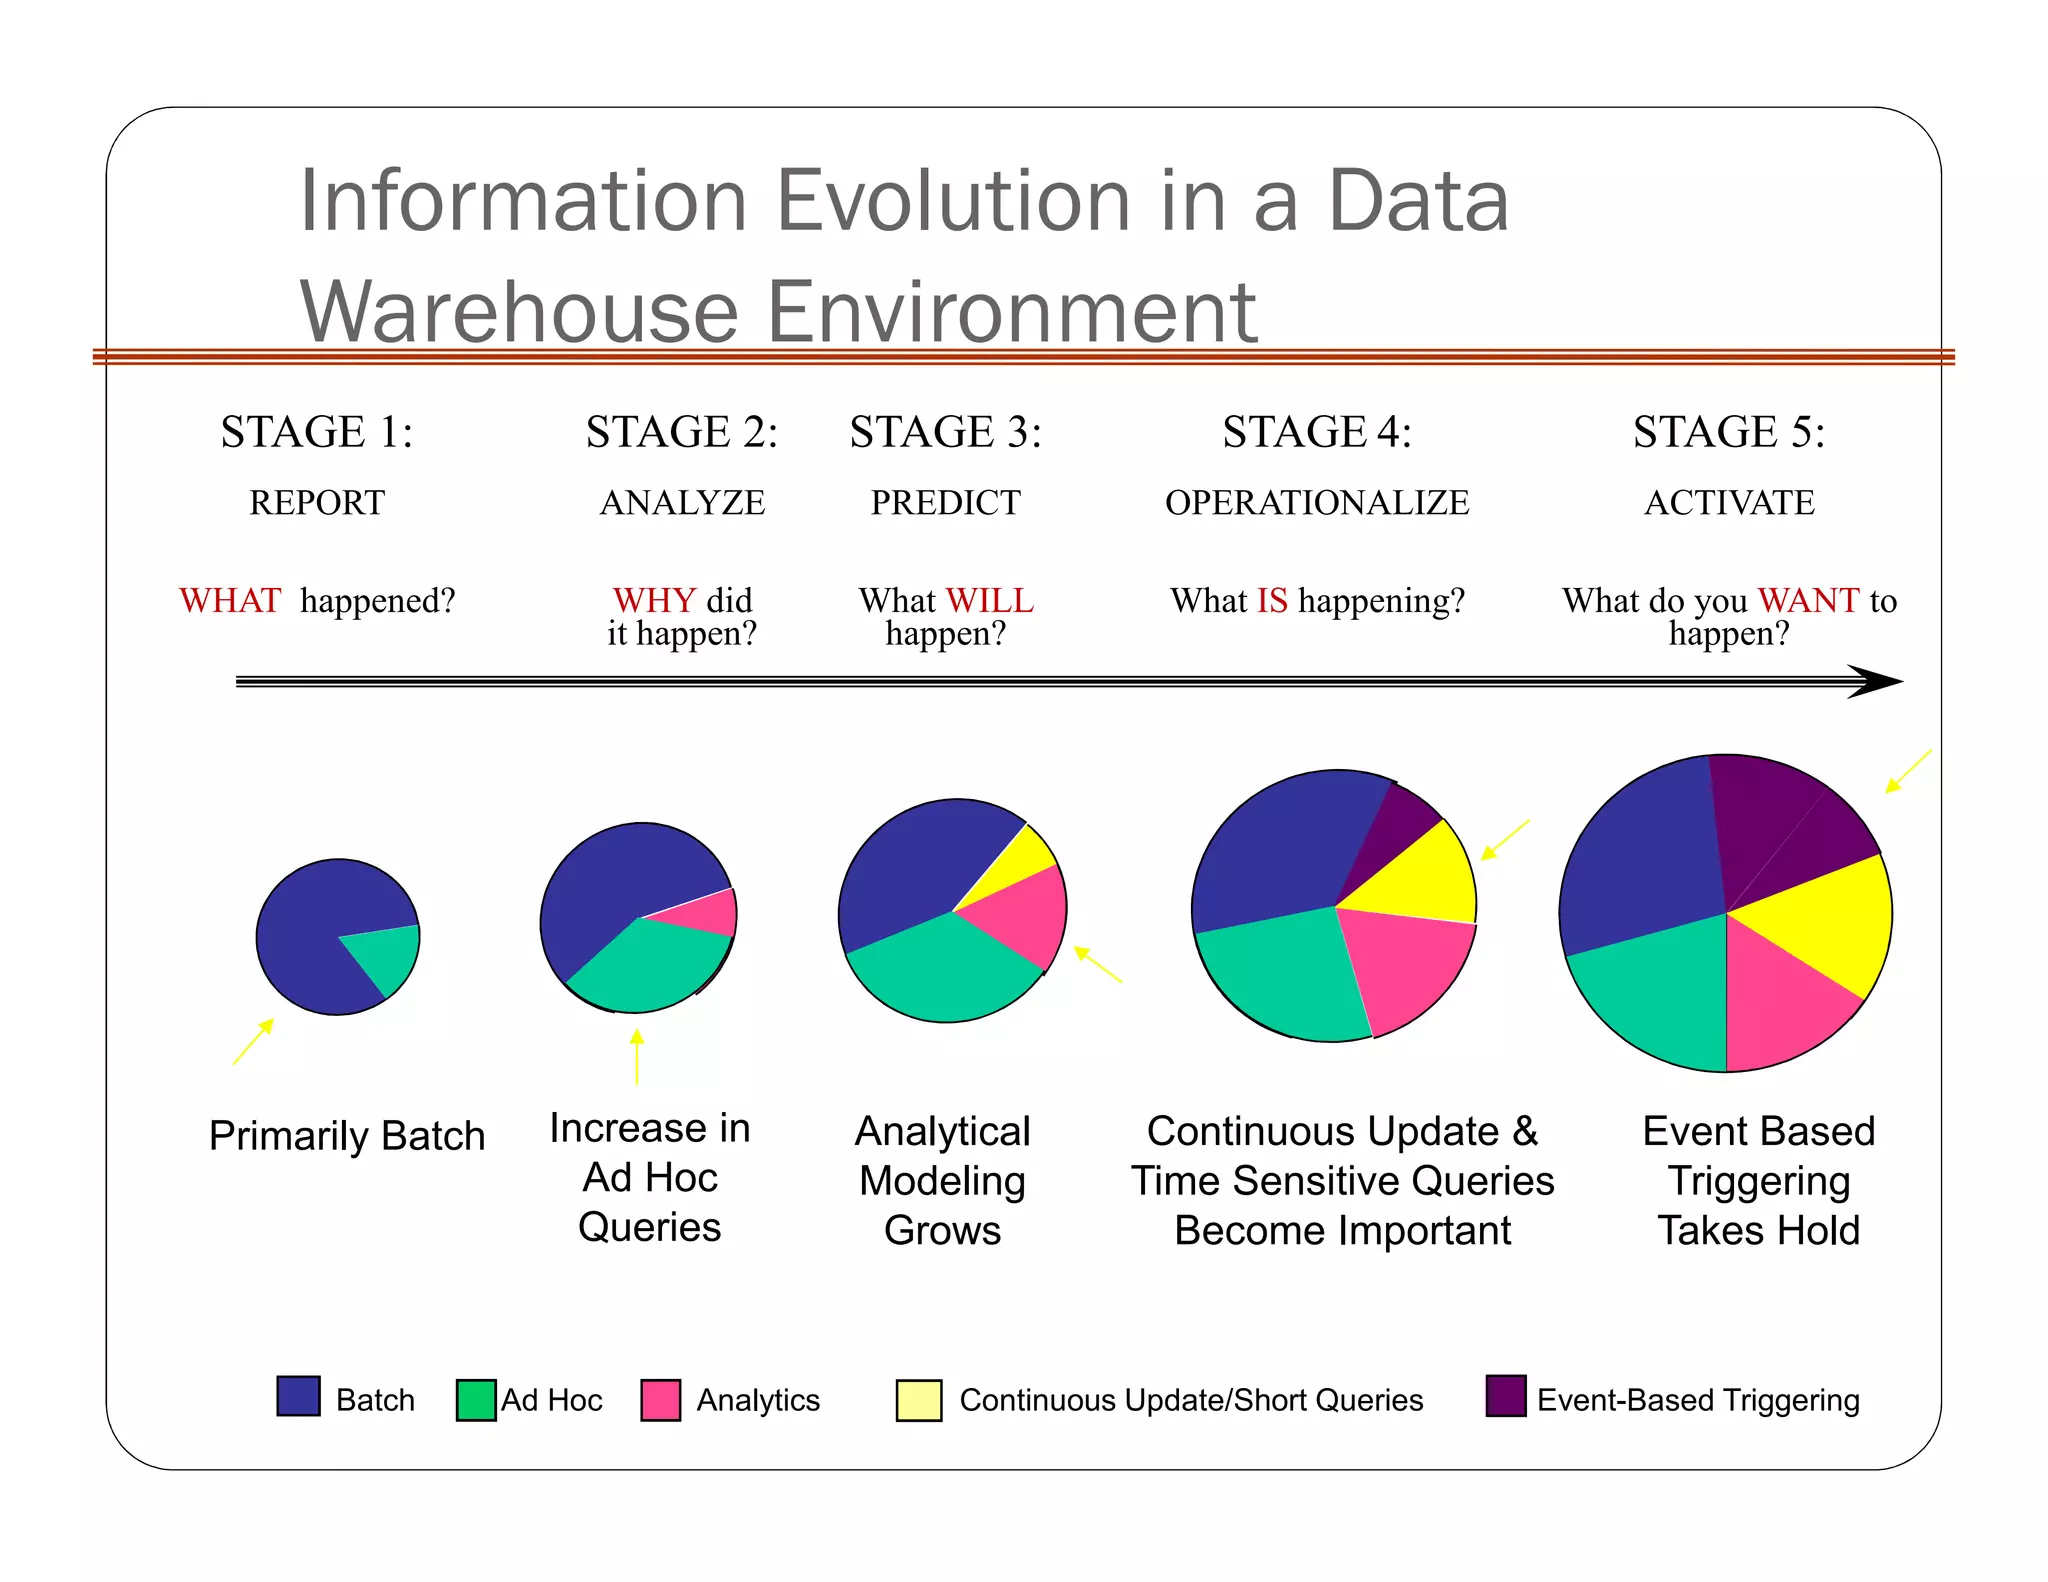
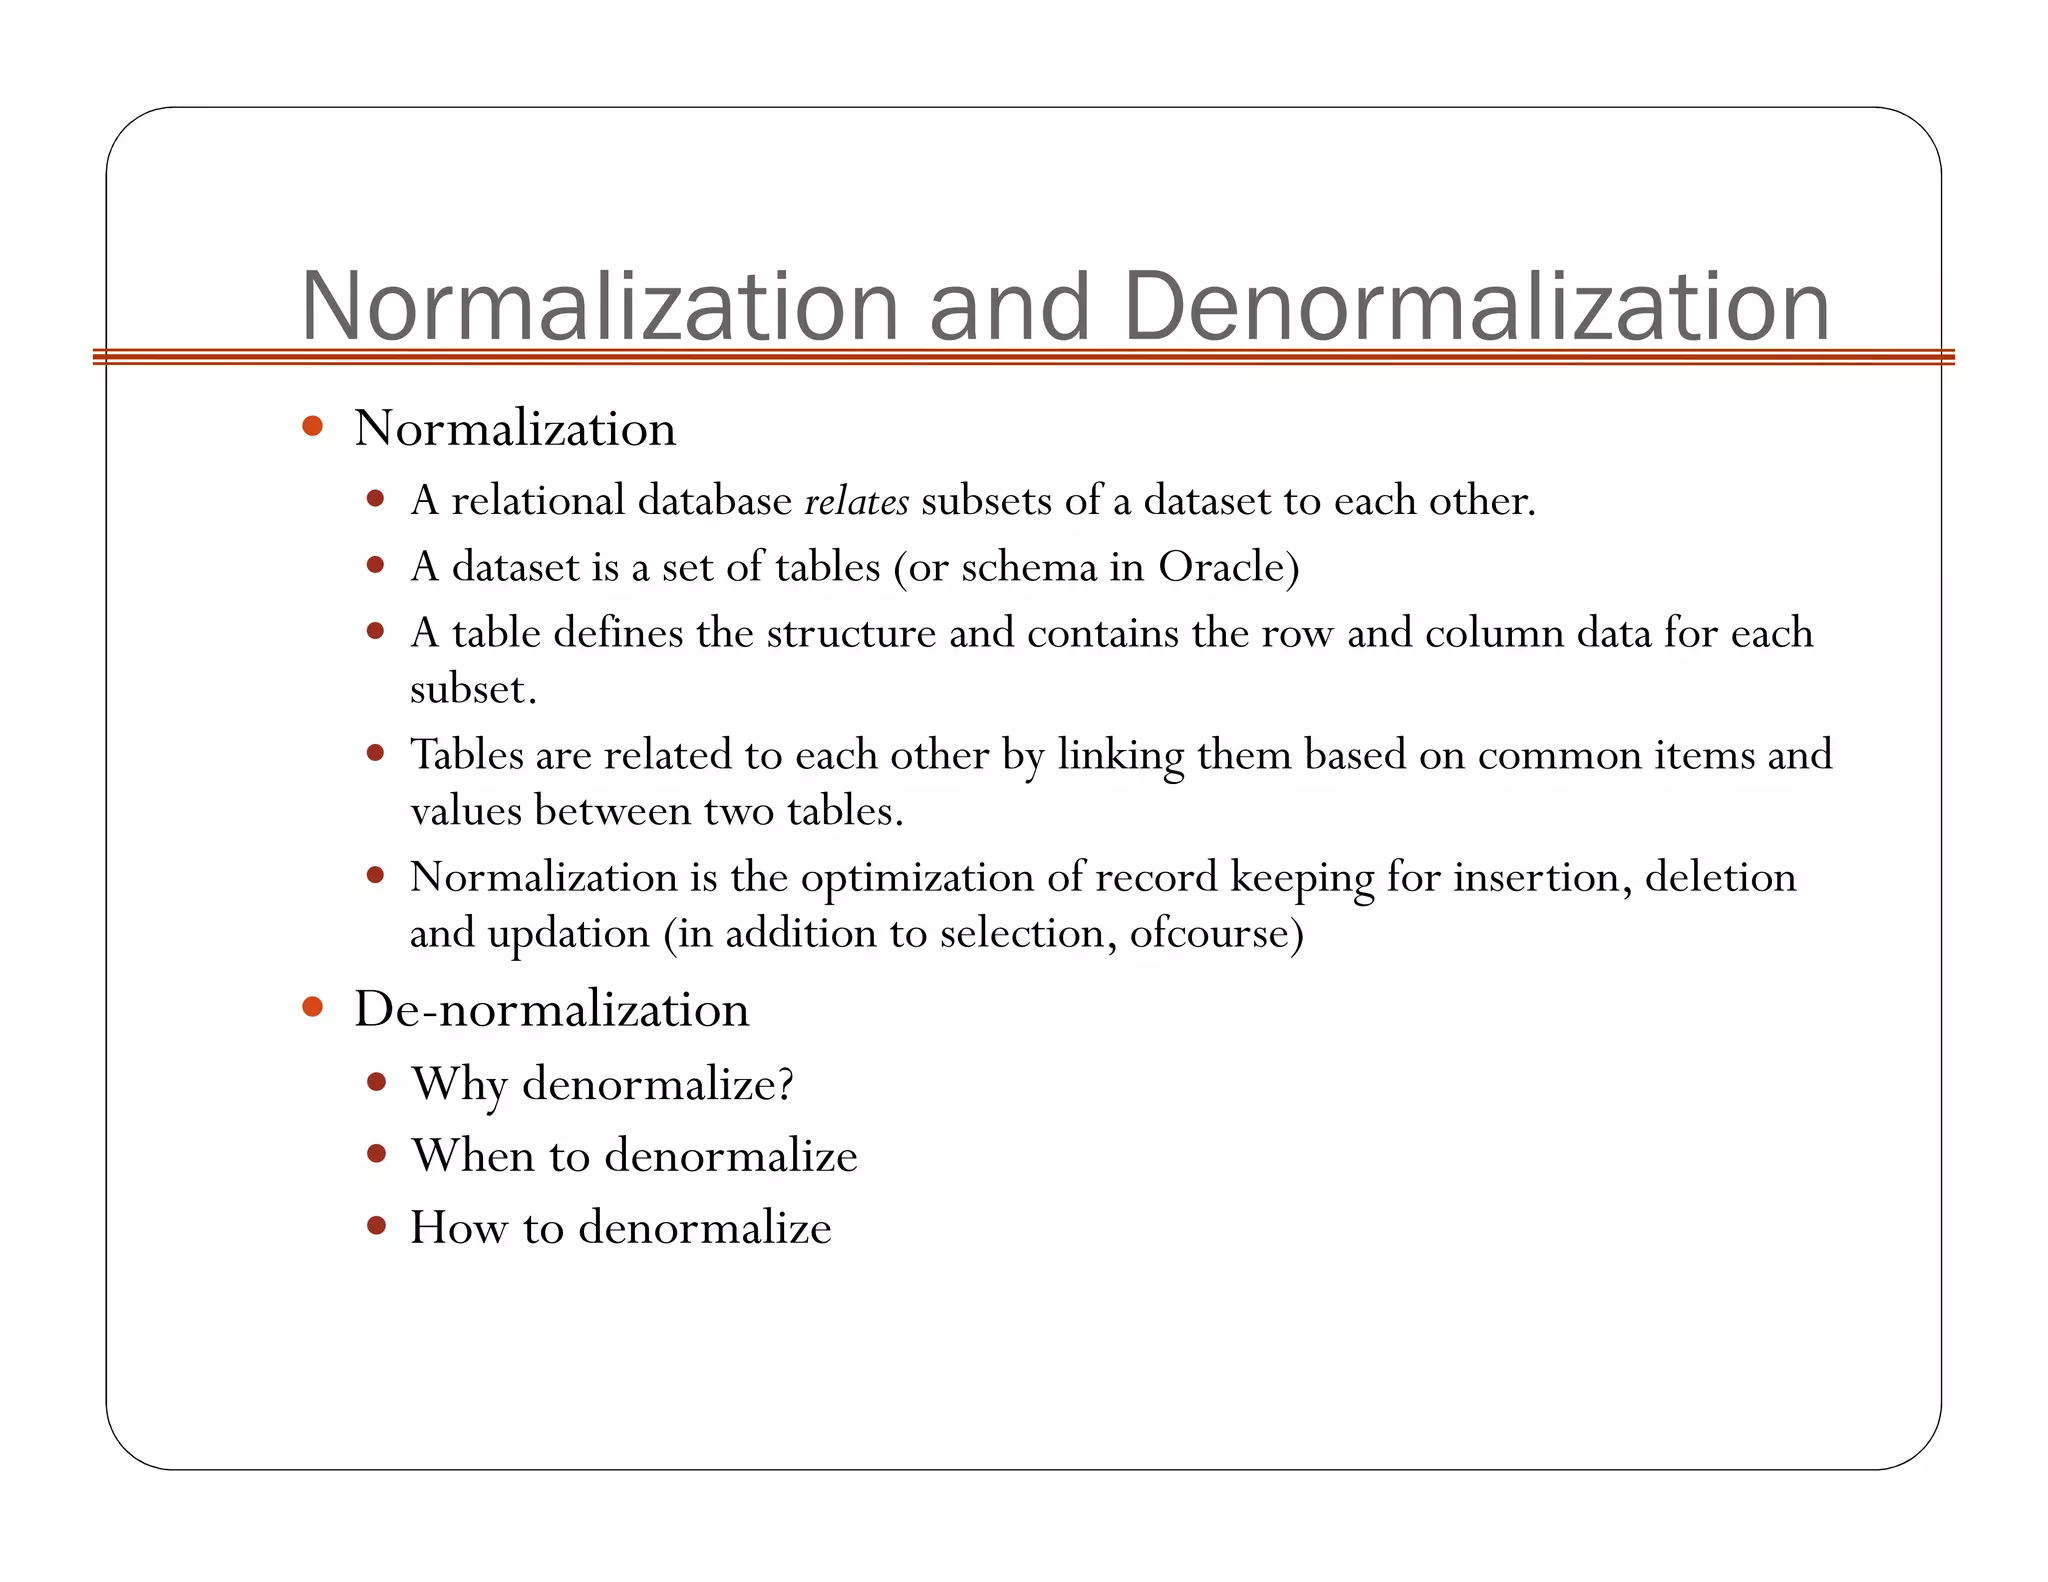
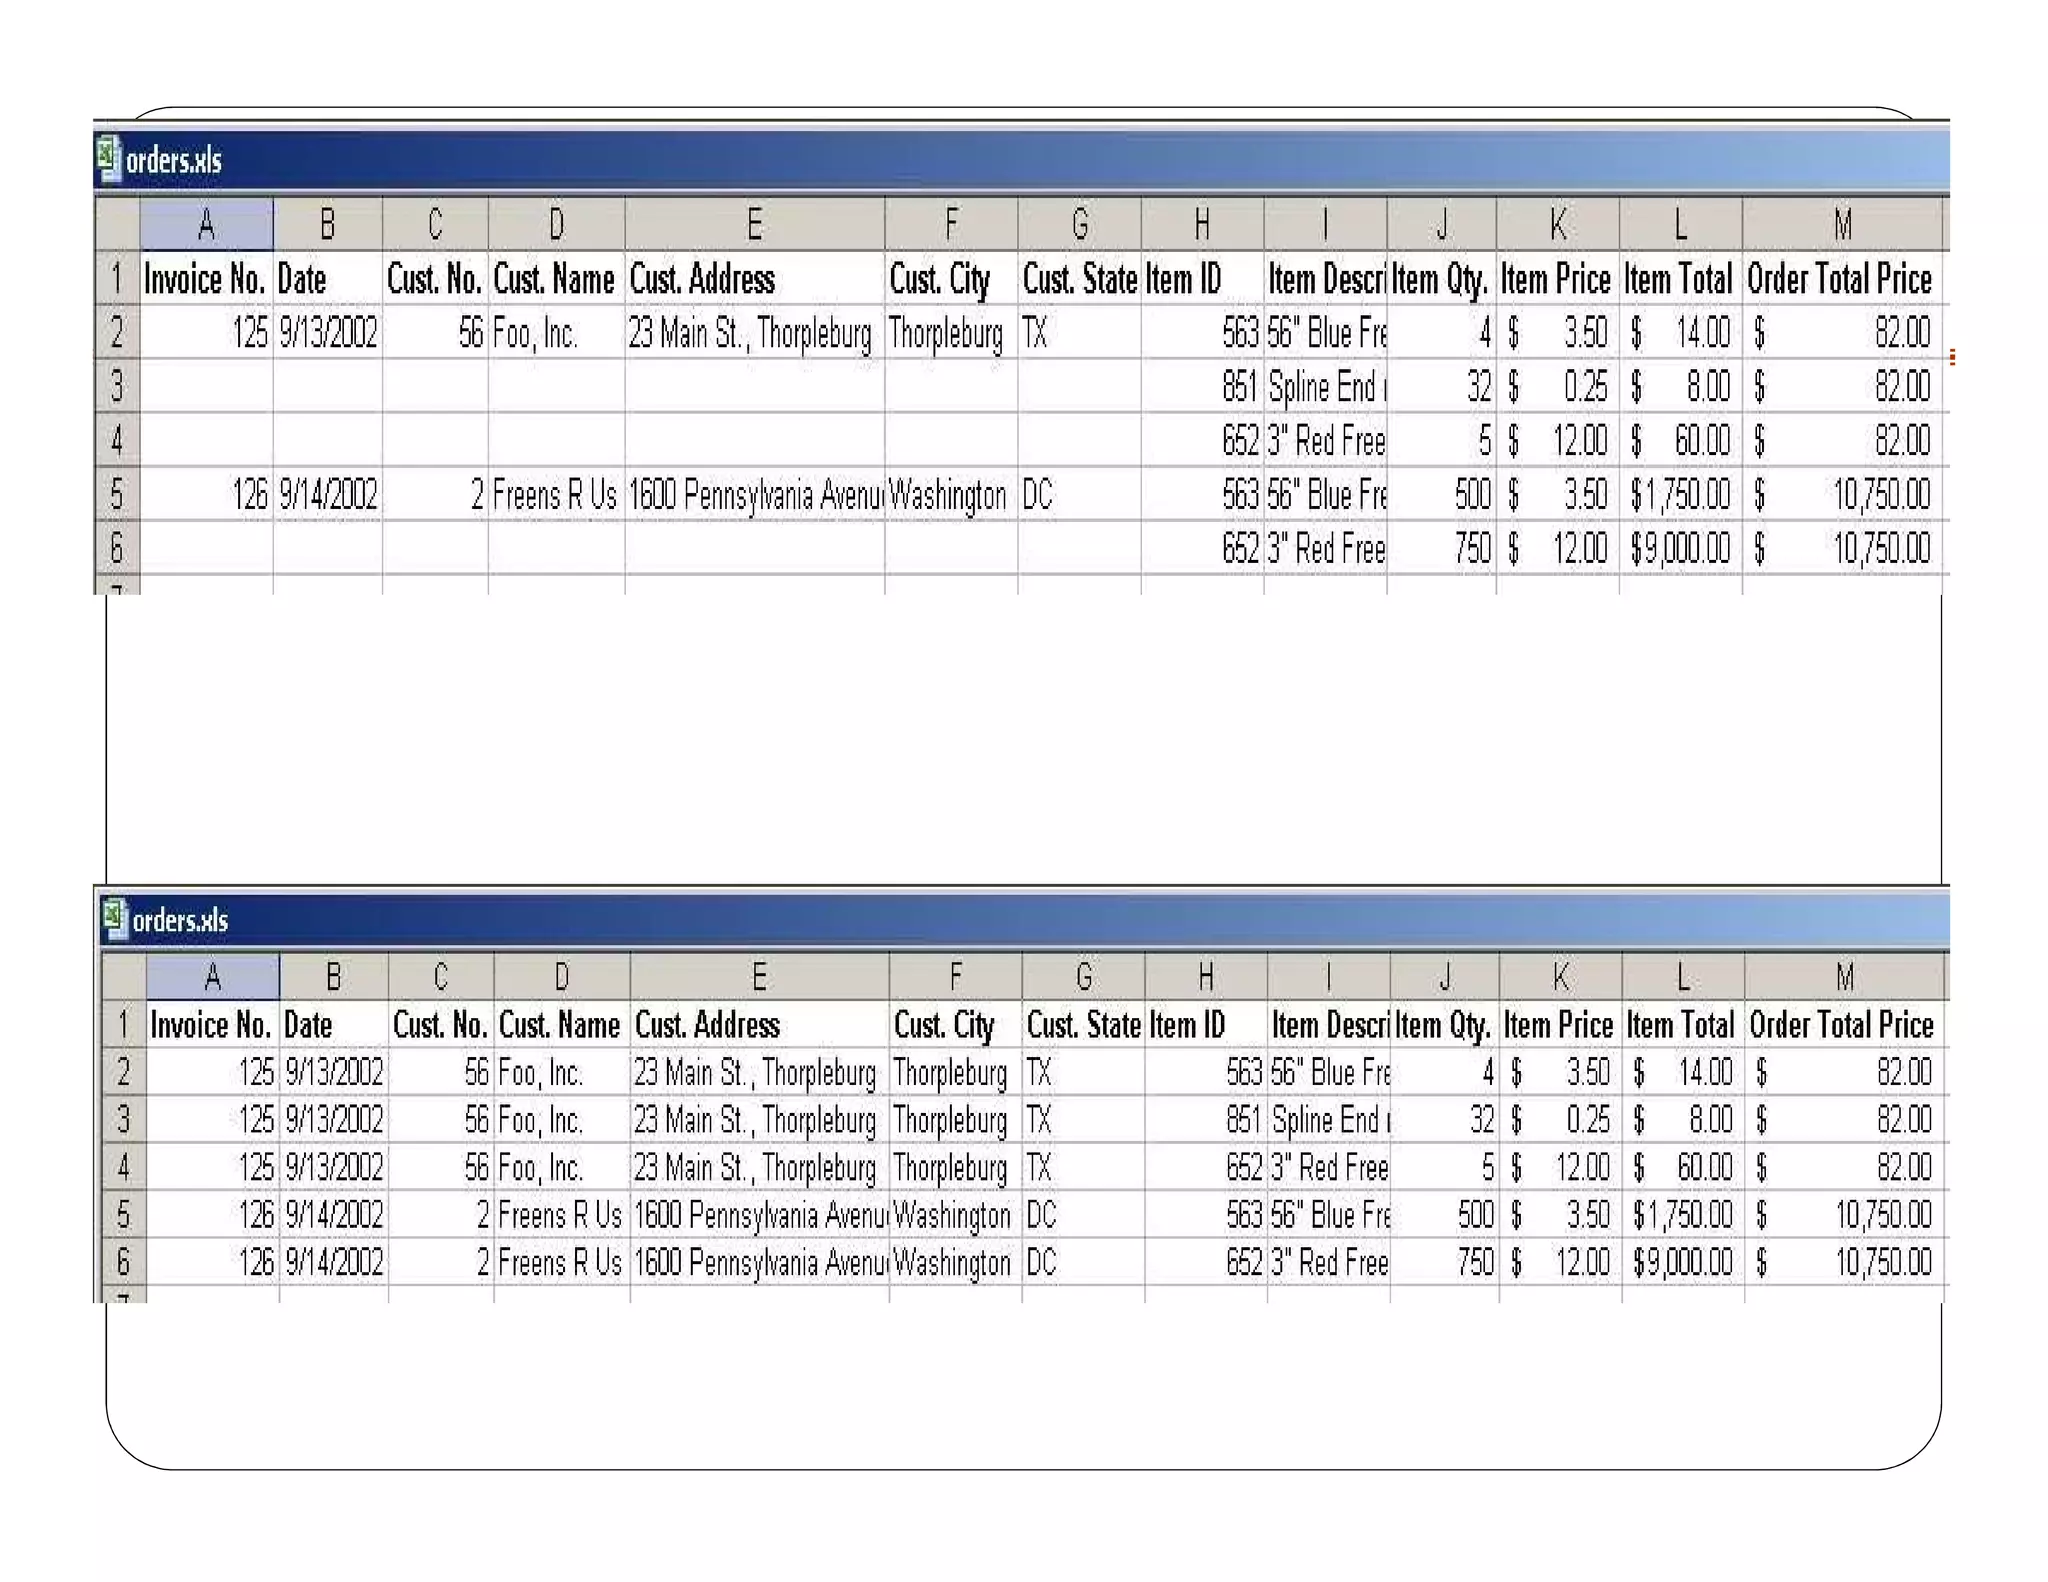
Lecture 1
Dr. Fawad Hussain
GIK Institute
Fall 2015
Data Warehousing and MiningData Warehousing and MiningData Warehousing and MiningData Warehousing and Mining
(CS437)(CS437)(CS437)(CS437)
Some lectures in this course have been partially adapted from lecture series by StephenA. Brobst, Chief Technology Officer atTeradata and
professor at MIT.
General Course Description
Datawarehousing
What is the motivation behind DataWarehousing and Mining?
Advanced Indexing, Query Processing and Optimization.
Building DataWarehouses.
Data Cubes, OLAP, De-Normalization,etc.
Data MiningTechniques
Regression
Clustering
DecisionTrees
Other Information
Office Hours (Pasted on the office door)
Office: G03 (FCSE)
CourseTA (Mr. Bilal)
Text Books (Optional)
Introduction to Data Mining;Tan, Steinbach & Kumar.
Data Mining: Concepts andTechniques by Jiawei Han and
Micheline Kamber Morgan Kaufmann Publishers, 2nd Edition,
March 2006, ISBN 1-55860-901-6.
Building a DataWarehouse for Decision Support byVidette
Poe.
Fundamentals of Database Systems by Elmasri and Navathe
Addison-Wesley, 5th Edition, 2007.
Grading Plan
Grading Plan for Course %
Tentative
Number(s)
Midterm Exam 25 01
Quizzes 10 06
Project 20 02
Final Exam 45 01
Tentative Schedule
Tentative Schedule
Tentative Schedule
Lecture 1
Introduction and Overview
Why this Course?
The world is changing (actually changed), either change or be
left behind.
Missing the opportunities or going in the wrong direction has
prevented us from growing.
What is the right direction?
Harnessing the data, in a knowledge driven economy.
The Need
Knowledge is power, Intelligence is
absolute power!
“Drowning in data and starving for
information”
Data Processing Steps
DATA
INFORMATION
POWER
INTELLIGENCE
$
End goal?
Historical Overview
1960
Master Files & Reports
1965
Lots of Master files!
1970
Direct Access Memory & DBMS
1975
Online high performance transaction processing
1980
PCs and 4GL Technology (MIS/DSS)
Post 1990
Data Warehousing and Data Mining
Crises of Credibility
What is the financial health of our company?
-10%
+10%
??
Why a Data Warehouse?
Data recording and storage is growing.
History is excellent predictor of the future.
Gives total view of the organization.
Intelligent decision-support is required for decision-
making.
Why Data Warehouse?
Size of Data Sets are going up ↑.
Cost of data storage is coming down ↓.
The amount of data average business collects and stores
is doubling every year
Total hardware and software cost to store and manage 1
Mbyte of data
1990: ~ $15
2002: ~ ¢15 (Down 100 times)
By 2007: < ¢1 (Down 150 times)
Why Data Warehouse?
A Few Examples
WalMart: 24TB
FranceTelecom: ~ 100TB
CERN: Up to 20 PB by 2006
Stanford LinearAccelerator Center (SLAC): 500TB
Businesses demand Intelligence (BI).
Complex questions from integrated data.
“Intelligent Enterprise”
List of all items that were sold last month?
List of all items purchased by X?
The total sales of the last month grouped by branch?
How many sales transactions occurred during the month of
January?
DBMS Approach
Which items sell together? Which items to stock?
Where and how to place the items? What
discounts to offer?
How best to target customers to increase sales at
a branch?
Which customers are most likely to respond to
my next promotional campaign, and why?
Intelligent Enterprise
What is a Data Warehouse?
A complete repository of historical corporate data extracted
from transaction systems that is available for ad-hoc access by
knowledge workers.
What is Data Mining?
“There are things that we know that we know…
there are things that we know that we don’t know…
there are things that we don’t know we don’t know.”
Donald Rumsfield
Former US Secretary of Defence
What is Data Mining?
Tell me something that I should know.
When you don’t know what you should be knowing,
how do you write SQL?
You cant!!
What is Data Mining?
Knowledge Discovery in Databases (KDD).
Data mining digs out valuable non-trivial information from large
multidimensional apparently unrelated data bases(sets).
It’s the integration of business knowledge, people, information,
algorithms, statistics and computing technology.
Discovering useful hidden patterns and relationships in data.
HUGE VOLUME THERE IS WAY TOO MUCH
DATA & GROWING!
Data collected much faster than it can be processed or
managed. NASA Earth Observation System (EOS), will
alone, collect 15 Peta bytes by 2007
(15,000,000,000,000,000 bytes).
• Much of which won't be used - ever!
• Much of which won't be seen - ever!
• Why not?
There's so much volume, usefulness of some of it will never
be discovered
SOLUTION: Reduce the volume and/or raise the
information content by structuring, querying, filtering,
summarizing, aggregating, mining...
Requires solution of fundamentally new
problems
1. developing algorithms and systems to mine large, massive
and high dimensional data sets;
2. developing algorithms and systems to mine new types of
data (images, music, videos);
3. developing algorithms, protocols, and other infrastructure
to mine distributed data; and
4. improving the ease of use of data mining systems;
5. developing appropriate privacy and security techniques
for data mining.
Future of Data Mining
10 Hottest Jobs of year 2025
TIME Magazine,22 May,2000
10 emerging areas of technology
MIT’s Magazine ofTechnology Review,
Jan/Feb,2001
Data Mining
Data Mining
Machine
Learning
Database
Technology
Statistics
Visualization
Other
Disciplines
Information
Science
Logical and Physical DatabaseLogical and Physical DatabaseLogical and Physical DatabaseLogical and Physical Database
DesignDesignDesignDesign
Data Mining is one step of Knowledge
Discovery in Databases (KDD)
Raw
Data
Preprocessing
• Extraction
• Transformation
• Cleansing
• Validation
Data Mining
• Identify Patterns
• Create Models
Interpretation/
Evaluation
• Visualization
• Feature Extraction
• Analysis
Clean
Data
$ $ $
Knowledge
Information Evolution in a Data
Warehouse Environment
Primarily Batch Event Based
Triggering
Takes Hold
Increase in
Ad Hoc
Queries
Analytical
Modeling
Grows
Continuous Update &
Time Sensitive Queries
Become Important
Batch Ad Hoc Analytics Continuous Update/Short Queries Event-Based Triggering
STAGE 2:
ANALYZE
WHY did
it happen?
STAGE 3:
PREDICT
What WILL
happen?
STAGE 1:
REPORT
WHAT happened?
STAGE 4:
OPERATIONALIZE
What IS happening?
STAGE 5:
ACTIVATE
What do you WANT to
happen?
Normalization and Denormalization
Normalization
A relational database relates subsets of a dataset to each other.
A dataset is a set of tables (or schema in Oracle)
A table defines the structure and contains the row and column data for each
subset.
Tables are related to each other by linking them based on common items and
values between two tables.
Normalization is the optimization of record keeping for insertion, deletion
and updation (in addition to selection, ofcourse)
De-normalization
Why denormalize?
When to denormalize
How to denormalize
Why De-normalization?
Do you have performance problems?
If not, then you shouldn’t be studying this course!
The root cause of 99% of database performance problems is
poorly written SQL code.
Usually as a result of poorly optimized underlying structure
Do you have disk storage problems?
Consider separating large, less used datasets and frequently used
datasets.
When to Denormalize?
Denormalization sometimes implies the undoing of some of the
steps of Normalization
Denormalization is not necessarily the reverse of the steps of
Normalization.
Denormalization does not imply complete removal of specific
Normal Form levels.
Denormalization results in duplication.
It is quite possible that table structure is much too granular or possibly even
incompatible with structure imposed by applications.
Denormalization usually involves merging of multiple
transactional tables or multiple static tables into single
When to Denormalize?
Look for one-to-one relationships.
These may be unnecessary if the required removal of null values
causes costly joins. Disk space is cheap. Complex SQL join statements
can destroy performance.
Do you have many-to-many join resolution entities? Are they all
necessary? Are they all used by applications?
When constructing SQL statement joins are you finding many
tables in joins where those tables are scattered throughout the
entity relationship diagram?
When searching for static data items such as customer details are
you querying a single or multiple tables?
A single table is much more efficient than multiple tables.
How to Denormalize?
Common Forms of Denormalization
Pre-join de-normalization.
Column replication or movement.
Pre-aggregation.
Considerations in Assessing
De-normalization
Performance implications
Storage implications
Ease-of-use implications
Maintenance implications
Most commonly missed/disregarded.
Pre-join Denormalization
Take tables which are frequently joined and “glue” them together
into a single table.
Avoids performance impact of the frequent joins.
Typically increases storage requirements.
Pre-join Denormalization
A simplified retail example...
Before denormalization:
sale_id store_id sale_dt …
tx_id sale_id item_id … item_qty sale$
1
m
Pre-join Denormalization
tx_id sale_id store_id sale_dt item_id … item_qty $
A simplified retail example...
After denormalization:
Points to Ponder
Which Normal Form is being violated?
Will there be maintenance issues?
Pre-join Denormalization
Storage implications...
Assume 1:3 record count ratio between sales header and detail.
Assume 1 billion sales (3 billion sales detail).
Assume 8 byte sales_id.
Assume 30 byte header and 40 byte detail records.
Which businesses will be most hurt, in terms of storage capacity, by
this form of denormalization?
Pre-join Denormalization
Storage implications...
Before denormalization: 150 GB raw data.
After denormalization: 186 GB raw data.
Net result is 24% increase in raw data size for the database.
Pre-join may actually result in space saving, if many concurrent queries are
demanding frequent joins on the joined tables! HOW?
Pre-join Denormalization
Sample Query:
What was my total $ volume betweenThanksgiving and Christmas in
1999?
Pre-join Denormalization
Before de-normalization:
select sum(sales_detail.sale_amt)
from sales
,sales_detail
where sales.sales_id =
sales_detail.sales_id
and sales.sales_dt between '1999-11-26'
and '1999-12-25'
;
Pre-join Denormalization
After de-normalization:
select sum(d_sales_detail.sale_amt)
from d_sales_detail
where d_sales_detail.sales_dt between '1999-
11-26' and '1999-12-25'
;
No join operation performed.
How to compare performance?
Pre-join Denormalization
But consider the question...
How many sales (transactions) did I make betweenThanksgiving and
Christmas in 1999?
Pre-join Denormalization
Before denormalization:
select count(*)
from sales
where sales.sales_dt between '1999-11-26' and
'1999-12-25';
After denormalization:
select count(distinct d_sales_detail.sales_id)
from d_sales_detail
where d_sales_detail.sales_dt between '1999-11-
26' and '1999-12-25';
Which query will perform better?
Pre-join Denormalization
Performance implications...
Performance penalty for count distinct (forces sort) can be quite large.
May be worth 30 GB overhead to keep sales header records if this is a common
query structure because both ease-of-use and performance will be enhanced (at
some cost in storage)?
Considerations in Assessing
De-normalization
Performance implications
Storage implications
Ease-of-use implications
Maintenance implications
Most commonly missed/disregarded.
Column Replication or Movement
Take columns that are frequently accessed via large scale joins and
replicate (or move) them into detail table(s) to avoid join
operation.
Avoids performance impact of the frequent joins.
Increases storage requirements for database.
Possible to “move” frequently accessed column to detail instead of
replicating it.
Note: This technique is no different than a limited form of the pre-
join denormalization described previously.
ColA ColB
Table_1
ColA ColC ColD … ColZ
Table_2
ColA ColB
Table_1’
ColA ColC ColD … ColZ
Table_2
ColC
Column Replication or Movement
Health Care DW Example: Take member_id from claim header
and move it to claim detail.
Result: An extra ten bytes per row on claim line table allows
avoiding join to claim header table on some (many?) queries.
Which normal form does this technique violates?
Column Replication or Movement
Beware of the results of de-normalization:
Assuming a 100 byte record before the denormalization, all scans
through the claim line detail will now take 10% longer than
previously.
A significant percentage of queries must get benefit from access to
the denormalized column in order to justify movement into the
claim line table.
Need to quantify both cost and benefit of each denormalization
decision.
Column Replication or Movement
May want to replicate columns in order to facilitate co-location of commonly joined
tables.
Before denormalization:
A three table join requires re-distribution of significant amounts of data to answer many
important questions related to customer transaction behavior.
Customer_Id Customer_Nm Address Ph …
Account_Id Customer_Id Balance$ Open_Dt …
Tx_Id Account_Id Tx$ Tx_Dt Location_Id …
1
m
1
m
CustTable
AcctTable
TrxTable

Cs437 lecture 1-6

  • 1.
    Lecture 1 Dr. FawadHussain GIK Institute Fall 2015 Data Warehousing and MiningData Warehousing and MiningData Warehousing and MiningData Warehousing and Mining (CS437)(CS437)(CS437)(CS437) Some lectures in this course have been partially adapted from lecture series by StephenA. Brobst, Chief Technology Officer atTeradata and professor at MIT.
  • 2.
    General Course Description Datawarehousing Whatis the motivation behind DataWarehousing and Mining? Advanced Indexing, Query Processing and Optimization. Building DataWarehouses. Data Cubes, OLAP, De-Normalization,etc. Data MiningTechniques Regression Clustering DecisionTrees Other Information Office Hours (Pasted on the office door) Office: G03 (FCSE) CourseTA (Mr. Bilal)
  • 3.
    Text Books (Optional) Introductionto Data Mining;Tan, Steinbach & Kumar. Data Mining: Concepts andTechniques by Jiawei Han and Micheline Kamber Morgan Kaufmann Publishers, 2nd Edition, March 2006, ISBN 1-55860-901-6. Building a DataWarehouse for Decision Support byVidette Poe. Fundamentals of Database Systems by Elmasri and Navathe Addison-Wesley, 5th Edition, 2007.
  • 4.
    Grading Plan Grading Planfor Course % Tentative Number(s) Midterm Exam 25 01 Quizzes 10 06 Project 20 02 Final Exam 45 01
  • 5.
  • 6.
  • 7.
  • 8.
  • 9.
    Why this Course? Theworld is changing (actually changed), either change or be left behind. Missing the opportunities or going in the wrong direction has prevented us from growing. What is the right direction? Harnessing the data, in a knowledge driven economy.
  • 10.
    The Need Knowledge ispower, Intelligence is absolute power! “Drowning in data and starving for information”
  • 11.
  • 12.
    Historical Overview 1960 Master Files& Reports 1965 Lots of Master files! 1970 Direct Access Memory & DBMS 1975 Online high performance transaction processing 1980 PCs and 4GL Technology (MIS/DSS) Post 1990 Data Warehousing and Data Mining
  • 13.
    Crises of Credibility Whatis the financial health of our company? -10% +10% ??
  • 14.
    Why a DataWarehouse? Data recording and storage is growing. History is excellent predictor of the future. Gives total view of the organization. Intelligent decision-support is required for decision- making.
  • 15.
    Why Data Warehouse? Sizeof Data Sets are going up ↑. Cost of data storage is coming down ↓. The amount of data average business collects and stores is doubling every year Total hardware and software cost to store and manage 1 Mbyte of data 1990: ~ $15 2002: ~ ¢15 (Down 100 times) By 2007: < ¢1 (Down 150 times)
  • 16.
    Why Data Warehouse? AFew Examples WalMart: 24TB FranceTelecom: ~ 100TB CERN: Up to 20 PB by 2006 Stanford LinearAccelerator Center (SLAC): 500TB Businesses demand Intelligence (BI). Complex questions from integrated data. “Intelligent Enterprise”
  • 17.
    List of allitems that were sold last month? List of all items purchased by X? The total sales of the last month grouped by branch? How many sales transactions occurred during the month of January? DBMS Approach
  • 18.
    Which items selltogether? Which items to stock? Where and how to place the items? What discounts to offer? How best to target customers to increase sales at a branch? Which customers are most likely to respond to my next promotional campaign, and why? Intelligent Enterprise
  • 19.
    What is aData Warehouse? A complete repository of historical corporate data extracted from transaction systems that is available for ad-hoc access by knowledge workers.
  • 20.
    What is DataMining? “There are things that we know that we know… there are things that we know that we don’t know… there are things that we don’t know we don’t know.” Donald Rumsfield Former US Secretary of Defence
  • 21.
    What is DataMining? Tell me something that I should know. When you don’t know what you should be knowing, how do you write SQL? You cant!!
  • 22.
    What is DataMining? Knowledge Discovery in Databases (KDD). Data mining digs out valuable non-trivial information from large multidimensional apparently unrelated data bases(sets). It’s the integration of business knowledge, people, information, algorithms, statistics and computing technology. Discovering useful hidden patterns and relationships in data.
  • 23.
    HUGE VOLUME THEREIS WAY TOO MUCH DATA & GROWING! Data collected much faster than it can be processed or managed. NASA Earth Observation System (EOS), will alone, collect 15 Peta bytes by 2007 (15,000,000,000,000,000 bytes). • Much of which won't be used - ever! • Much of which won't be seen - ever! • Why not? There's so much volume, usefulness of some of it will never be discovered SOLUTION: Reduce the volume and/or raise the information content by structuring, querying, filtering, summarizing, aggregating, mining...
  • 24.
    Requires solution offundamentally new problems 1. developing algorithms and systems to mine large, massive and high dimensional data sets; 2. developing algorithms and systems to mine new types of data (images, music, videos); 3. developing algorithms, protocols, and other infrastructure to mine distributed data; and 4. improving the ease of use of data mining systems; 5. developing appropriate privacy and security techniques for data mining.
  • 25.
    Future of DataMining 10 Hottest Jobs of year 2025 TIME Magazine,22 May,2000 10 emerging areas of technology MIT’s Magazine ofTechnology Review, Jan/Feb,2001
  • 26.
  • 27.
    Logical and PhysicalDatabaseLogical and Physical DatabaseLogical and Physical DatabaseLogical and Physical Database DesignDesignDesignDesign
  • 28.
    Data Mining isone step of Knowledge Discovery in Databases (KDD) Raw Data Preprocessing • Extraction • Transformation • Cleansing • Validation Data Mining • Identify Patterns • Create Models Interpretation/ Evaluation • Visualization • Feature Extraction • Analysis Clean Data $ $ $ Knowledge
  • 30.
    Information Evolution ina Data Warehouse Environment Primarily Batch Event Based Triggering Takes Hold Increase in Ad Hoc Queries Analytical Modeling Grows Continuous Update & Time Sensitive Queries Become Important Batch Ad Hoc Analytics Continuous Update/Short Queries Event-Based Triggering STAGE 2: ANALYZE WHY did it happen? STAGE 3: PREDICT What WILL happen? STAGE 1: REPORT WHAT happened? STAGE 4: OPERATIONALIZE What IS happening? STAGE 5: ACTIVATE What do you WANT to happen?
  • 31.
    Normalization and Denormalization Normalization Arelational database relates subsets of a dataset to each other. A dataset is a set of tables (or schema in Oracle) A table defines the structure and contains the row and column data for each subset. Tables are related to each other by linking them based on common items and values between two tables. Normalization is the optimization of record keeping for insertion, deletion and updation (in addition to selection, ofcourse) De-normalization Why denormalize? When to denormalize How to denormalize
  • 34.
    Why De-normalization? Do youhave performance problems? If not, then you shouldn’t be studying this course! The root cause of 99% of database performance problems is poorly written SQL code. Usually as a result of poorly optimized underlying structure Do you have disk storage problems? Consider separating large, less used datasets and frequently used datasets.
  • 35.
    When to Denormalize? Denormalizationsometimes implies the undoing of some of the steps of Normalization Denormalization is not necessarily the reverse of the steps of Normalization. Denormalization does not imply complete removal of specific Normal Form levels. Denormalization results in duplication. It is quite possible that table structure is much too granular or possibly even incompatible with structure imposed by applications. Denormalization usually involves merging of multiple transactional tables or multiple static tables into single
  • 36.
    When to Denormalize? Lookfor one-to-one relationships. These may be unnecessary if the required removal of null values causes costly joins. Disk space is cheap. Complex SQL join statements can destroy performance. Do you have many-to-many join resolution entities? Are they all necessary? Are they all used by applications? When constructing SQL statement joins are you finding many tables in joins where those tables are scattered throughout the entity relationship diagram? When searching for static data items such as customer details are you querying a single or multiple tables? A single table is much more efficient than multiple tables.
  • 37.
    How to Denormalize? CommonForms of Denormalization Pre-join de-normalization. Column replication or movement. Pre-aggregation.
  • 38.
    Considerations in Assessing De-normalization Performanceimplications Storage implications Ease-of-use implications Maintenance implications Most commonly missed/disregarded.
  • 39.
    Pre-join Denormalization Take tableswhich are frequently joined and “glue” them together into a single table. Avoids performance impact of the frequent joins. Typically increases storage requirements.
  • 40.
    Pre-join Denormalization A simplifiedretail example... Before denormalization: sale_id store_id sale_dt … tx_id sale_id item_id … item_qty sale$ 1 m
  • 41.
    Pre-join Denormalization tx_id sale_idstore_id sale_dt item_id … item_qty $ A simplified retail example... After denormalization: Points to Ponder Which Normal Form is being violated? Will there be maintenance issues?
  • 42.
    Pre-join Denormalization Storage implications... Assume1:3 record count ratio between sales header and detail. Assume 1 billion sales (3 billion sales detail). Assume 8 byte sales_id. Assume 30 byte header and 40 byte detail records. Which businesses will be most hurt, in terms of storage capacity, by this form of denormalization?
  • 43.
    Pre-join Denormalization Storage implications... Beforedenormalization: 150 GB raw data. After denormalization: 186 GB raw data. Net result is 24% increase in raw data size for the database. Pre-join may actually result in space saving, if many concurrent queries are demanding frequent joins on the joined tables! HOW?
  • 44.
    Pre-join Denormalization Sample Query: Whatwas my total $ volume betweenThanksgiving and Christmas in 1999?
  • 45.
    Pre-join Denormalization Before de-normalization: selectsum(sales_detail.sale_amt) from sales ,sales_detail where sales.sales_id = sales_detail.sales_id and sales.sales_dt between '1999-11-26' and '1999-12-25' ;
  • 46.
    Pre-join Denormalization After de-normalization: selectsum(d_sales_detail.sale_amt) from d_sales_detail where d_sales_detail.sales_dt between '1999- 11-26' and '1999-12-25' ; No join operation performed. How to compare performance?
  • 47.
    Pre-join Denormalization But considerthe question... How many sales (transactions) did I make betweenThanksgiving and Christmas in 1999?
  • 48.
    Pre-join Denormalization Before denormalization: selectcount(*) from sales where sales.sales_dt between '1999-11-26' and '1999-12-25'; After denormalization: select count(distinct d_sales_detail.sales_id) from d_sales_detail where d_sales_detail.sales_dt between '1999-11- 26' and '1999-12-25'; Which query will perform better?
  • 49.
    Pre-join Denormalization Performance implications... Performancepenalty for count distinct (forces sort) can be quite large. May be worth 30 GB overhead to keep sales header records if this is a common query structure because both ease-of-use and performance will be enhanced (at some cost in storage)?
  • 50.
    Considerations in Assessing De-normalization Performanceimplications Storage implications Ease-of-use implications Maintenance implications Most commonly missed/disregarded.
  • 51.
    Column Replication orMovement Take columns that are frequently accessed via large scale joins and replicate (or move) them into detail table(s) to avoid join operation. Avoids performance impact of the frequent joins. Increases storage requirements for database. Possible to “move” frequently accessed column to detail instead of replicating it. Note: This technique is no different than a limited form of the pre- join denormalization described previously.
  • 52.
    ColA ColB Table_1 ColA ColCColD … ColZ Table_2 ColA ColB Table_1’ ColA ColC ColD … ColZ Table_2 ColC
  • 53.
    Column Replication orMovement Health Care DW Example: Take member_id from claim header and move it to claim detail. Result: An extra ten bytes per row on claim line table allows avoiding join to claim header table on some (many?) queries. Which normal form does this technique violates?
  • 54.
    Column Replication orMovement Beware of the results of de-normalization: Assuming a 100 byte record before the denormalization, all scans through the claim line detail will now take 10% longer than previously. A significant percentage of queries must get benefit from access to the denormalized column in order to justify movement into the claim line table. Need to quantify both cost and benefit of each denormalization decision.
  • 55.
    Column Replication orMovement May want to replicate columns in order to facilitate co-location of commonly joined tables. Before denormalization: A three table join requires re-distribution of significant amounts of data to answer many important questions related to customer transaction behavior. Customer_Id Customer_Nm Address Ph … Account_Id Customer_Id Balance$ Open_Dt … Tx_Id Account_Id Tx$ Tx_Dt Location_Id … 1 m 1 m CustTable AcctTable TrxTable