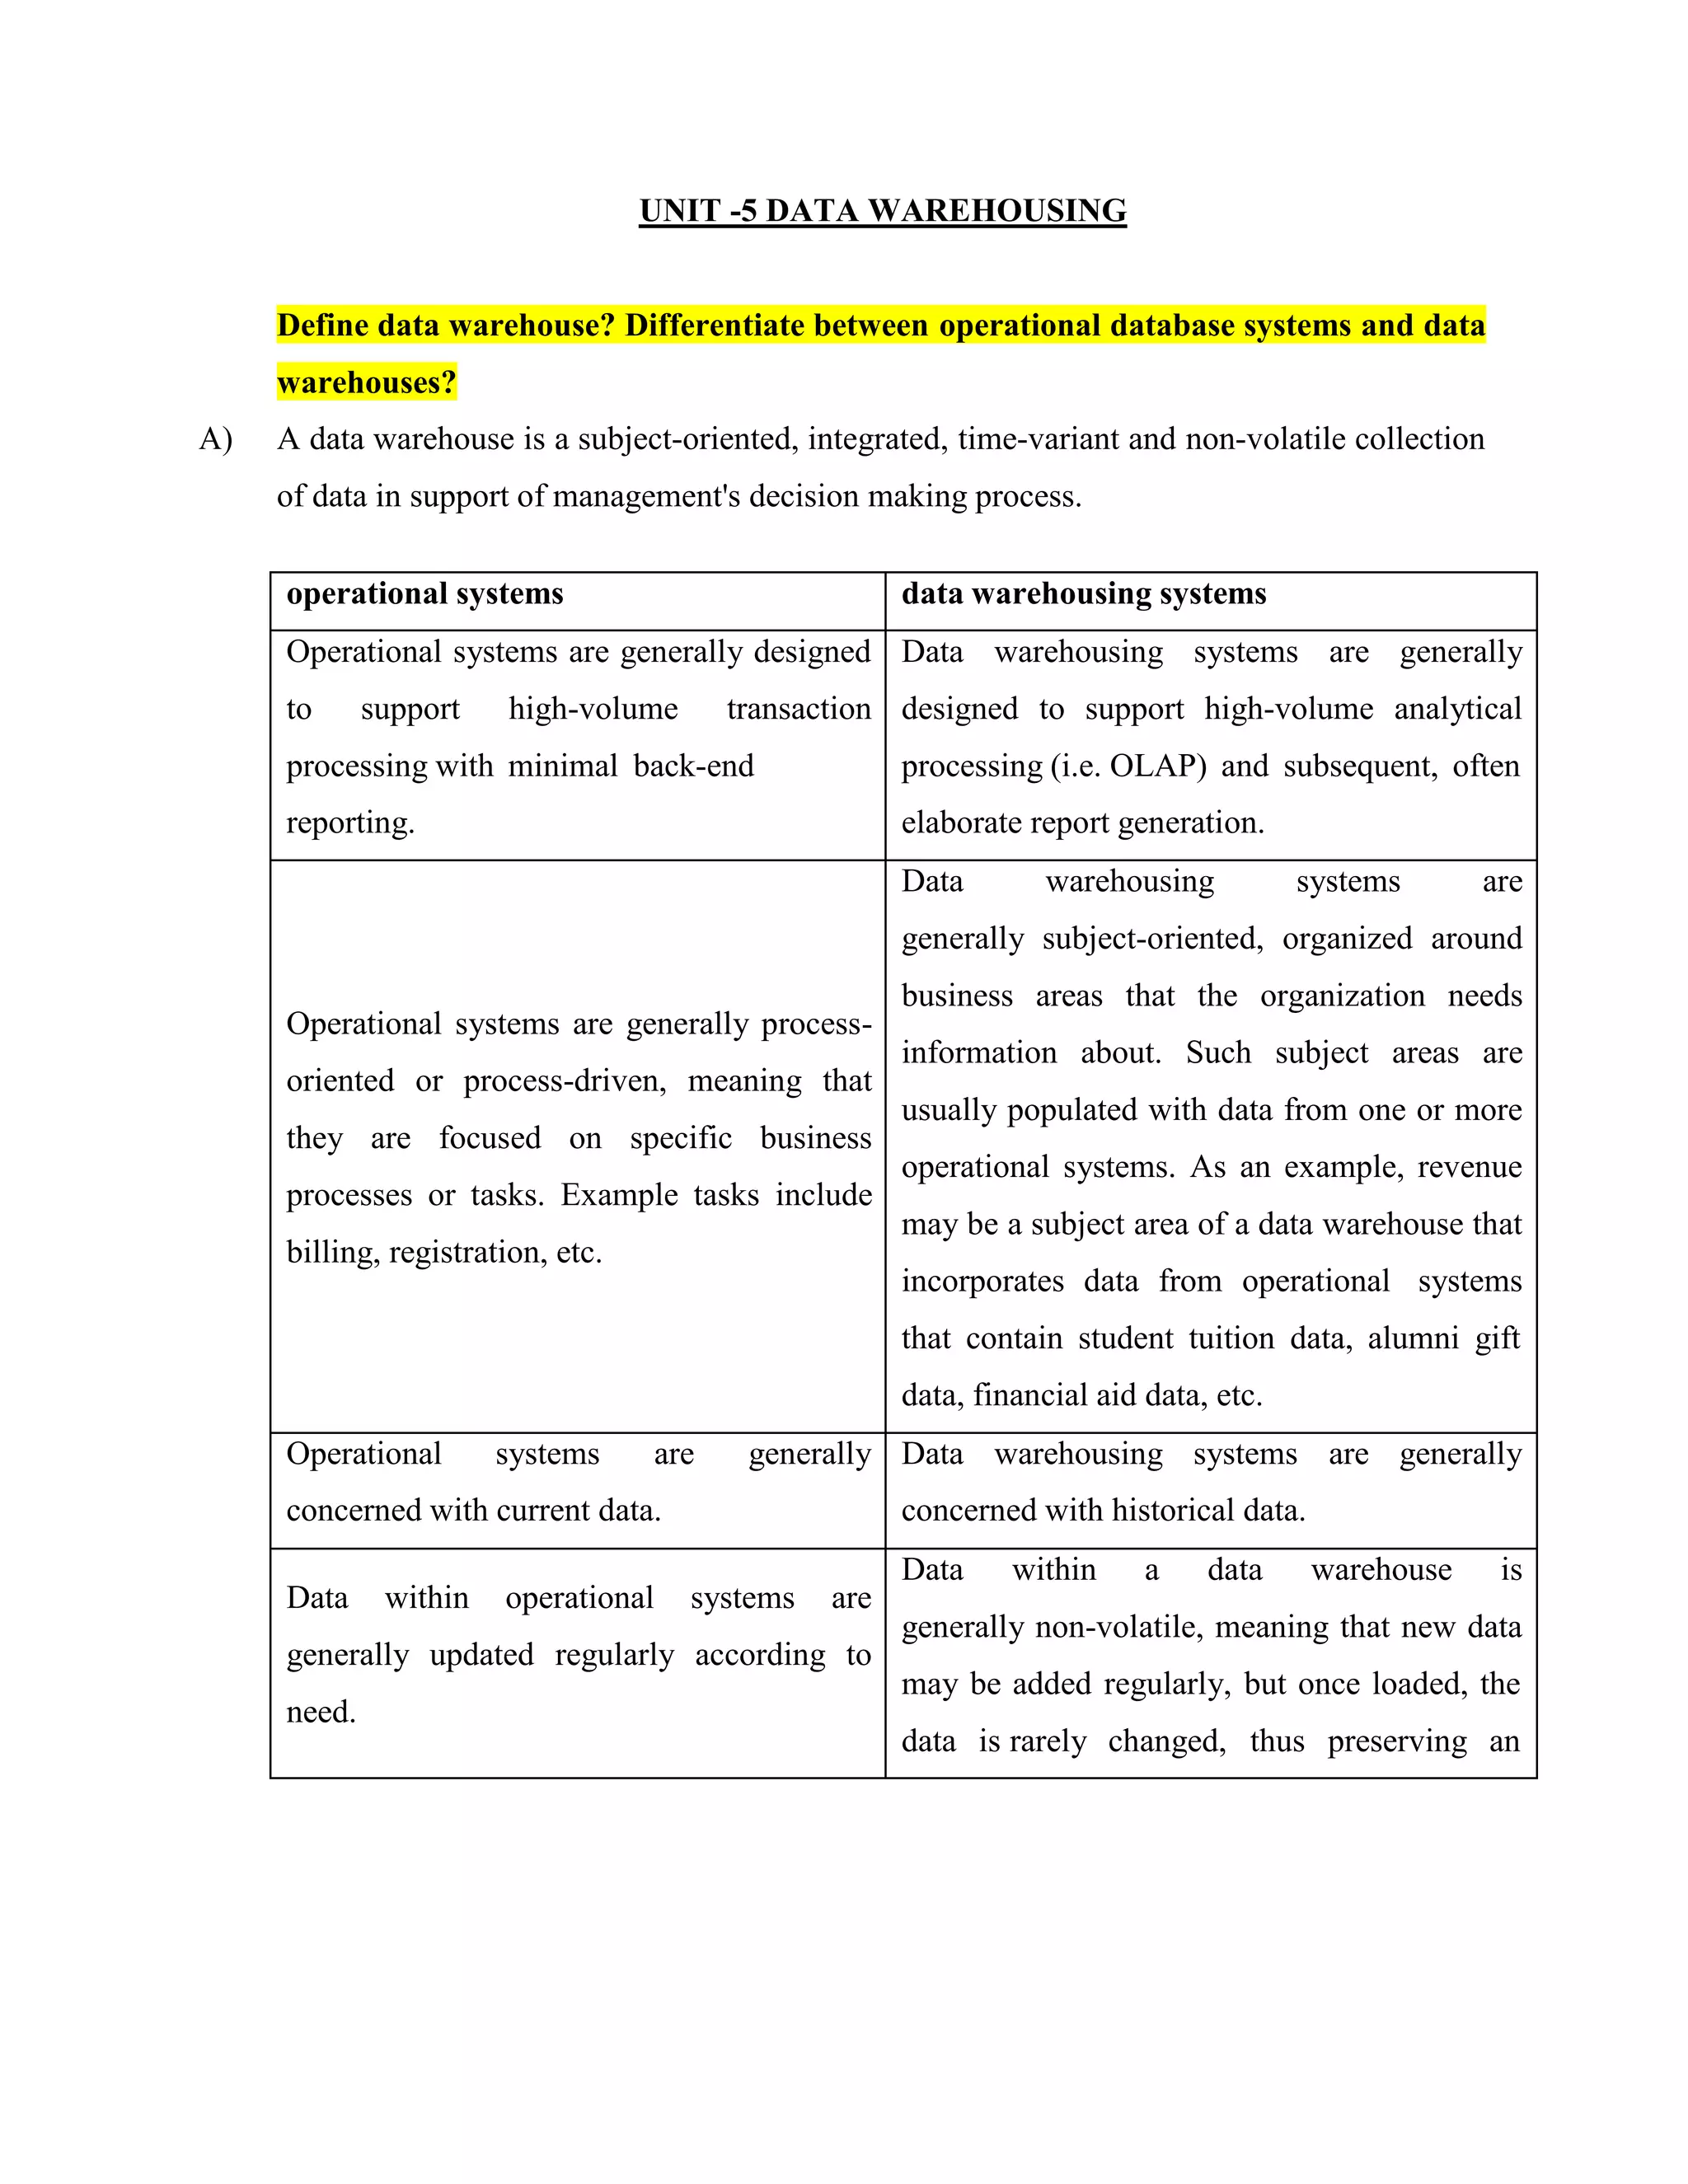
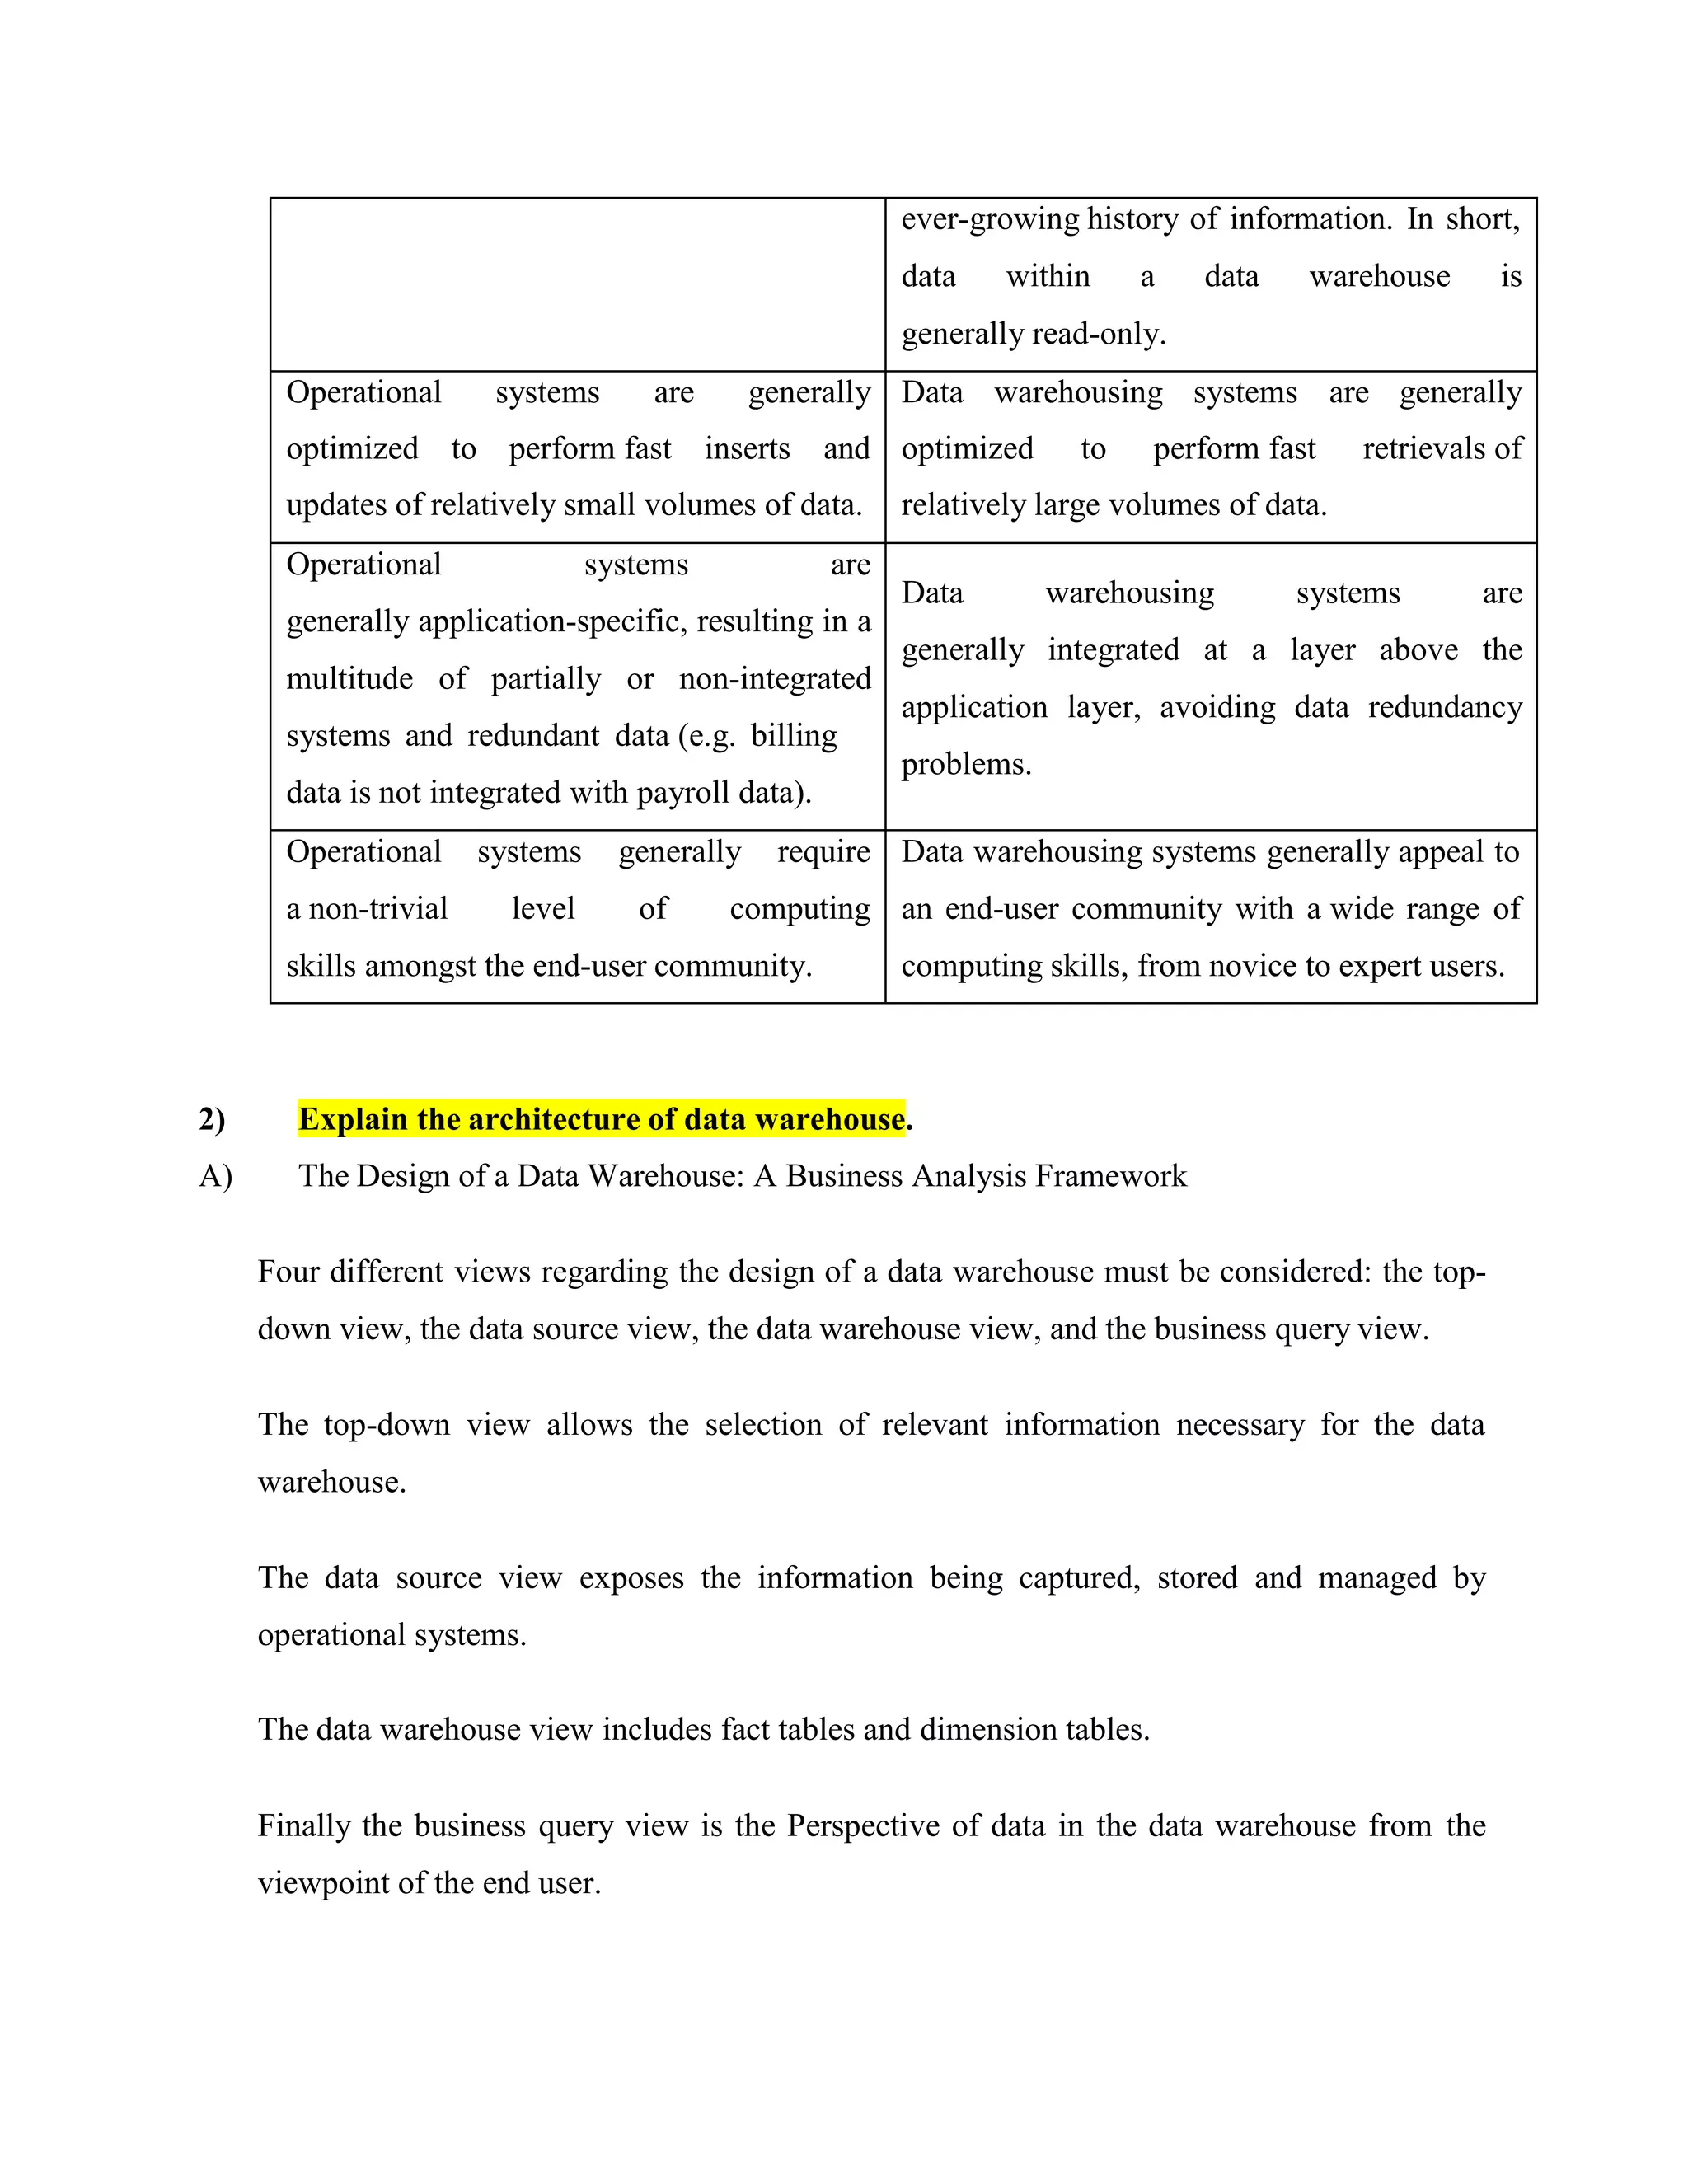
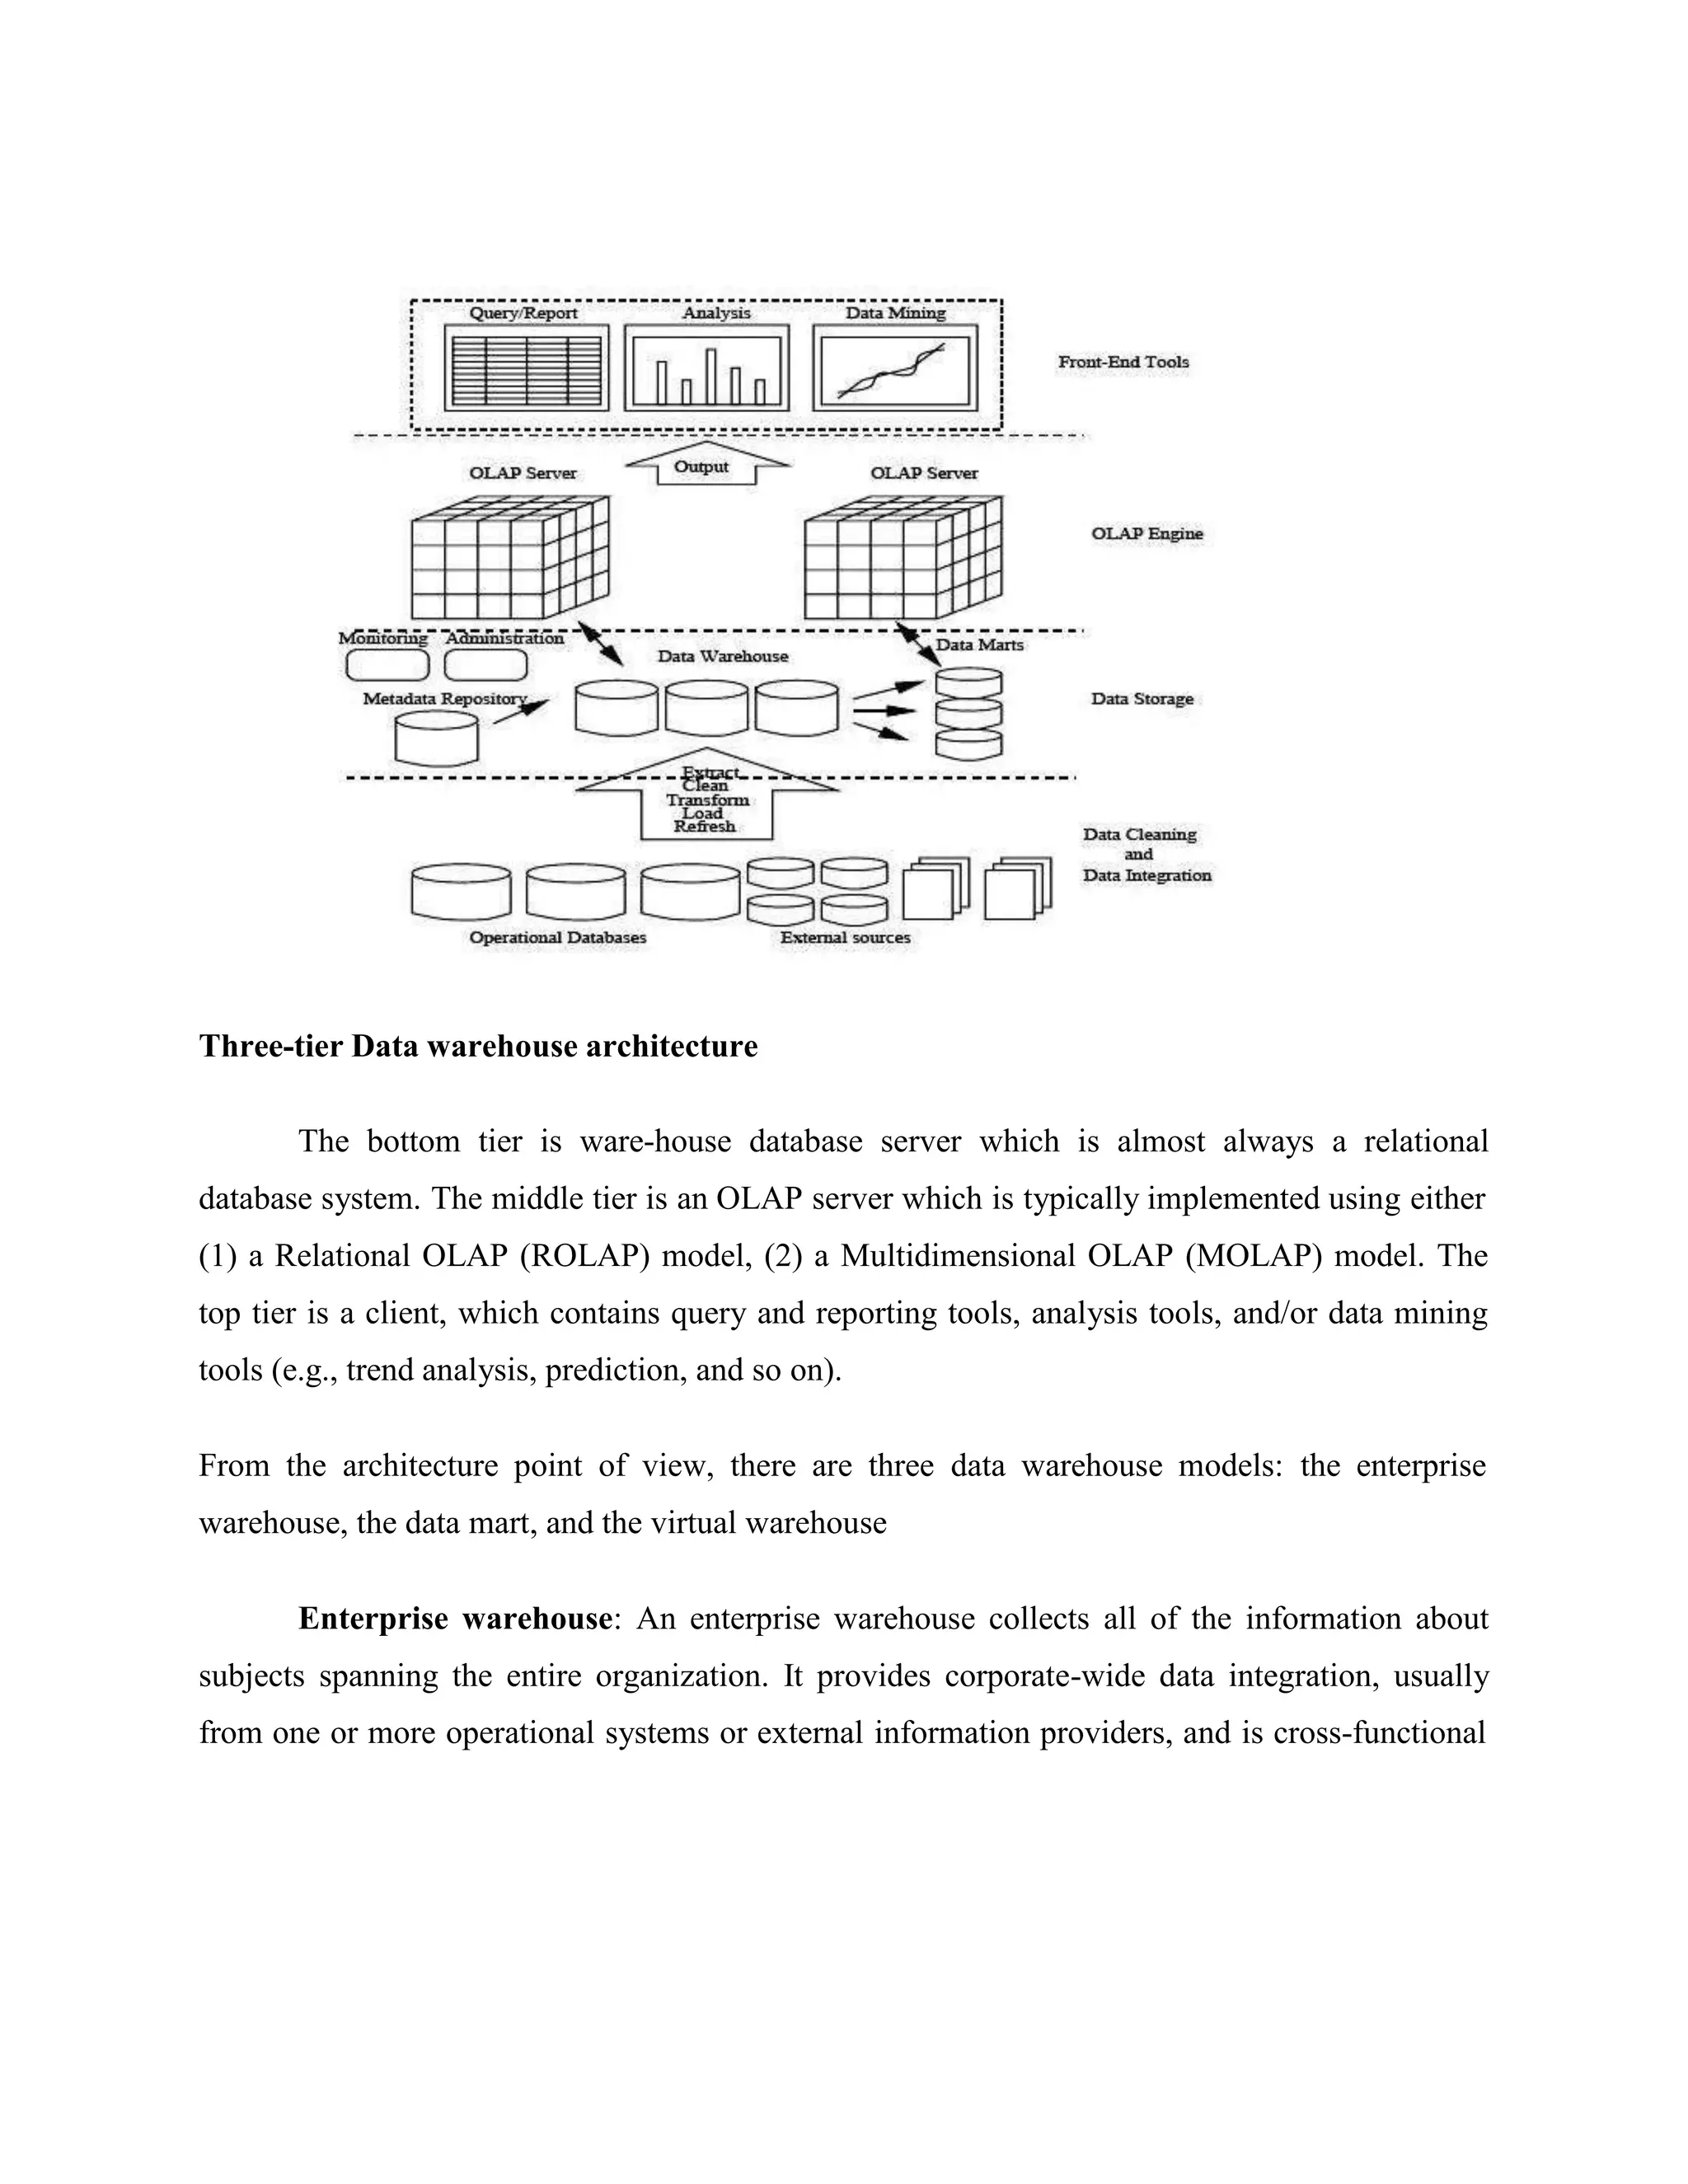
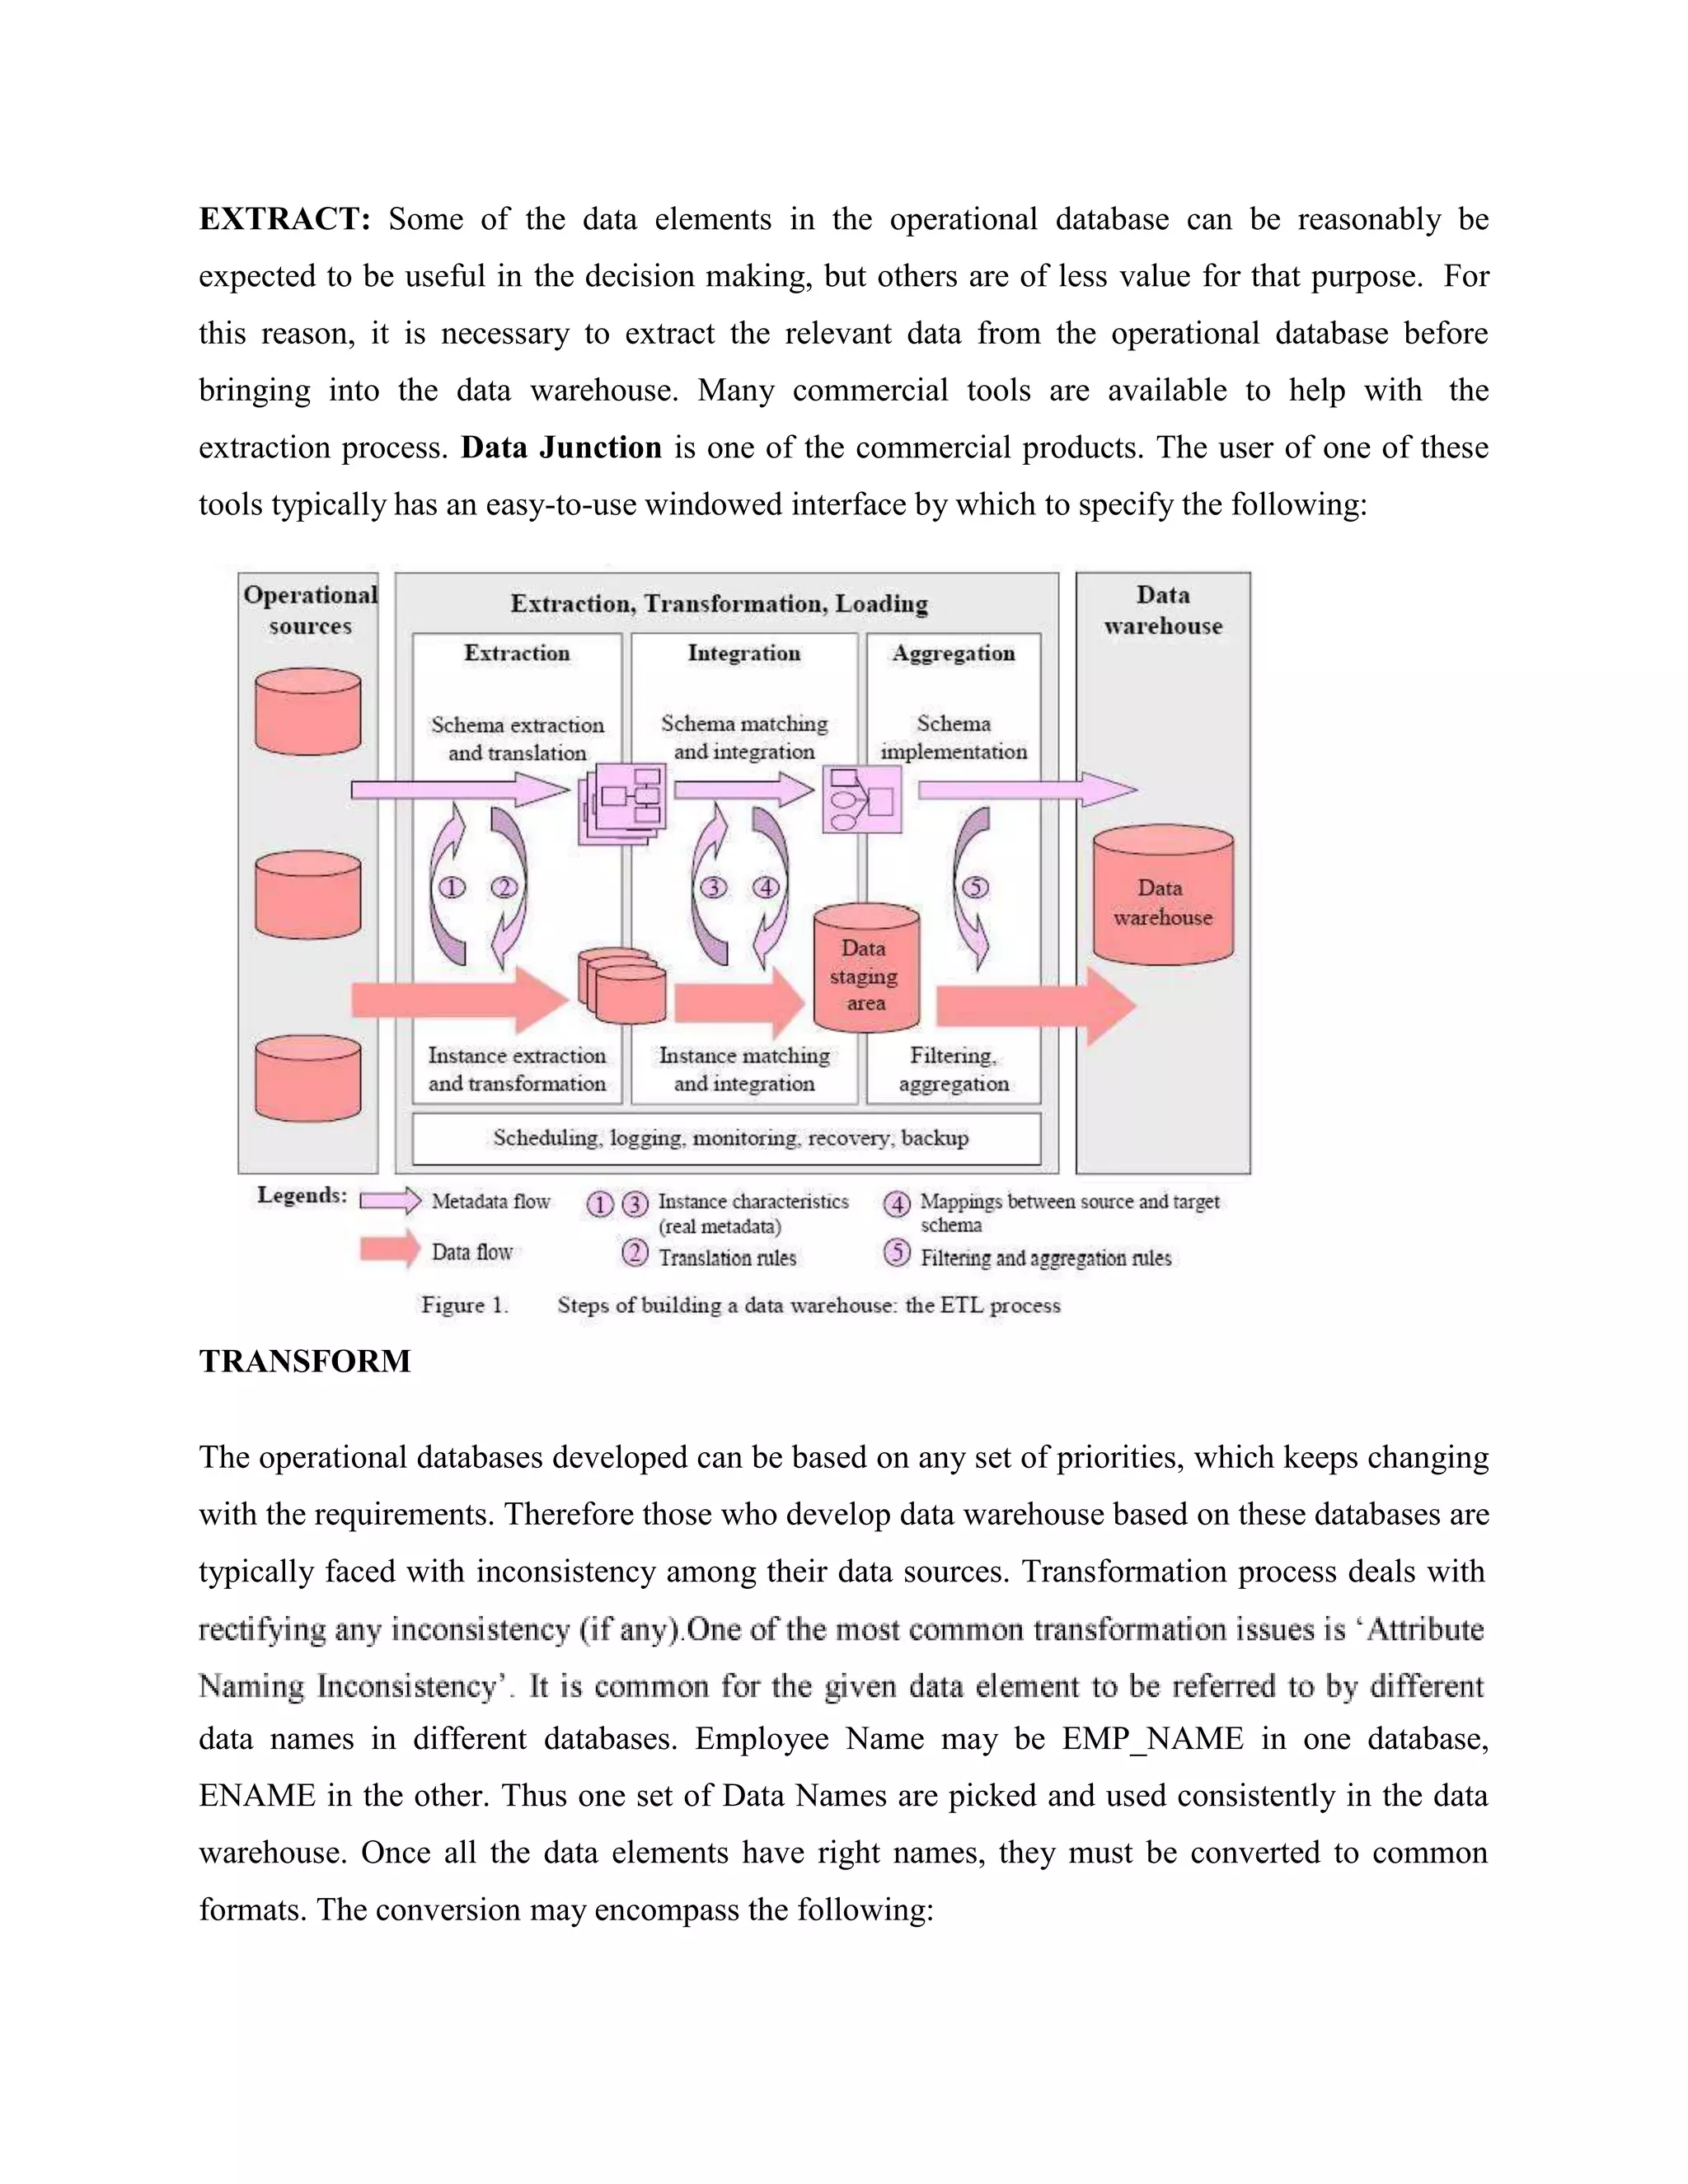
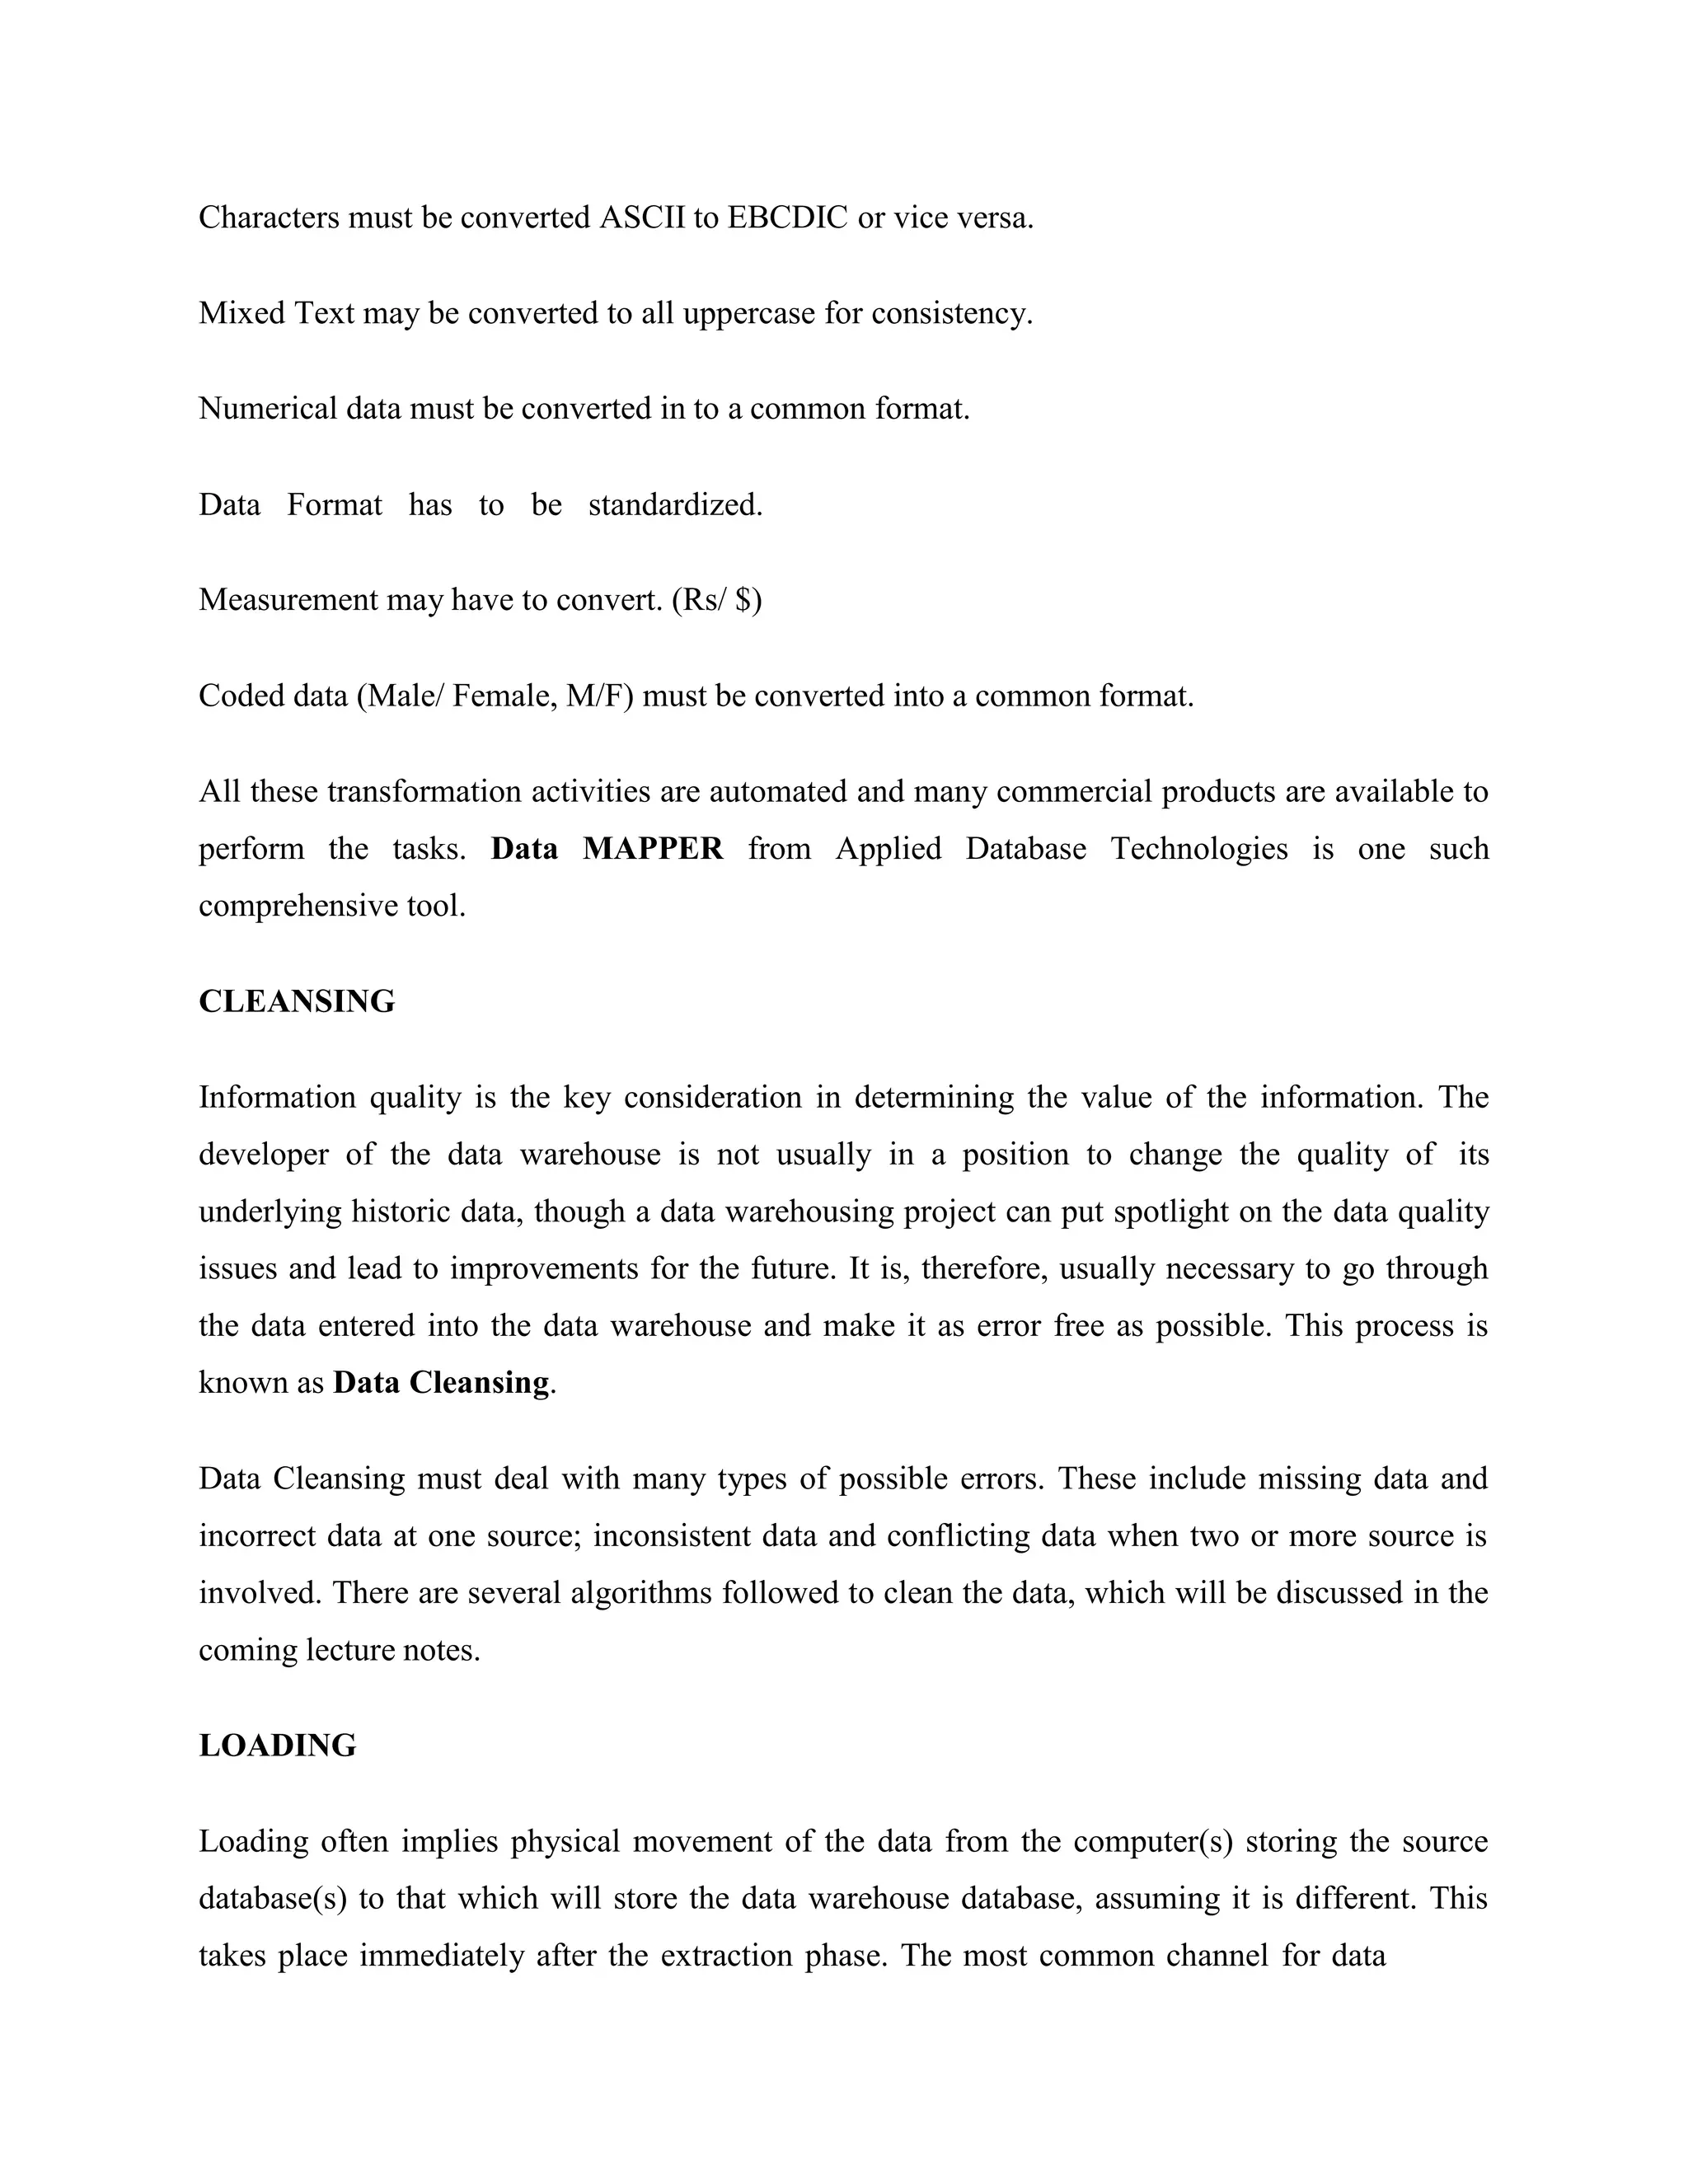
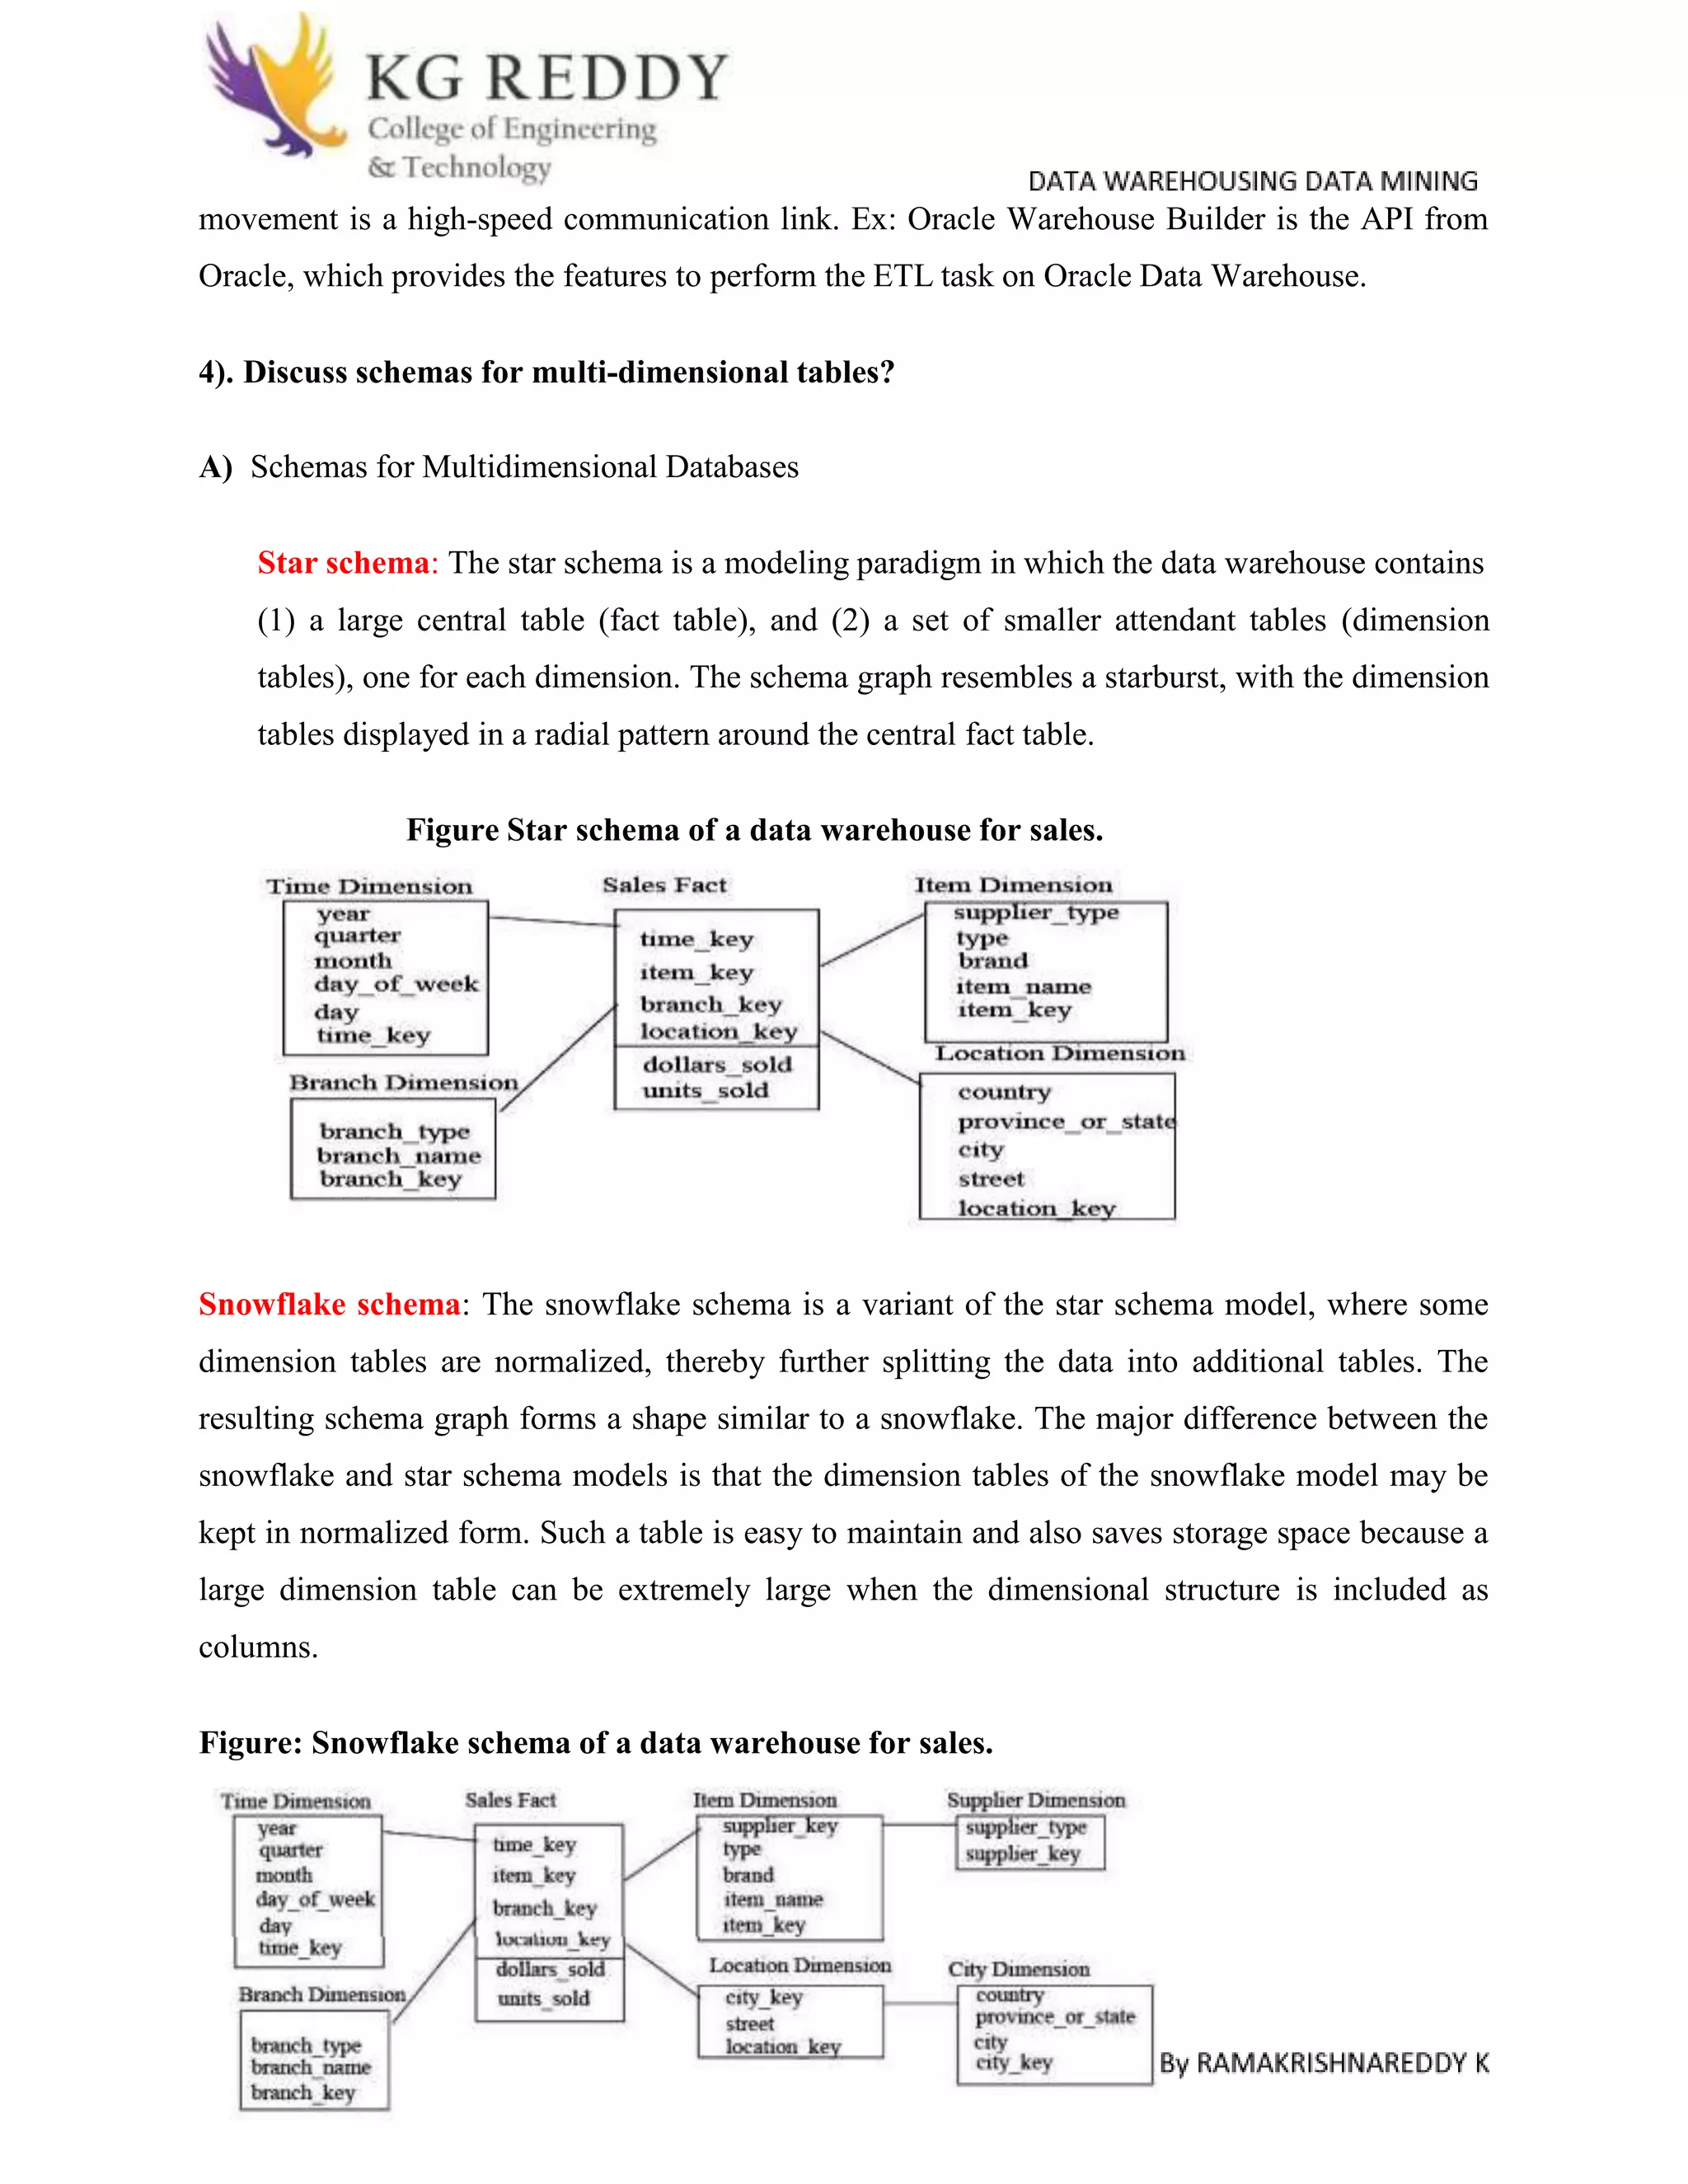
Operational database systems are designed to support transaction processing while data warehouses are designed to support analytical processing and report generation. Operational systems focus on business processes, contain current data, and are optimized for fast updates. Data warehouses are subject-oriented, contain historical data that is rarely changed, and are optimized for fast data retrieval. The three main components of a data warehouse architecture are the database server, OLAP server, and client tools. Data is extracted from operational systems, transformed, cleansed, and loaded into fact and dimension tables in the data warehouse using the ETL process. Multidimensional schemas like star, snowflake, and constellation organize this data. Common OLAP operations performed on the data include roll-up,
Presentation by Andreas Schleicher Tackling the School Absenteeism Crisis 30 ...
UNIT-5 DATA WAREHOUSING.docx
1. UNIT -5 DATA WAREHOUSING
Define data warehouse? Differentiate between operational database systems and data
warehouses?
A) A data warehouse is a subject-oriented, integrated, time-variant and non-volatile collection
of data in support of management's decision making process.
operational systems data warehousing systems
Operational systems are generally designed
to support high-volume transaction
processing with minimal back-end
reporting.
Data warehousing systems are generally
designed to support high-volume analytical
processing (i.e. OLAP) and subsequent, often
elaborate report generation.
Operational systems are generally process-
oriented or process-driven, meaning that
they are focused on specific business
processes or tasks. Example tasks include
billing, registration, etc.
Data warehousing systems are
generally subject-oriented, organized around
business areas that the organization needs
information about. Such subject areas are
usually populated with data from one or more
operational systems. As an example, revenue
may be a subject area of a data warehouse that
incorporates data from operational systems
that contain student tuition data, alumni gift
data, financial aid data, etc.
Operational systems are
concerned with current data.
generally Data warehousing systems
concerned with historical data.
are generally
Data within operational systems are
generally updated regularly according to
need.
Data within a data warehouse is
generally non-volatile, meaning that new data
may be added regularly, but once loaded, the
data is rarely changed, thus preserving an
2. ever-growing history of information. In short,
data within a data warehouse is
generally read-only.
Operational systems are generally
optimized to perform fast inserts and
updates of relatively small volumes of data.
Data warehousing systems are generally
optimized to perform fast retrievals of
relatively large volumes of data.
Operational systems are
generally application-specific, resulting in a
multitude of partially or non-integrated
systems and redundant data (e.g. billing
data is not integrated with payroll data).
Data warehousing systems are
generally integrated at a layer above the
application layer, avoiding data redundancy
problems.
Operational systems generally require
a non-trivial level of computing
skills amongst the end-user community.
Data warehousing systems generally appeal to
an end-user community with a wide range of
computing skills, from novice to expert users.
2) Explain the architecture of data warehouse.
A) The Design of a Data Warehouse: A Business Analysis Framework
Four different views regarding the design of a data warehouse must be considered: the top-
down view, the data source view, the data warehouse view, and the business query view.
The top-down view allows the selection of relevant information necessary for the data
warehouse.
The data source view exposes the information being captured, stored and managed by
operational systems.
The data warehouse view includes fact tables and dimension tables.
Finally the business query view is the Perspective of data in the data warehouse from the
viewpoint of the end user.
3. Three-tier Data warehouse architecture
The bottom tier is ware-house database server which is almost always a relational
database system. The middle tier is an OLAP server which is typically implemented using either
(1) a Relational OLAP (ROLAP) model, (2) a Multidimensional OLAP (MOLAP) model. The
top tier is a client, which contains query and reporting tools, analysis tools, and/or data mining
tools (e.g., trend analysis, prediction, and so on).
From the architecture point of view, there are three data warehouse models: the enterprise
warehouse, the data mart, and the virtual warehouse
Enterprise warehouse: An enterprise warehouse collects all of the information about
subjects spanning the entire organization. It provides corporate-wide data integration, usually
from one or more operational systems or external information providers, and is cross-functional
4. in scope. It typically contains detailed data as well as summarized data, and can range in size
from a few gigabytes to hundreds of gigabytes, terabytes, or beyond.
Data mart: A data mart contains a subset of corporate-wide data that is of value to a specific
group of users. The scope is connected to specific, selected subjects. For example, a marketing
data mart may connect its subjects to customer, item, and sales. The data contained in data marts
tend to be summarized. Depending on the source of data, data marts can be categorized into the
following two classes:
(i).Independent data marts are sourced from data captured from one or more operational systems
or external information providers, or from data generated locally within a particular department
or geographic area.
(ii).Dependent data marts are sourced directly from enterprise data warehouses
Virtual warehouse: A virtual warehouse is a set of views over operational databases. For
efficient query processing, only some of the possible summary views may be materialized. A
virtual warehouse is easy to build but requires excess capacity on operational database servers.
3). Discuss Extraction-Transformation-loading with neat diagram?
A) The ETL (Extract Transformation Load) process
There are 4 major process of the data warehouse. They are extract (data from the
operational systems and bring it to the data warehouse), transform (the data into internal format
and structure of the data warehouse), cleanse (to make sure it is of sufficient quality to be used
for decision making) and load (cleanse data is put into the data warehouse).
The four processes from extraction through loading often referred collectively as Data Staging.
5. EXTRACT: Some of the data elements in the operational database can be reasonably be
expected to be useful in the decision making, but others are of less value for that purpose. For
this reason, it is necessary to extract the relevant data from the operational database before
bringing into the data warehouse. Many commercial tools are available to help with the
extraction process. Data Junction is one of the commercial products. The user of one of these
tools typically has an easy-to-use windowed interface by which to specify the following:
TRANSFORM
The operational databases developed can be based on any set of priorities, which keeps changing
with the requirements. Therefore those who develop data warehouse based on these databases are
typically faced with inconsistency among their data sources. Transformation process deals with
data names in different databases. Employee Name may be EMP_NAME in one database,
ENAME in the other. Thus one set of Data Names are picked and used consistently in the data
warehouse. Once all the data elements have right names, they must be converted to common
formats. The conversion may encompass the following:
6. Characters must be converted ASCII to EBCDIC or vice versa.
Mixed Text may be converted to all uppercase for consistency.
Numerical data must be converted in to a common format.
Data Format has to be standardized.
Measurement may have to convert. (Rs/ $)
Coded data (Male/ Female, M/F) must be converted into a common format.
All these transformation activities are automated and many commercial products are available to
perform the tasks. Data MAPPER from Applied Database Technologies is one such
comprehensive tool.
CLEANSING
Information quality is the key consideration in determining the value of the information. The
developer of the data warehouse is not usually in a position to change the quality of its
underlying historic data, though a data warehousing project can put spotlight on the data quality
issues and lead to improvements for the future. It is, therefore, usually necessary to go through
the data entered into the data warehouse and make it as error free as possible. This process is
known as Data Cleansing.
Data Cleansing must deal with many types of possible errors. These include missing data and
incorrect data at one source; inconsistent data and conflicting data when two or more source is
involved. There are several algorithms followed to clean the data, which will be discussed in the
coming lecture notes.
LOADING
Loading often implies physical movement of the data from the computer(s) storing the source
database(s) to that which will store the data warehouse database, assuming it is different. This
takes place immediately after the extraction phase. The most common channel for data
7. movement is a high-speed communication link. Ex: Oracle Warehouse Builder is the API from
Oracle, which provides the features to perform the ETL task on Oracle Data Warehouse.
4). Discuss schemas for multi-dimensional tables?
A) Schemas for Multidimensional Databases
Star schema: The star schema is a modeling paradigm in which the data warehouse contains
(1) a large central table (fact table), and (2) a set of smaller attendant tables (dimension
tables), one for each dimension. The schema graph resembles a starburst, with the dimension
tables displayed in a radial pattern around the central fact table.
Figure Star schema of a data warehouse for sales.
Snowflake schema: The snowflake schema is a variant of the star schema model, where some
dimension tables are normalized, thereby further splitting the data into additional tables. The
resulting schema graph forms a shape similar to a snowflake. The major difference between the
snowflake and star schema models is that the dimension tables of the snowflake model may be
kept in normalized form. Such a table is easy to maintain and also saves storage space because a
large dimension table can be extremely large when the dimensional structure is included as
columns.
Figure: Snowflake schema of a data warehouse for sales.
8. Fact constellation: Sophisticated applications may require multiple facttables to share
dimension tables. This kind of schema can be viewed as a collection of stars, and hence is called
a galaxy schema or a fact constellation.
Figure Fact constellation schema of a data warehouse for sales and shipping
5) Discuss OLAP operations?
A) OLAP operations on multidimensional data.
Roll-up: The roll-up operation performs aggregation on a data cube, either byclimbing-up a
concept hierarchy for a dimension or by dimension reduction. Figure shows the result of a roll-up
operation performed on the central cube by climbing up the concept hierarchy for location. This
hierarchy was defined as the total order street < city < province or state <country.
Drill-down: Drill-down is the reverse of roll-up. It navigates from less detaileddata to more
detailed data. Drill-down can be realized by either stepping-down a concept hierarchy for a
dimension or introducing additional dimensions. Figure shows the result of a drill-down
operation performed on the central cube by stepping down a concept hierarchy for time defined
as day < month < quarter < year. Drill-down occurs by descending the time hierarchy from the
level of quarter to the more detailed level of month.
9. Slice and dice: The slice operation performs a selection on one dimension of
thegiven cube, resulting in a sub cube. Figure shows a slice operation where
the sales data are selected from the central cube for the dimension time using
the criteria
dimensions.
1. Pivot (rotate): Pivot is a visualization operation which rotates the data axes
in view in orderto provide an alternative presentation of the data. Figure shows a
pivot operation where the item and location axes in a 2-D slice are rotated.
Figure: Examples of typical OLAP operations on multidimensional data.