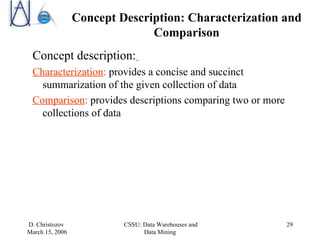
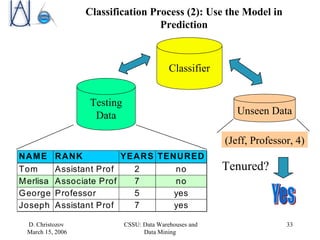
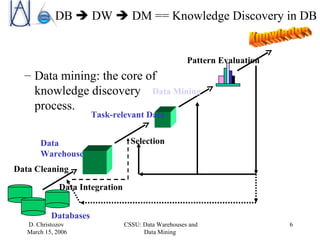
The document discusses data warehousing, data mining, and business intelligence applications. It explains that data warehousing organizes and structures data for analysis, and that data mining involves preprocessing, characterization, comparison, classification, and forecasting of data to discover knowledge. The final stage is presenting discovered knowledge to end users through visualization and business intelligence applications.
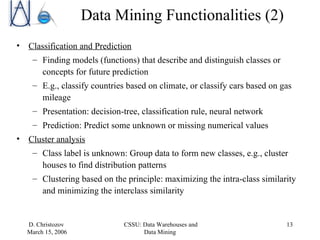
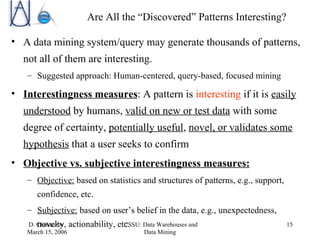
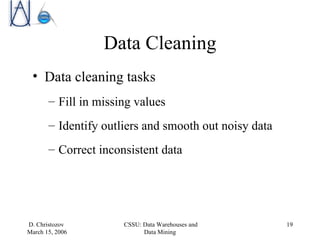
![Concept description: Characterization and discrimination Generalize, summarize, and contrast data characteristics, e.g., dry vs. wet regions Association ( correlation and causality) Multi-dimensional vs. single-dimensional association age(X, “20..29”) ^ income(X, “20..29K”) buys(X, “PC”) [support = 2%, confidence = 60%] contains(T, “computer”) contains(x, “software”) [1%, 75%] Data Mining Functionalities (1)](https://image.slidesharecdn.com/cssudwdm-110203063730-phpapp02/85/Cssu-dw-dm-12-320.jpg)
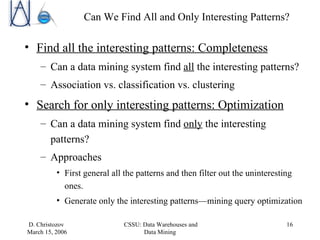
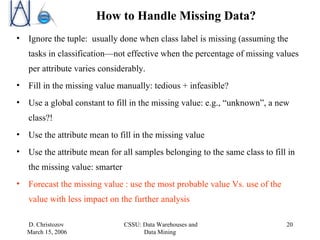
![What Is Association Mining? Association rule mining: Finding frequent patterns, associations, correlations, or causal structures among sets of items or objects in transaction databases, relational databases, and other information repositories. Applications: Basket data analysis, cross-marketing, catalog design, loss-leader analysis, clustering, classification, etc. Examples. Rule form: “ Body ead [support, confidence]”. buys(x, “diapers”) buys(x, “beers”) [0.5%, 60%] major(x, “CS”) ^ takes(x, “DB”) grade(x, “A”) [1%, 75%]](https://image.slidesharecdn.com/cssudwdm-110203063730-phpapp02/85/Cssu-dw-dm-26-320.jpg)
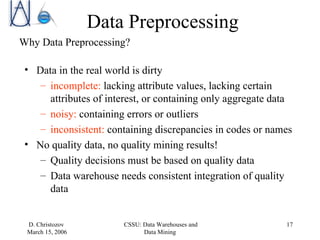
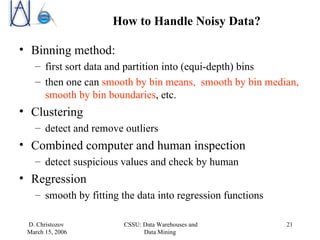
![Association Rule Mining Boolean vs. quantitative associations buys(x, “SQLServer”) ^ buys(x, “DMBook”) buys(x, “DBMiner”) [0.2%, 60%] age(x, “30..39”) ^ income(x, “42..48K”) buys(x, “PC”) [1%, 75%] Single dimension vs. multiple dimensional associations Single level vs. multiple-level analysis What brands of beers are associated with what brands of diapers? Various extensions Correlation, causality analysis Association does not necessarily imply correlation or causality Constraints enforced E.g., small sales (sum < 100) trigger big buys (sum > 1,000)?](https://image.slidesharecdn.com/cssudwdm-110203063730-phpapp02/85/Cssu-dw-dm-28-320.jpg)