This document discusses strategies for trading stocks and options, including:
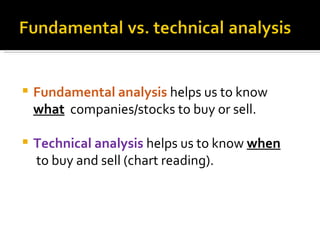
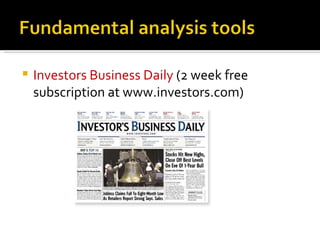
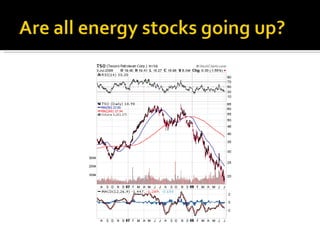
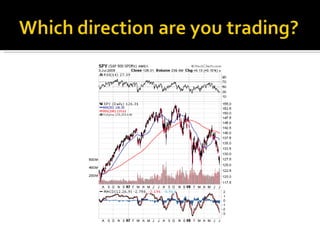
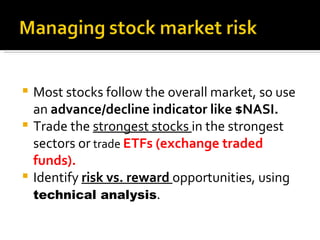
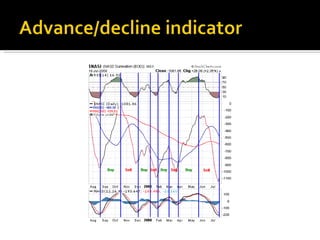
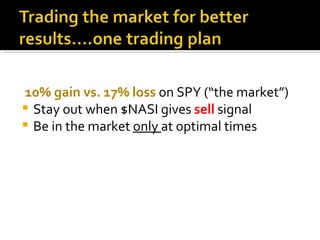
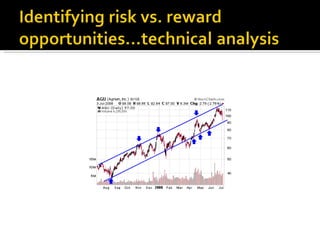
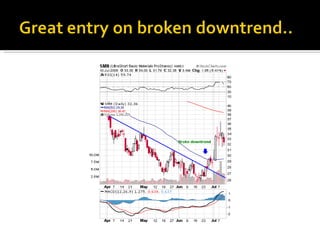
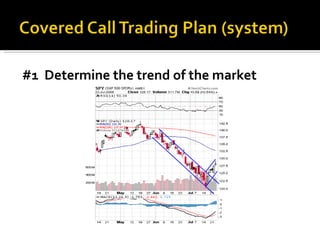
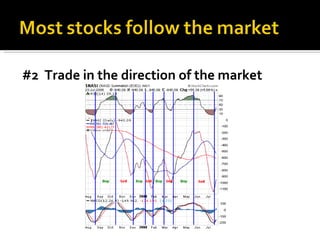
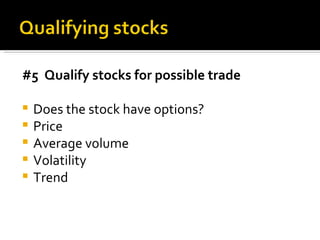
- Fundamental and technical analysis help determine what stocks to buy/sell and when.
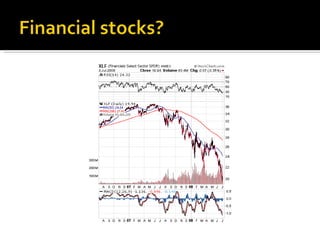
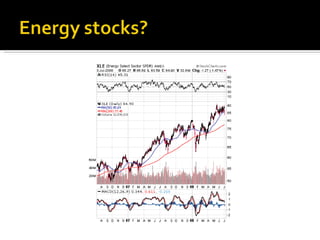
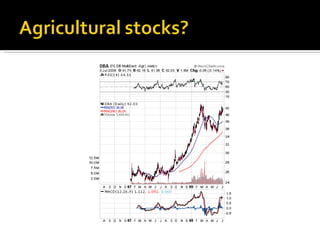
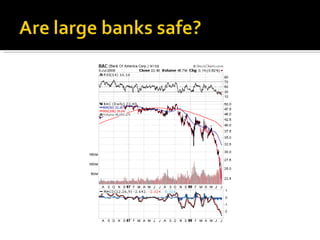
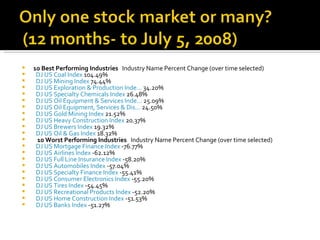
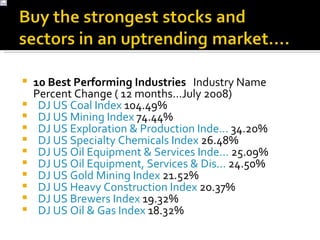
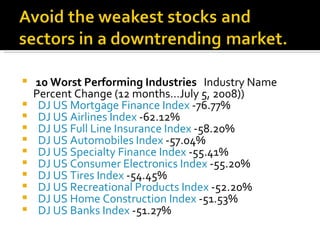
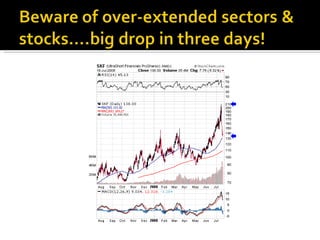
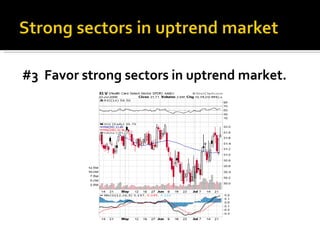
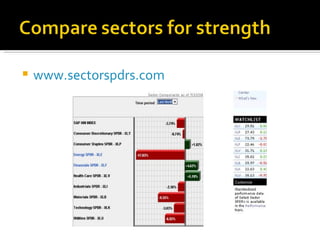
- Certain industries like coal and mining saw strong gains, while mortgage finance and airlines saw sharp declines.
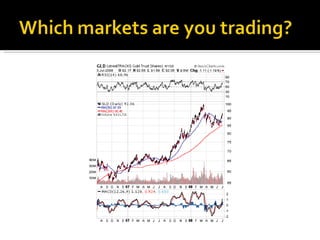
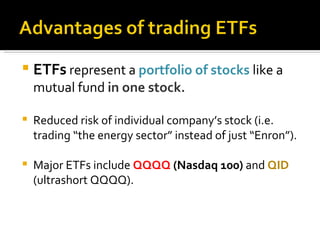
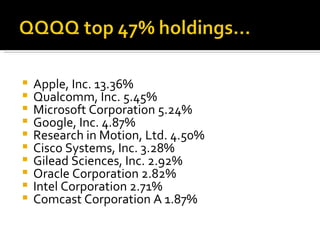
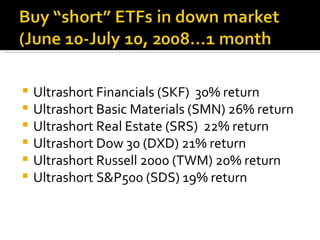
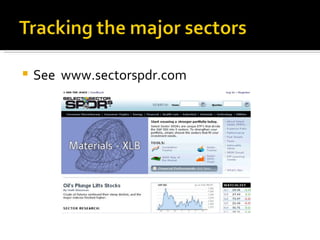
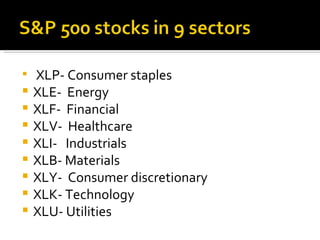
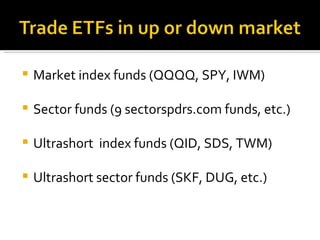
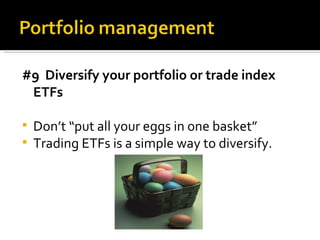
- ETFs can reduce risk compared to individual stocks by tracking sectors.
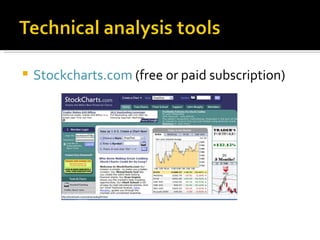
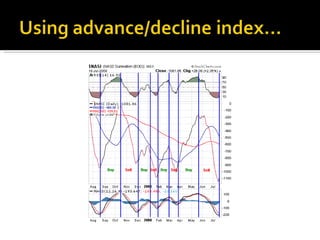
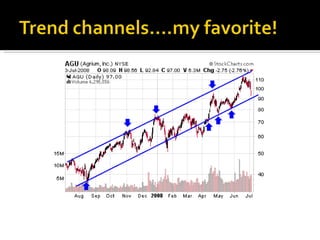
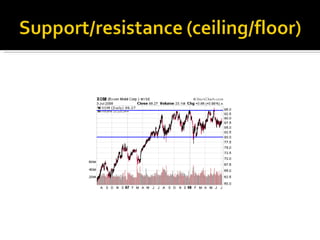
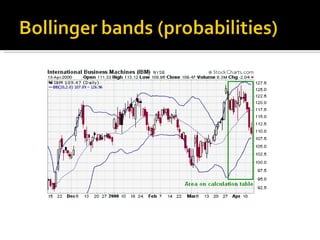
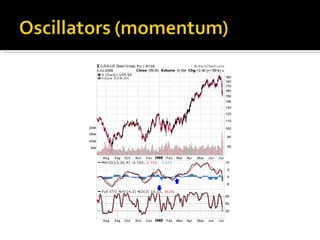
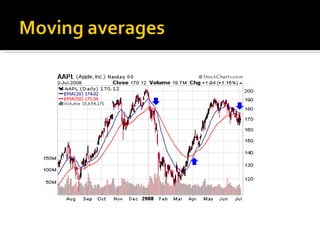
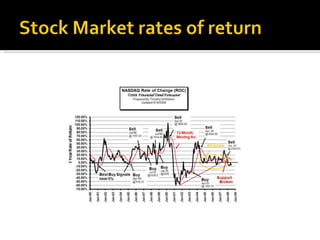
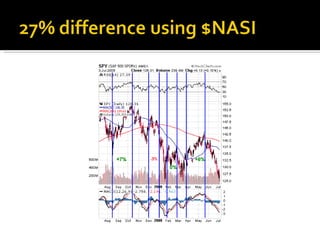
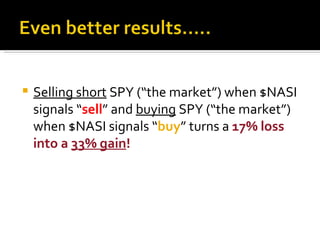
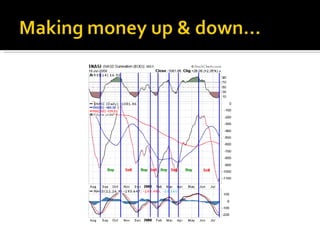
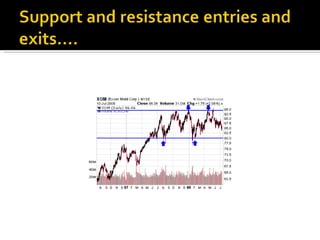
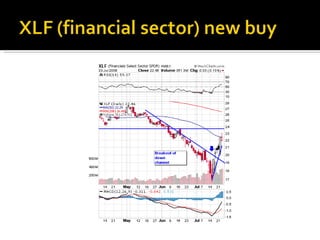
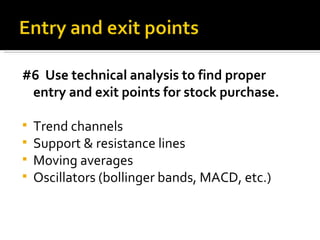
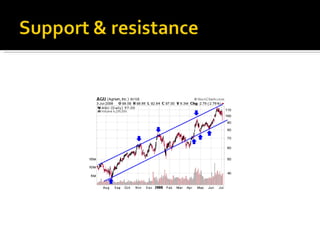
- Tools like moving averages and oscillators help identify trading opportunities.
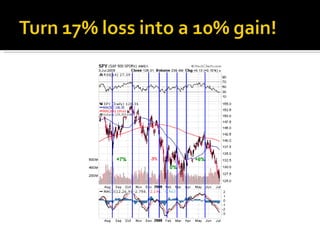
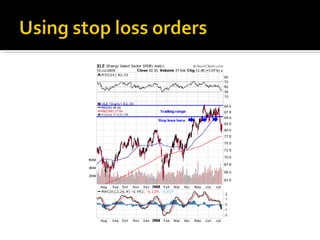
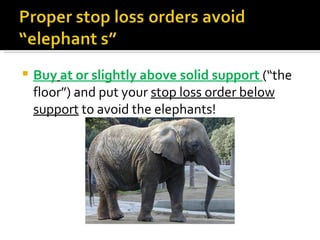
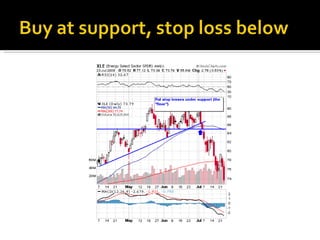
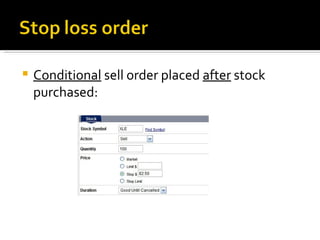
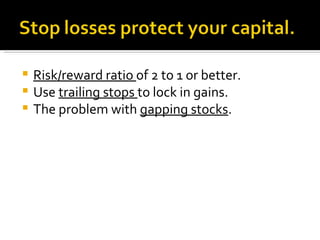
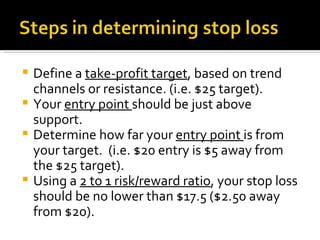
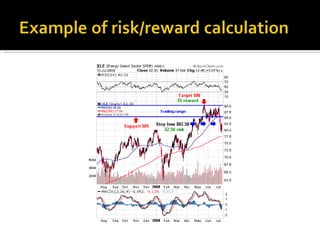
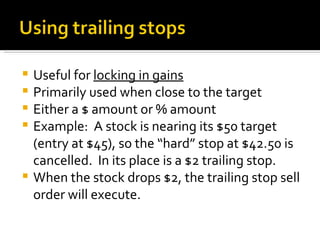
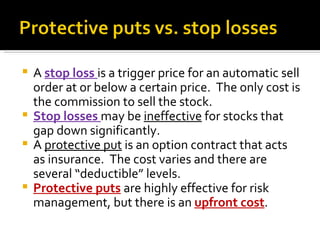
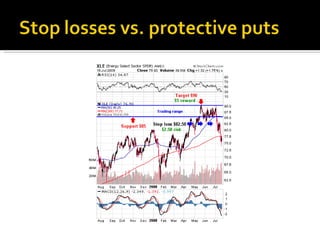
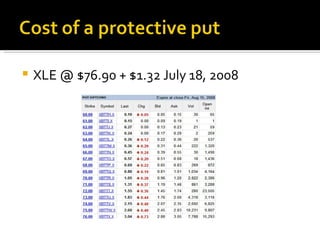
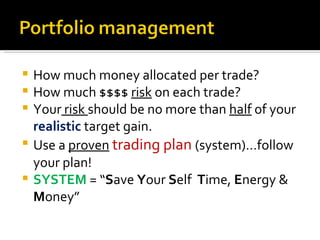
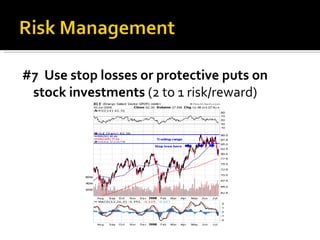
- Proper risk management includes stop losses, profit targets, and defined risk/reward ratios.


![Tim Oliver Professional Stock Market Coach Trading stocks & options for 15 years [email_address]](https://image.slidesharecdn.com/tims-pp-presentation-1227494030366802-9/85/Covered-call-presentation-2-320.jpg)