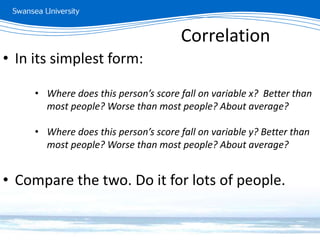
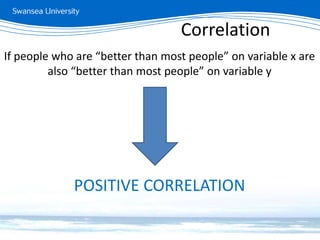
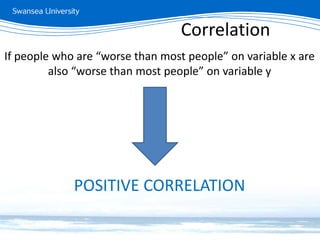
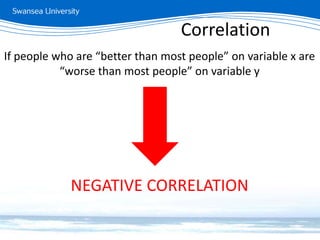
Correlation recap
Dr David Playfoot
d.r.playfoot@swansea.ac.uk
Research questions
• Most psychological research boils down to
two simple questions
1. If I change x does something happen to
y?
2. Are x and y related?
Research questions
Correlation
• “Are x and y related?”
1. Do people who spend more time in the
library get better marks?
2. Are intelligence and attractiveness
related?
Correlation
Things to remember
• We do not manipulate anything in a
correlational design.
• There is no IV and no DV
• Correlation is usually used when the variables
are continuous, or making distinct groups is
inappropriate.
Correlation
Measuring relationships
• In its simplest form:
• Where does this person’s score fall on variable x? Better than
most people? Worse than most people? About average?
• Where does this person’s score fall on variable y? Better than
most people? Worse than most people? About average?
• Compare the two. Do it for lots of people.
Correlation
Measuring relationships
If people who are “better than most people” on variable x are
also “better than most people” on variable y
POSITIVE CORRELATION
Correlation
Measuring relationships
If people who are “worse than most people” on variable x are
also “worse than most people” on variable y
POSITIVE CORRELATION
Correlation
Measuring relationships
If people who are “better than most people” on variable x are
“worse than most people” on variable y
NEGATIVE CORRELATION
Correlation
Measuring relationships
If people who are “worse than most people” on variable x are
“better than most people” on variable y
NEGATIVE CORRELATION
Correlation
Measuring relationships
• There are two correlation tests we’ll use
• Pearson’s Product Moment
• Spearman’s Rank
Correlation
Measuring relationships
• Does the correlation based on z scores per
variable
• i.e. is the score of the participant
above or below the mean for all
participants?
• Says “mean” so must be parametric
Pearson’s
Measuring relationships
• Does the correlation based on ranks
• i.e. is the best person at one thing also
the best at another?
• Non-parametric test
Spearman’s
THE DIRECTION OF THE CORRELATION IS DETERMINED
BY WHETHER PEOPLE ARE DOING THE SAME THING ON
BOTH VARIABLES, NOT BY WHETHER THEIR SCORES
ARE BETTER/WORSE THAN AVERAGE
Remember
Measuring relationships
• We can calculate the degree of correlation
between any two variables as long as they can
be paired.
• Correlation is a only descriptive measure
• Unless we also calculate whether the
relationship is strong enough to be significant
Correlation
Measuring relationships
• The strength of a correlation is expressed on a
scale from + 1 through 0 and on to -1.
• This figure is called the correlation coefficient
• The closer to 1, the stronger the relationship
• Ignore the sign when you are assessing the
strength and the significance.
Correlation

Correlation recap

  • 1.
    Correlation recap Dr DavidPlayfoot d.r.playfoot@swansea.ac.uk
  • 2.
    Research questions • Mostpsychological research boils down to two simple questions 1. If I change x does something happen to y? 2. Are x and y related? Research questions
  • 3.
    Correlation • “Are xand y related?” 1. Do people who spend more time in the library get better marks? 2. Are intelligence and attractiveness related? Correlation
  • 4.
    Things to remember •We do not manipulate anything in a correlational design. • There is no IV and no DV • Correlation is usually used when the variables are continuous, or making distinct groups is inappropriate. Correlation
  • 5.
    Measuring relationships • Inits simplest form: • Where does this person’s score fall on variable x? Better than most people? Worse than most people? About average? • Where does this person’s score fall on variable y? Better than most people? Worse than most people? About average? • Compare the two. Do it for lots of people. Correlation
  • 6.
    Measuring relationships If peoplewho are “better than most people” on variable x are also “better than most people” on variable y POSITIVE CORRELATION Correlation
  • 7.
    Measuring relationships If peoplewho are “worse than most people” on variable x are also “worse than most people” on variable y POSITIVE CORRELATION Correlation
  • 8.
    Measuring relationships If peoplewho are “better than most people” on variable x are “worse than most people” on variable y NEGATIVE CORRELATION Correlation
  • 9.
    Measuring relationships If peoplewho are “worse than most people” on variable x are “better than most people” on variable y NEGATIVE CORRELATION Correlation
  • 10.
    Measuring relationships • Thereare two correlation tests we’ll use • Pearson’s Product Moment • Spearman’s Rank Correlation
  • 11.
    Measuring relationships • Doesthe correlation based on z scores per variable • i.e. is the score of the participant above or below the mean for all participants? • Says “mean” so must be parametric Pearson’s
  • 12.
    Measuring relationships • Doesthe correlation based on ranks • i.e. is the best person at one thing also the best at another? • Non-parametric test Spearman’s
  • 13.
    THE DIRECTION OFTHE CORRELATION IS DETERMINED BY WHETHER PEOPLE ARE DOING THE SAME THING ON BOTH VARIABLES, NOT BY WHETHER THEIR SCORES ARE BETTER/WORSE THAN AVERAGE Remember
  • 14.
    Measuring relationships • Wecan calculate the degree of correlation between any two variables as long as they can be paired. • Correlation is a only descriptive measure • Unless we also calculate whether the relationship is strong enough to be significant Correlation
  • 15.
    Measuring relationships • Thestrength of a correlation is expressed on a scale from + 1 through 0 and on to -1. • This figure is called the correlation coefficient • The closer to 1, the stronger the relationship • Ignore the sign when you are assessing the strength and the significance. Correlation