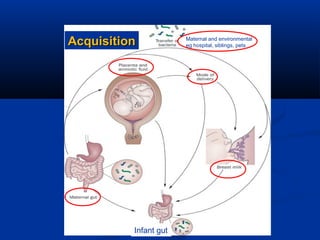
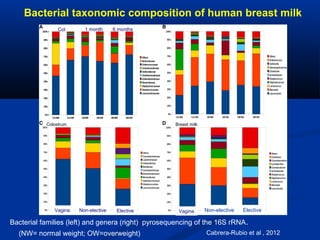
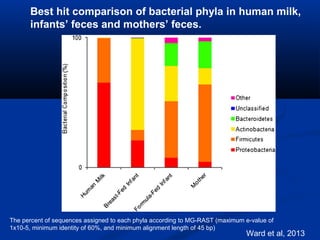
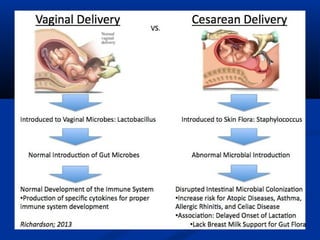
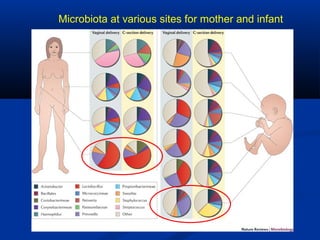
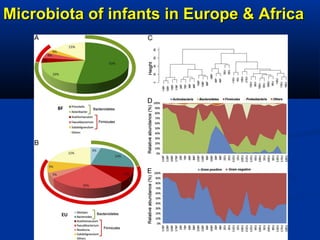
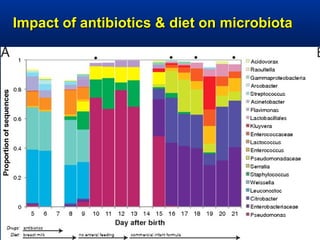
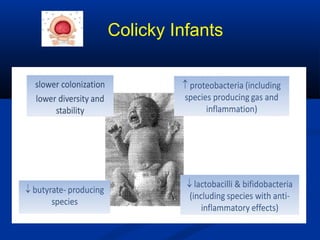
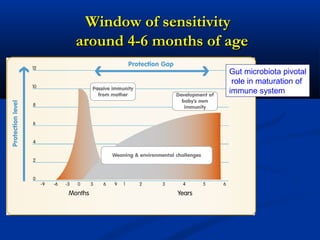
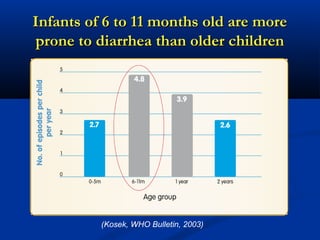
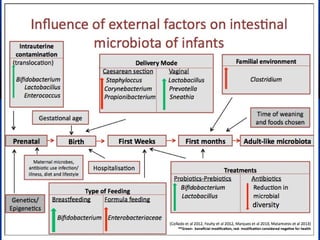
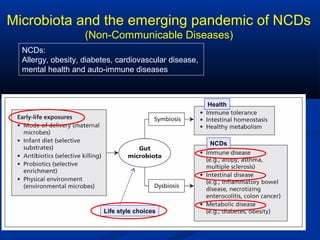
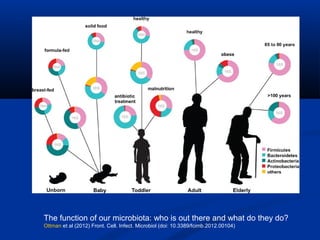
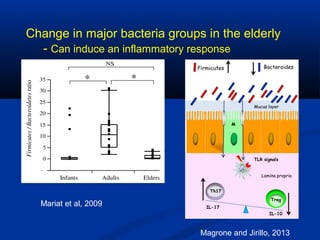
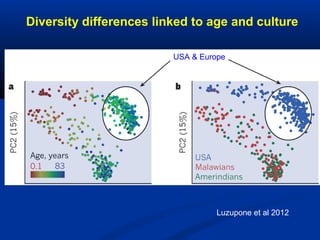
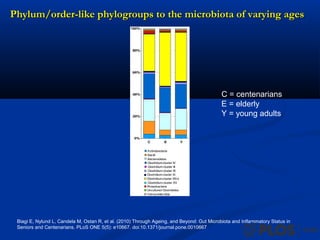
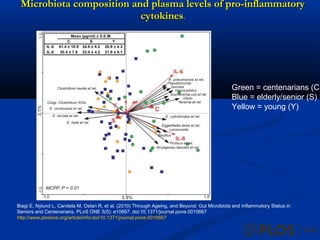
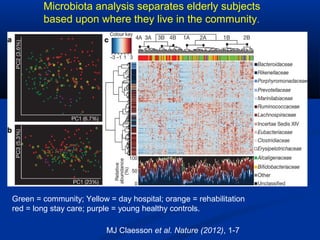
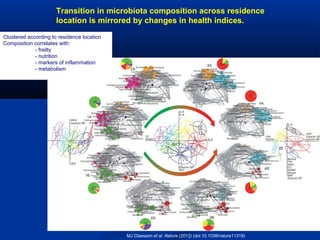
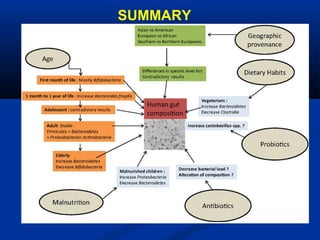
Intestinal Microbiota During LifeIntestinal Microbiota During Life
Patricia ConwayPatricia Conway
The University of New South WalesThe University of New South Wales
Sydney, AustraliaSydney, Australia
OverviewOverview
 Acquisition in the newbornAcquisition in the newborn
 Factors affecting the infant microbiotaFactors affecting the infant microbiota
 Describe the successive developmentDescribe the successive development
 Factors affecting the adult microbiotaFactors affecting the adult microbiota
Maternal and environmental
eg hospital, siblings, petsAcquisitionAcquisition
Infant gut
Cabrera-Rubio et al , 2012
Bacterial taxonomic composition of human breast milk
Bacterial families (left) and genera (right) pyrosequencing of the 16S rRNA.
Col 1 month 6 months
Vagina Non-elective Elective
Colostrum Breast milk
Vagina Non-elective Elective
(NW= normal weight; OW=overweight)
Ward et al, 2013
The percent of sequences assigned to each phyla according to MG-RAST (maximum e-value of
1x10⁻⁵, minimum identity of 60%, and minimum alignment length of 45 bp)
Best hit comparison of bacterial phyla in human milk,
infants’ feces and mothers’ feces.
Utilization of human milk oligosaccharides by bifidobacteria
B. longum subsp infantis: Infant strain
Others: Adult strains
Sela & Mills, 2010
Bifidobacteria in breast milk: link withBifidobacteria in breast milk: link with
allergy/atopy of the mothersallergy/atopy of the mothers
(Groenlund et al. Clinical & Exp Allergy 2007; 37: 1764 – 1772)et al. Clinical & Exp Allergy 2007; 37: 1764 – 1772)
Maternal breastmilk Bifi countsMaternal breastmilk Bifi counts
impacted the infants fecal Bifiimpacted the infants fecal Bifi
levelslevels
(p = 0.013)(p = 0.013)
Breastmilk bacteria: anBreastmilk bacteria: an
important source of bacteria inimportant source of bacteria in
the establishment of infantilethe establishment of infantile
intestinal microbiotaintestinal microbiota
Allergic mothers (atopic or non-atopic)Allergic mothers (atopic or non-atopic)
have significantly fewer bifidobacteriahave significantly fewer bifidobacteria
in breastmilkin breastmilk
OverviewOverview
 Acquisition in the newbornAcquisition in the newborn
 Factors affecting the infant microbiotaFactors affecting the infant microbiota
 Describe the successive developmentDescribe the successive development
 Factors affecting the adult microbiotaFactors affecting the adult microbiota
Microbiota at various sites for mother and infant
Impact of gestation time
Figure 3. Changes in proportion of bacterial phyla.Figure 3. Changes in proportion of bacterial phyla.
Mai V, Young CM, Ukhanova M, Wang X, et al. (2011) Fecal Microbiota in Premature Infants Prior to Necrotizing Enterocolitis.
PLoS ONE 6(6): e20647. doi:10.1371/journal.pone.0020647
http://www.plosone.org/article/info:doi/10.1371/journal.pone.0020647
Fecal microbiota in preterms prior to NEC
Microbiota of infants in Europe & AfricaMicrobiota of infants in Europe & Africa
Impact of antibiotics & diet on microbiotaImpact of antibiotics & diet on microbiota
Colicky Infants
Window of sensitivityWindow of sensitivity
around 4-6 months of agearound 4-6 months of age
Gut microbiota pivotal
role in maturation of
immune system
Infants of 6 to 11 months old are moreInfants of 6 to 11 months old are more
prone to diarrhea than older childrenprone to diarrhea than older children
(Kosek, WHO Bulletin, 2003)
Microbiota and the emerging pandemic of NCDs
(Non-Communicable Diseases)
NCDs:
Allergy, obesity, diabetes, cardiovascular disease,
mental health and auto-immune diseases
Life style choices
Health
NCDs
OverviewOverview
 Acquisition in the newbornAcquisition in the newborn
 Factors affecting the infant microbiotaFactors affecting the infant microbiota
 Describe the successive developmentDescribe the successive development
 Factors affecting the adult microbiotaFactors affecting the adult microbiota
The function of our microbiota: who is out there and what do they do?
Ottman et al (2012) Front. Cell. Infect. Microbiol (doi: 10.3389/fcimb.2012.00104)
Mariat et al, 2009
Change in major bacteria groups in the elderly
- Can induce an inflammatory response
Magrone and Jirillo, 2013
OverviewOverview
 Acquisition in the newbornAcquisition in the newborn
 Factors affecting the infant microbiotaFactors affecting the infant microbiota
 Describe the successive developmentDescribe the successive development
 Factors affecting the adult microbiotaFactors affecting the adult microbiota
Factors Impacting on
Adult Gut Microbiota
• Life style choices
• Medications
• Diet
• Stressors
• Age
• Institution care or home living
• Dental health
• Infection
• Hygiene
• Sanitization
• Urban/rural
Diversity differences linked to age and culture
Luzupone et al 2012
USA & Europe
Phylum/order-like phylogroups to the microbiota of varying agesPhylum/order-like phylogroups to the microbiota of varying ages
Biagi E, Nylund L, Candela M, Ostan R, et al. (2010) Through Ageing, and Beyond: Gut Microbiota and Inflammatory Status in
Seniors and Centenarians. PLoS ONE 5(5): e10667. doi:10.1371/journal.pone.0010667
C = centenarians
E = elderly
Y = young adults
Microbiota composition and plasma levels of pro-inflammatoryMicrobiota composition and plasma levels of pro-inflammatory
cytokinescytokines..
Biagi E, Nylund L, Candela M, Ostan R, et al. (2010) Through Ageing, and Beyond: Gut Microbiota and Inflammatory Status in
Seniors and Centenarians. PLoS ONE 5(5): e10667. doi:10.1371/journal.pone.0010667
http://www.plosone.org/article/info:doi/10.1371/journal.pone.0010667
Green = centenarians (C)
Blue = elderly/senior (S)
Yellow = young (Y)
MJ Claesson et al. Nature (2012), 1-7
Microbiota analysis separates elderly subjects
based upon where they live in the community.
Green = community; Yellow = day hospital; orange = rehabilitation
red = long stay care; purple = young healthy controls.
MJ Claesson et al. Nature (2012) (doi:10.1038/nature11319)
Transition in microbiota composition across residence
location is mirrored by changes in health indices.
Clustered according to residence location
Composition correlates with:
- frailty
- nutrition
- markers of inflammation
- metabolism
SUMMARY
Thank YouThank You

Conway yakultfoundation2015

  • 1.
    Intestinal Microbiota DuringLifeIntestinal Microbiota During Life Patricia ConwayPatricia Conway The University of New South WalesThe University of New South Wales Sydney, AustraliaSydney, Australia
  • 2.
    OverviewOverview  Acquisition inthe newbornAcquisition in the newborn  Factors affecting the infant microbiotaFactors affecting the infant microbiota  Describe the successive developmentDescribe the successive development  Factors affecting the adult microbiotaFactors affecting the adult microbiota
  • 3.
    Maternal and environmental eghospital, siblings, petsAcquisitionAcquisition Infant gut
  • 4.
    Cabrera-Rubio et al, 2012 Bacterial taxonomic composition of human breast milk Bacterial families (left) and genera (right) pyrosequencing of the 16S rRNA. Col 1 month 6 months Vagina Non-elective Elective Colostrum Breast milk Vagina Non-elective Elective (NW= normal weight; OW=overweight)
  • 5.
    Ward et al,2013 The percent of sequences assigned to each phyla according to MG-RAST (maximum e-value of 1x10⁻⁵, minimum identity of 60%, and minimum alignment length of 45 bp) Best hit comparison of bacterial phyla in human milk, infants’ feces and mothers’ feces.
  • 6.
    Utilization of humanmilk oligosaccharides by bifidobacteria B. longum subsp infantis: Infant strain Others: Adult strains Sela & Mills, 2010
  • 7.
    Bifidobacteria in breastmilk: link withBifidobacteria in breast milk: link with allergy/atopy of the mothersallergy/atopy of the mothers (Groenlund et al. Clinical & Exp Allergy 2007; 37: 1764 – 1772)et al. Clinical & Exp Allergy 2007; 37: 1764 – 1772) Maternal breastmilk Bifi countsMaternal breastmilk Bifi counts impacted the infants fecal Bifiimpacted the infants fecal Bifi levelslevels (p = 0.013)(p = 0.013) Breastmilk bacteria: anBreastmilk bacteria: an important source of bacteria inimportant source of bacteria in the establishment of infantilethe establishment of infantile intestinal microbiotaintestinal microbiota Allergic mothers (atopic or non-atopic)Allergic mothers (atopic or non-atopic) have significantly fewer bifidobacteriahave significantly fewer bifidobacteria in breastmilkin breastmilk
  • 8.
    OverviewOverview  Acquisition inthe newbornAcquisition in the newborn  Factors affecting the infant microbiotaFactors affecting the infant microbiota  Describe the successive developmentDescribe the successive development  Factors affecting the adult microbiotaFactors affecting the adult microbiota
  • 10.
    Microbiota at varioussites for mother and infant
  • 11.
  • 12.
    Figure 3. Changesin proportion of bacterial phyla.Figure 3. Changes in proportion of bacterial phyla. Mai V, Young CM, Ukhanova M, Wang X, et al. (2011) Fecal Microbiota in Premature Infants Prior to Necrotizing Enterocolitis. PLoS ONE 6(6): e20647. doi:10.1371/journal.pone.0020647 http://www.plosone.org/article/info:doi/10.1371/journal.pone.0020647 Fecal microbiota in preterms prior to NEC
  • 13.
    Microbiota of infantsin Europe & AfricaMicrobiota of infants in Europe & Africa
  • 14.
    Impact of antibiotics& diet on microbiotaImpact of antibiotics & diet on microbiota
  • 15.
  • 16.
    Window of sensitivityWindowof sensitivity around 4-6 months of agearound 4-6 months of age Gut microbiota pivotal role in maturation of immune system
  • 17.
    Infants of 6to 11 months old are moreInfants of 6 to 11 months old are more prone to diarrhea than older childrenprone to diarrhea than older children (Kosek, WHO Bulletin, 2003)
  • 19.
    Microbiota and theemerging pandemic of NCDs (Non-Communicable Diseases) NCDs: Allergy, obesity, diabetes, cardiovascular disease, mental health and auto-immune diseases Life style choices Health NCDs
  • 20.
    OverviewOverview  Acquisition inthe newbornAcquisition in the newborn  Factors affecting the infant microbiotaFactors affecting the infant microbiota  Describe the successive developmentDescribe the successive development  Factors affecting the adult microbiotaFactors affecting the adult microbiota
  • 21.
    The function ofour microbiota: who is out there and what do they do? Ottman et al (2012) Front. Cell. Infect. Microbiol (doi: 10.3389/fcimb.2012.00104)
  • 23.
    Mariat et al,2009 Change in major bacteria groups in the elderly - Can induce an inflammatory response Magrone and Jirillo, 2013
  • 24.
    OverviewOverview  Acquisition inthe newbornAcquisition in the newborn  Factors affecting the infant microbiotaFactors affecting the infant microbiota  Describe the successive developmentDescribe the successive development  Factors affecting the adult microbiotaFactors affecting the adult microbiota
  • 25.
    Factors Impacting on AdultGut Microbiota • Life style choices • Medications • Diet • Stressors • Age • Institution care or home living • Dental health • Infection • Hygiene • Sanitization • Urban/rural
  • 26.
    Diversity differences linkedto age and culture Luzupone et al 2012 USA & Europe
  • 27.
    Phylum/order-like phylogroups tothe microbiota of varying agesPhylum/order-like phylogroups to the microbiota of varying ages Biagi E, Nylund L, Candela M, Ostan R, et al. (2010) Through Ageing, and Beyond: Gut Microbiota and Inflammatory Status in Seniors and Centenarians. PLoS ONE 5(5): e10667. doi:10.1371/journal.pone.0010667 C = centenarians E = elderly Y = young adults
  • 28.
    Microbiota composition andplasma levels of pro-inflammatoryMicrobiota composition and plasma levels of pro-inflammatory cytokinescytokines.. Biagi E, Nylund L, Candela M, Ostan R, et al. (2010) Through Ageing, and Beyond: Gut Microbiota and Inflammatory Status in Seniors and Centenarians. PLoS ONE 5(5): e10667. doi:10.1371/journal.pone.0010667 http://www.plosone.org/article/info:doi/10.1371/journal.pone.0010667 Green = centenarians (C) Blue = elderly/senior (S) Yellow = young (Y)
  • 29.
    MJ Claesson etal. Nature (2012), 1-7 Microbiota analysis separates elderly subjects based upon where they live in the community. Green = community; Yellow = day hospital; orange = rehabilitation red = long stay care; purple = young healthy controls.
  • 30.
    MJ Claesson etal. Nature (2012) (doi:10.1038/nature11319) Transition in microbiota composition across residence location is mirrored by changes in health indices. Clustered according to residence location Composition correlates with: - frailty - nutrition - markers of inflammation - metabolism
  • 31.
  • 32.

Editor's Notes

  • #14 16S rRNA gene surveys reveal a clear separation of two children populations investigated. (A and B) Pie charts of median values of bacterial genera present in fecal samples of BF and EU children (>3%) found by RDP classifier v. 2.1. Rings represent corresponding phylum (Bacteroidetes in green and Firmicutes in red) for each of the most frequently represented genera. (C) Dendrogram obtained with complete linkage hierarchical clustering of the samples from BF and EU populations based on their genera. The subcluster located in the middle of the tree contains samples taken from the three youngest (1–2 y old) children of the BF group (16BF, 3BF, and 4BF) and two 1-y-old children of the EU group (2EU and 3EU). (D) Relative abundances (percentage of sequences) of the four most abundant bacterial phyla in each individual among the BF and EU children. Blue area in middle shows abundance of Actinobacteria, mainly represented by Bifidobacterium genus, in the five youngest EU and BF children. (E) Relative abundance (percentage of sequences) of Gram-negative and Gram-positive bacteria in each individual. Different distributions of Gram-negative and Gram-positive in the BF and EU populations reflect differences in the two most represented phyla, Bacteroidetes and Firmicutes.
  • #27 Human microbial diversity and enterotypes. Enterotypes31 were determined when evaluating only adults from the United States and Europe (circled in white). By including children from the United States and children and adults from developing countries, the picture of human-associated microbiota diversity greatly expands. The relationship between the microbiota of 531 healthy children and adults from Malawi, Amazonas state of Venezuela (Amerindians) and the United States was evaluated using sequences from the 16S rRNA gene in faecal samples and a principle coordinate analysis of unweighted UniFrac distances (adapted with permission from ref. 4). a, Infants differentiate strongly from adults, and b, adults from the United States have a distinct composition from those of Malawi and Venezuela, indicating the diversity differences are mainly owing to age and culture.
  • #29 Correlation between microbiota composition and plasma levels of pro-inflammatory cytokines. In the RDA blood cytokine levels (red arrows) and age groups (C, S, and Y, red triangles) are used as linear and nominal environmental variables, respectively. Samples belonging to C, S and Y groups are indicated by green circles, blue squares and yellow diamonds, respectively. Responding bacterial subgroups that explained more than 20% of the variability of the samples are indicated by black arrows. First and second ordination axes are plotted, showing 5.8% and 3.1% of the variability in the dataset, respectively. Red arrows which are not labelled corresponds to (clockwise, starting from the left) TNF-a, IFN-c, IL-2, IL-1a, IL-12p70, and IL-1b. Log transformed data were used for this analysis. Bottom-left, P value obtained by MCPP is reported. Top-left, average blood levels of IL-6 and IL-8 in groups C, S and Y are reported.
  • #30 Microbiota analysis separates elderly subjects based upon where they live in the community. a, Unweighted and b, weighted UniFrac PCoA of faecal microbiota from 191 subjects. Subject colour coding: green, community; yellow, day hospital; orange, rehabilitation; red, long-stay; and purple, young healthy control subjects. c, Hierarchical Ward-linkage clustering based on the Spearman correlation coefficients of the proportion of OTUs, filtered for OTU subject prevalence of at least 20%. Subjects colour coding as in a. Labelled clusters in top of panel c (basis for the eight groups in Fig. 4) are highlighted by black squares. OTUs are clustered by the vertical tree, colour-coded by family assignments. Bacteroidetes phylum, blue gradient; Firmicutes, red; Proteobacteria, green; and Actinobacteria, yellow. Only 774 OTUs confidently classified to family level are visualized. The bottom panel shows relative abundance of family-classified microbiota.
  • #31 Transition in microbiota composition across residence location is mirrored by changes in health indices. The PCoA plots show 8 groups of subjects defined by unweighted UniFrac microbiota analysis of community subjects (left), the whole cohort (centre), and long-stay subjects (right). The main circle shows the Wiggum plots corresponding to the 8 groups from whole-cohort analysis, in which disc sizes indicate genus over-abundance relative to background. The pie charts show residence location proportions (colour coded as in Fig. 1c) and number of subjects per subject group. Curved arrows indicate transition from health (green) to frailty (red). FIM, functional independence measure; MNA, mini nutritional assessment; GDT, geriatric depression test; CC, calf circumference; CRP, C-reactive protein; IL, interleukin; BP, blood pressure; MMSE, mini-mental state examination.