Download to read offline


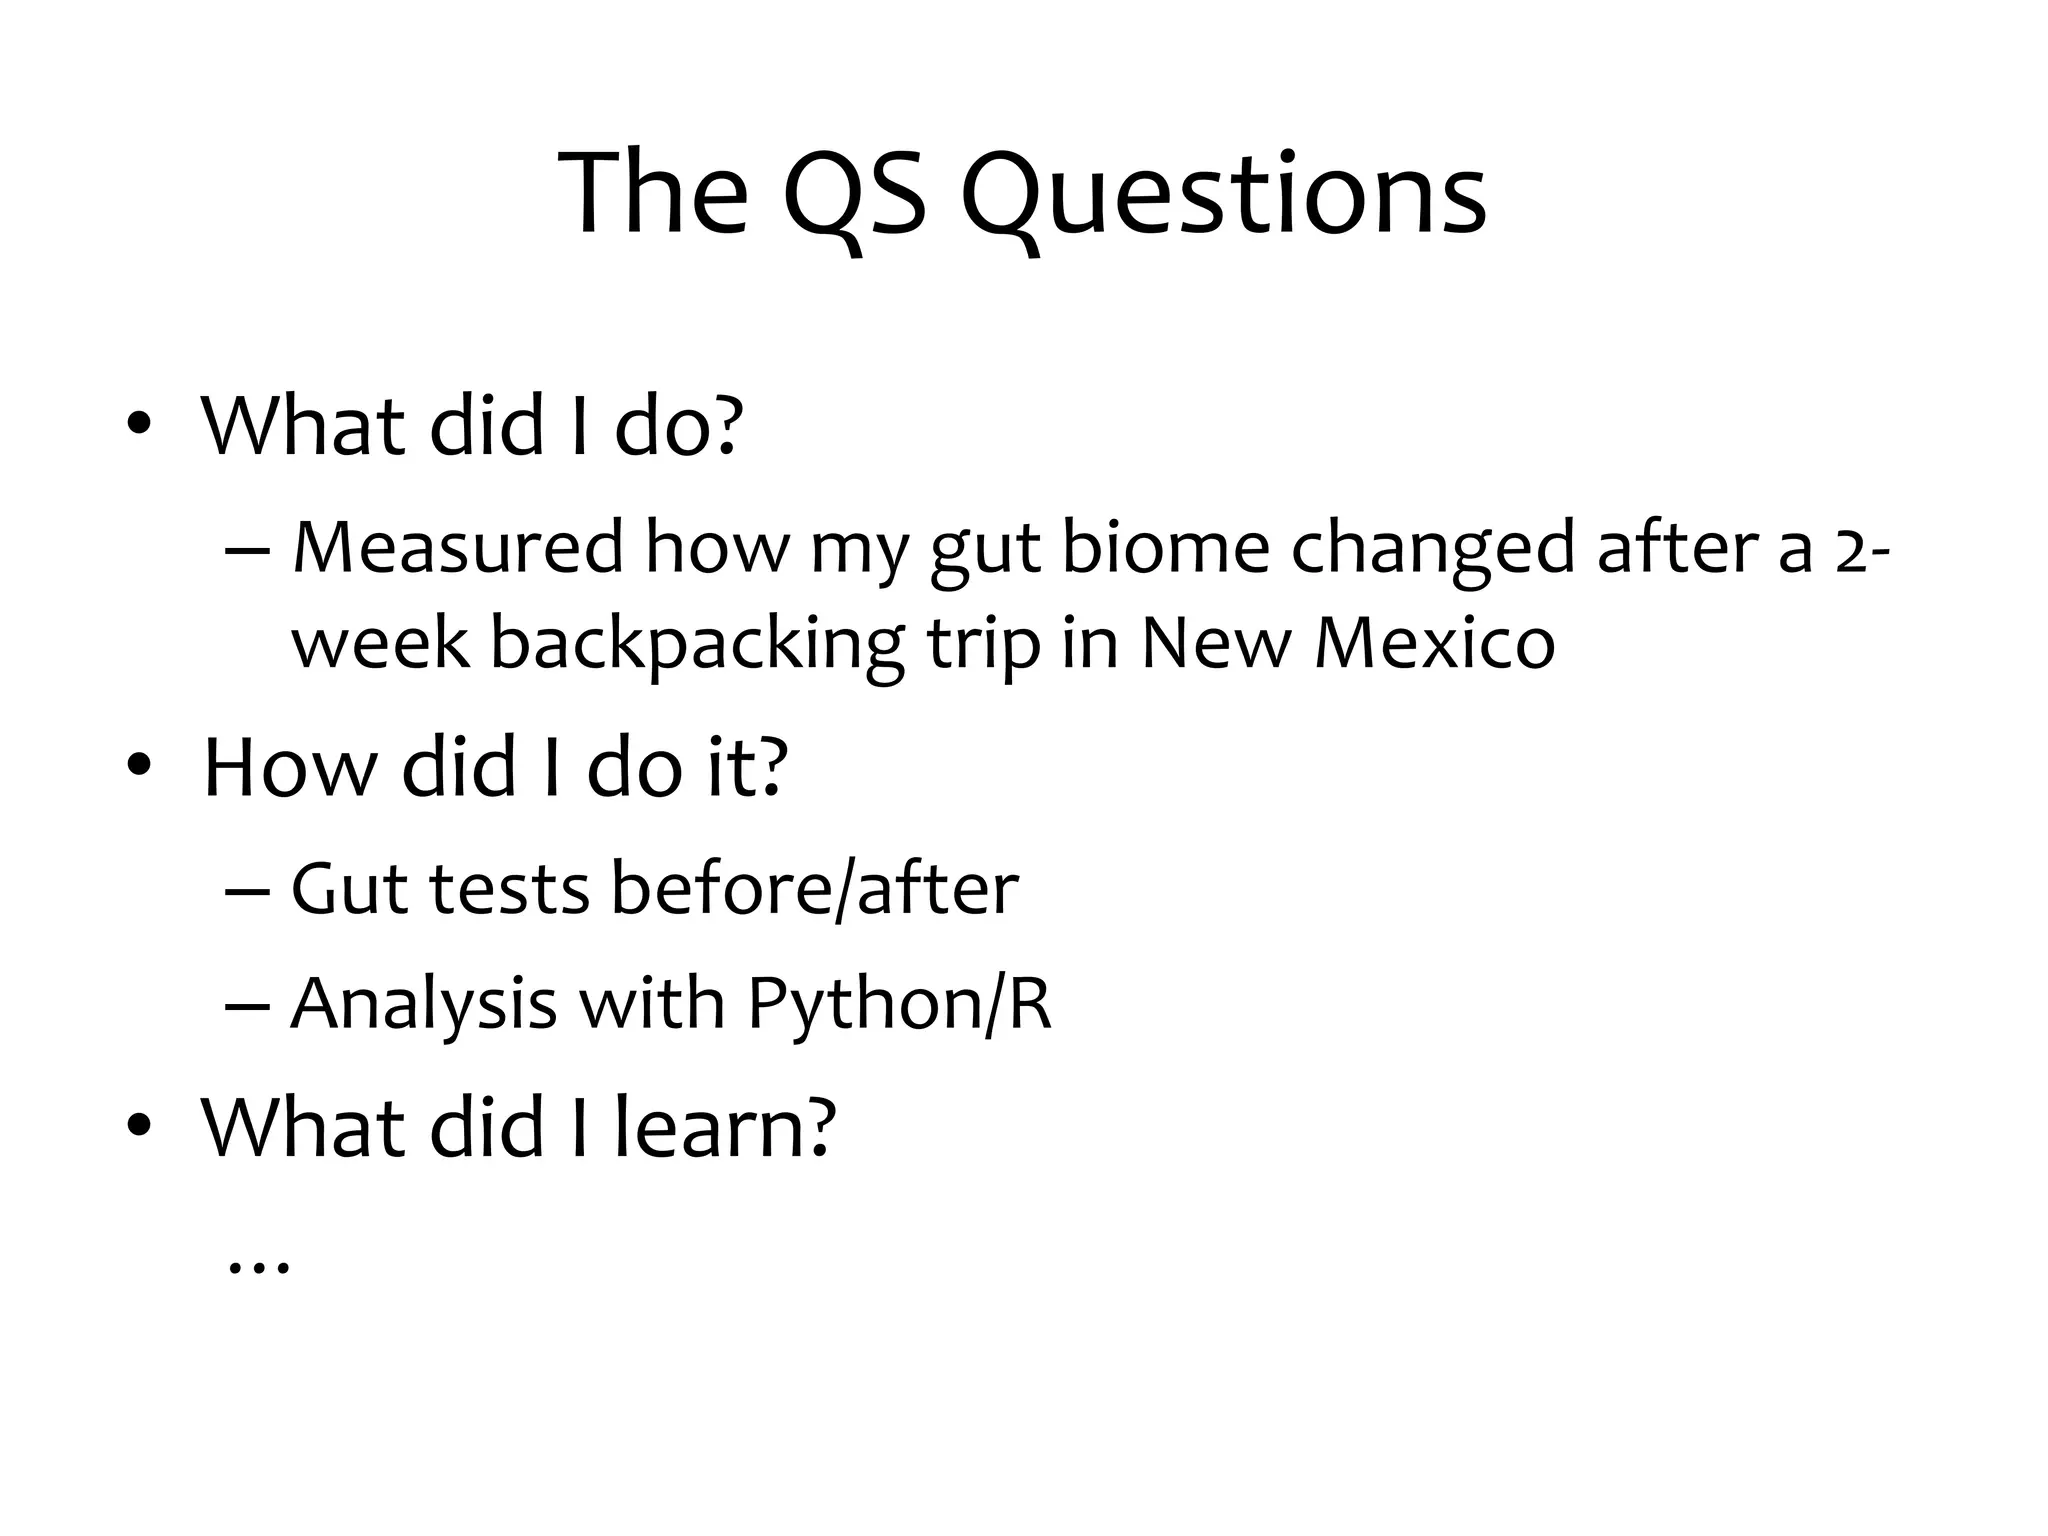
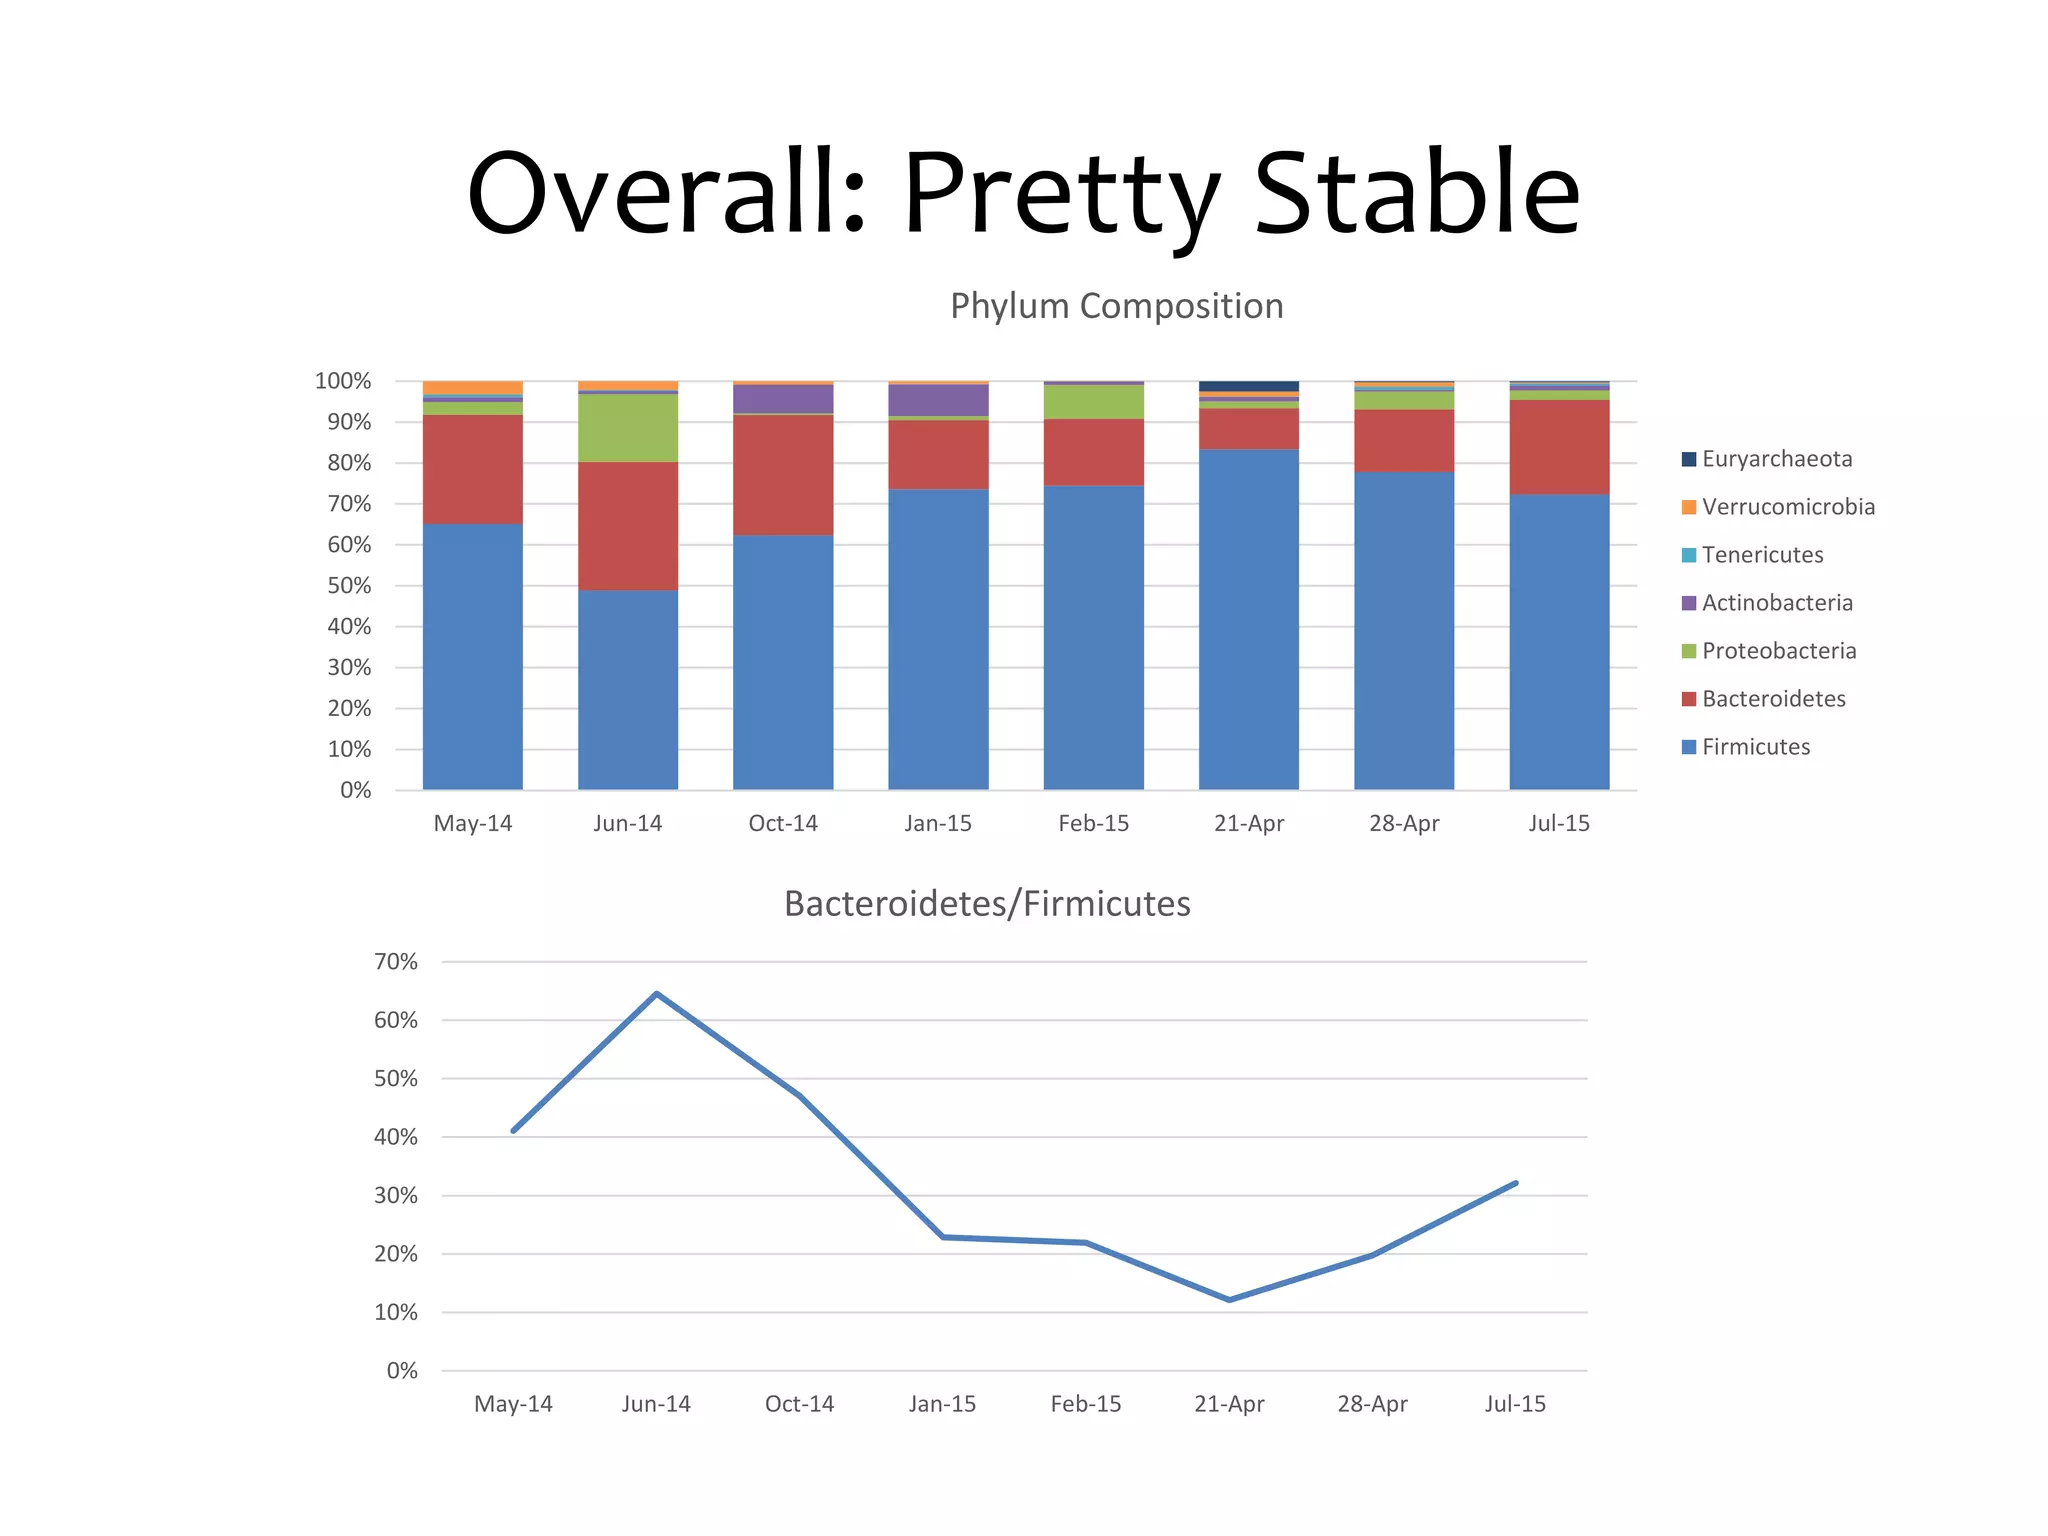
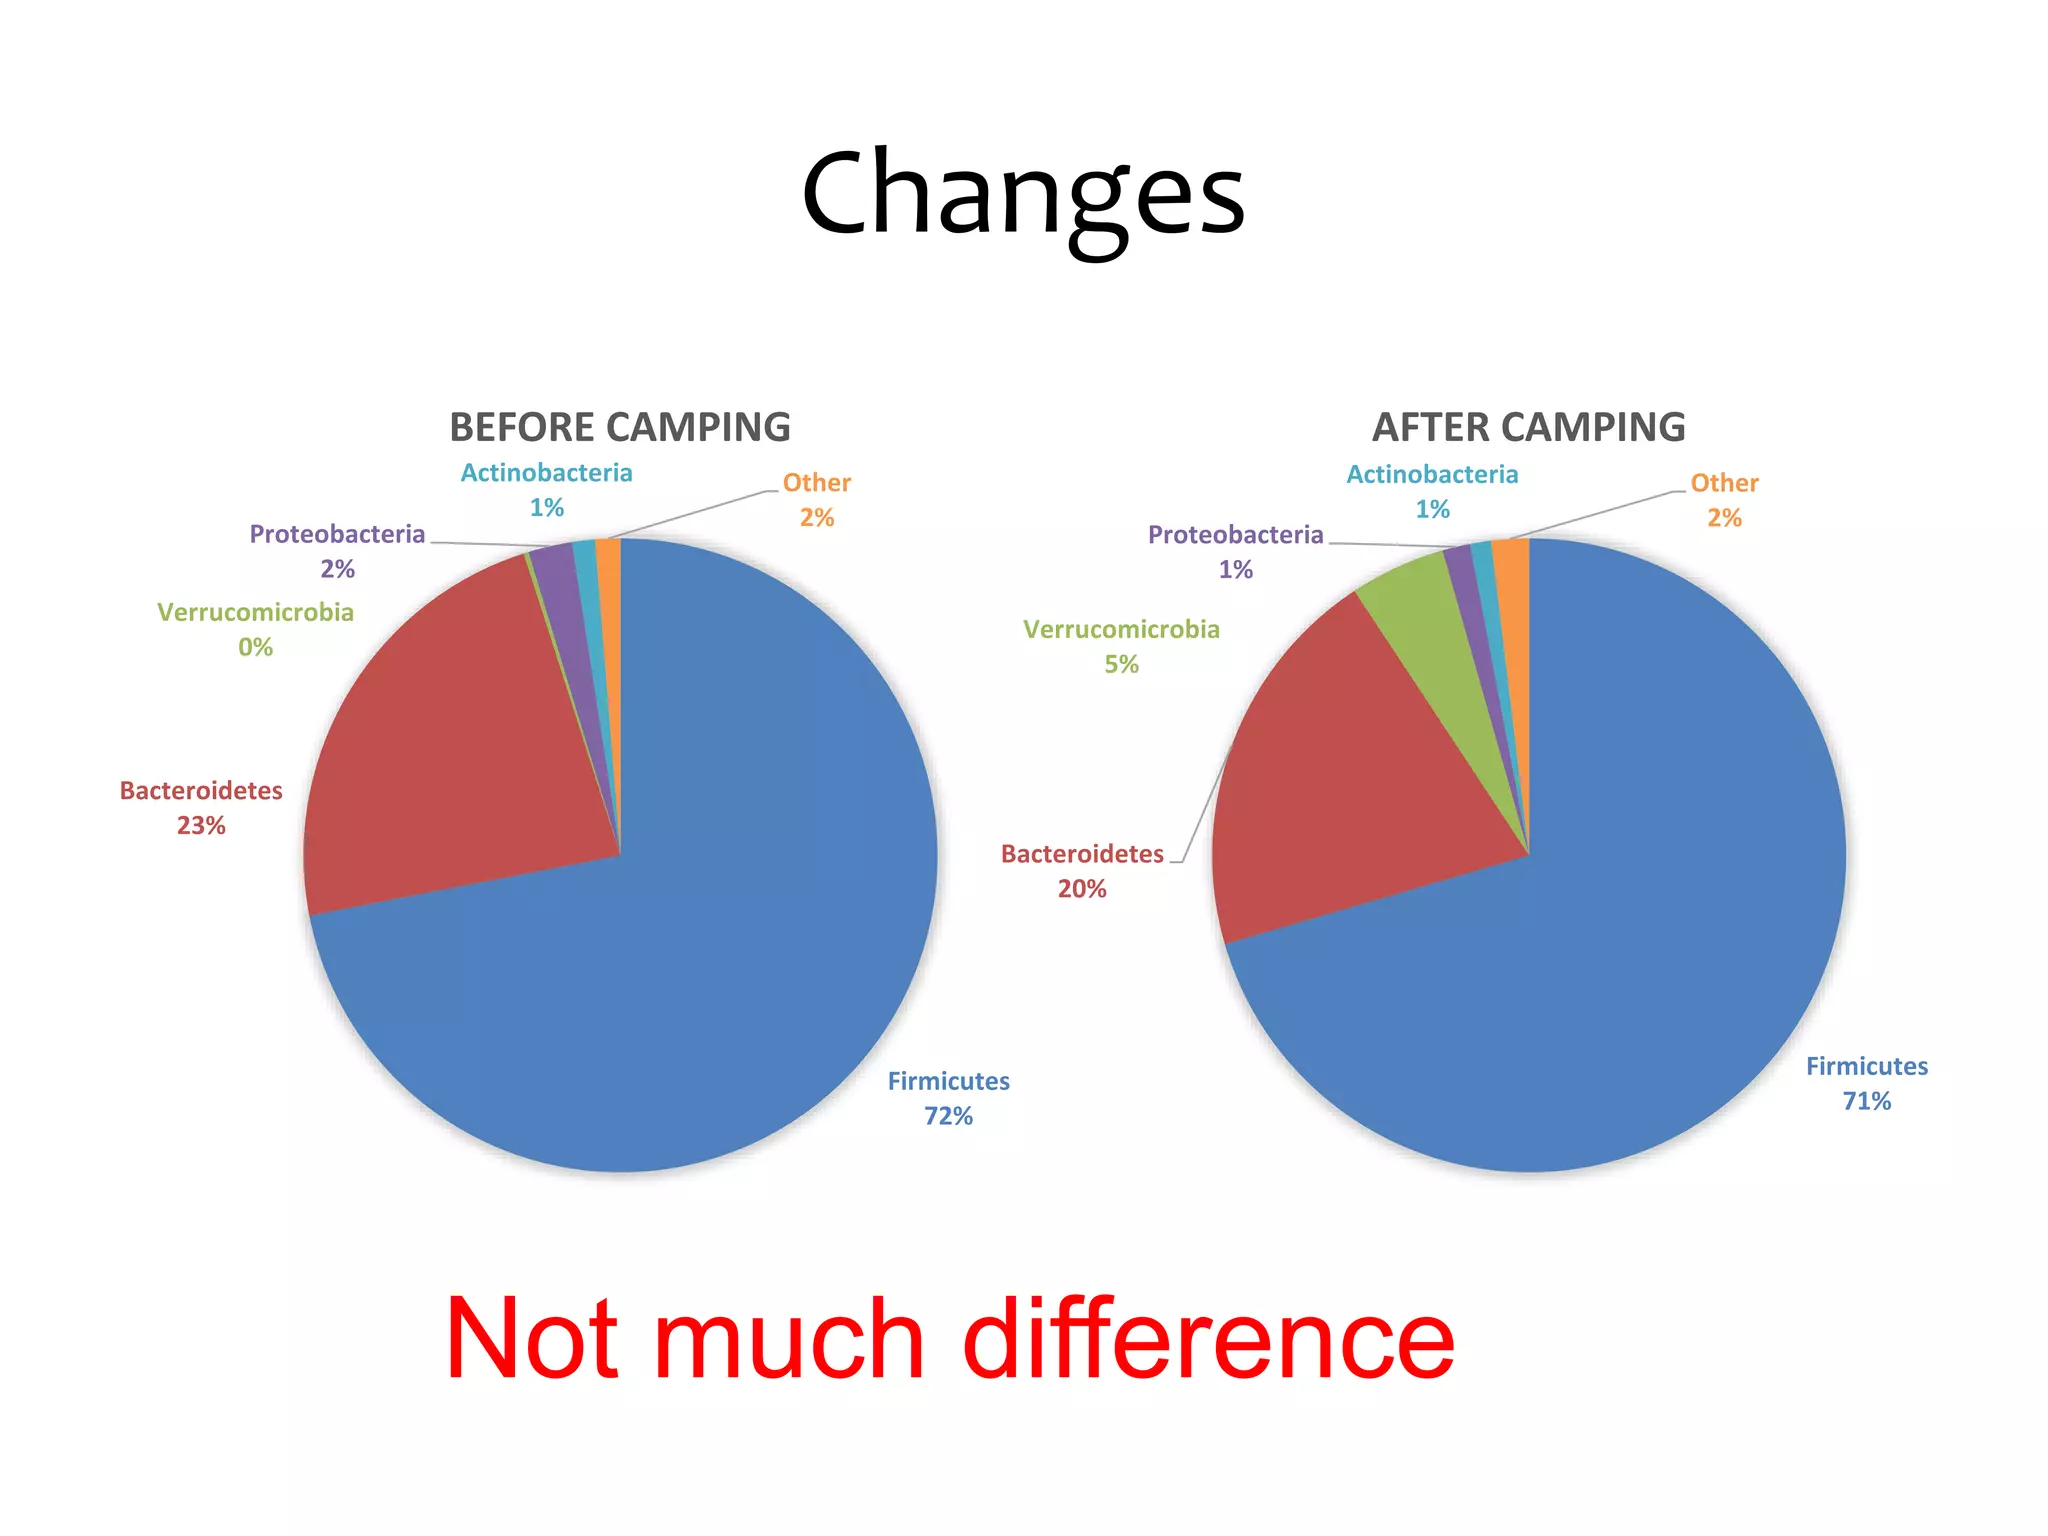
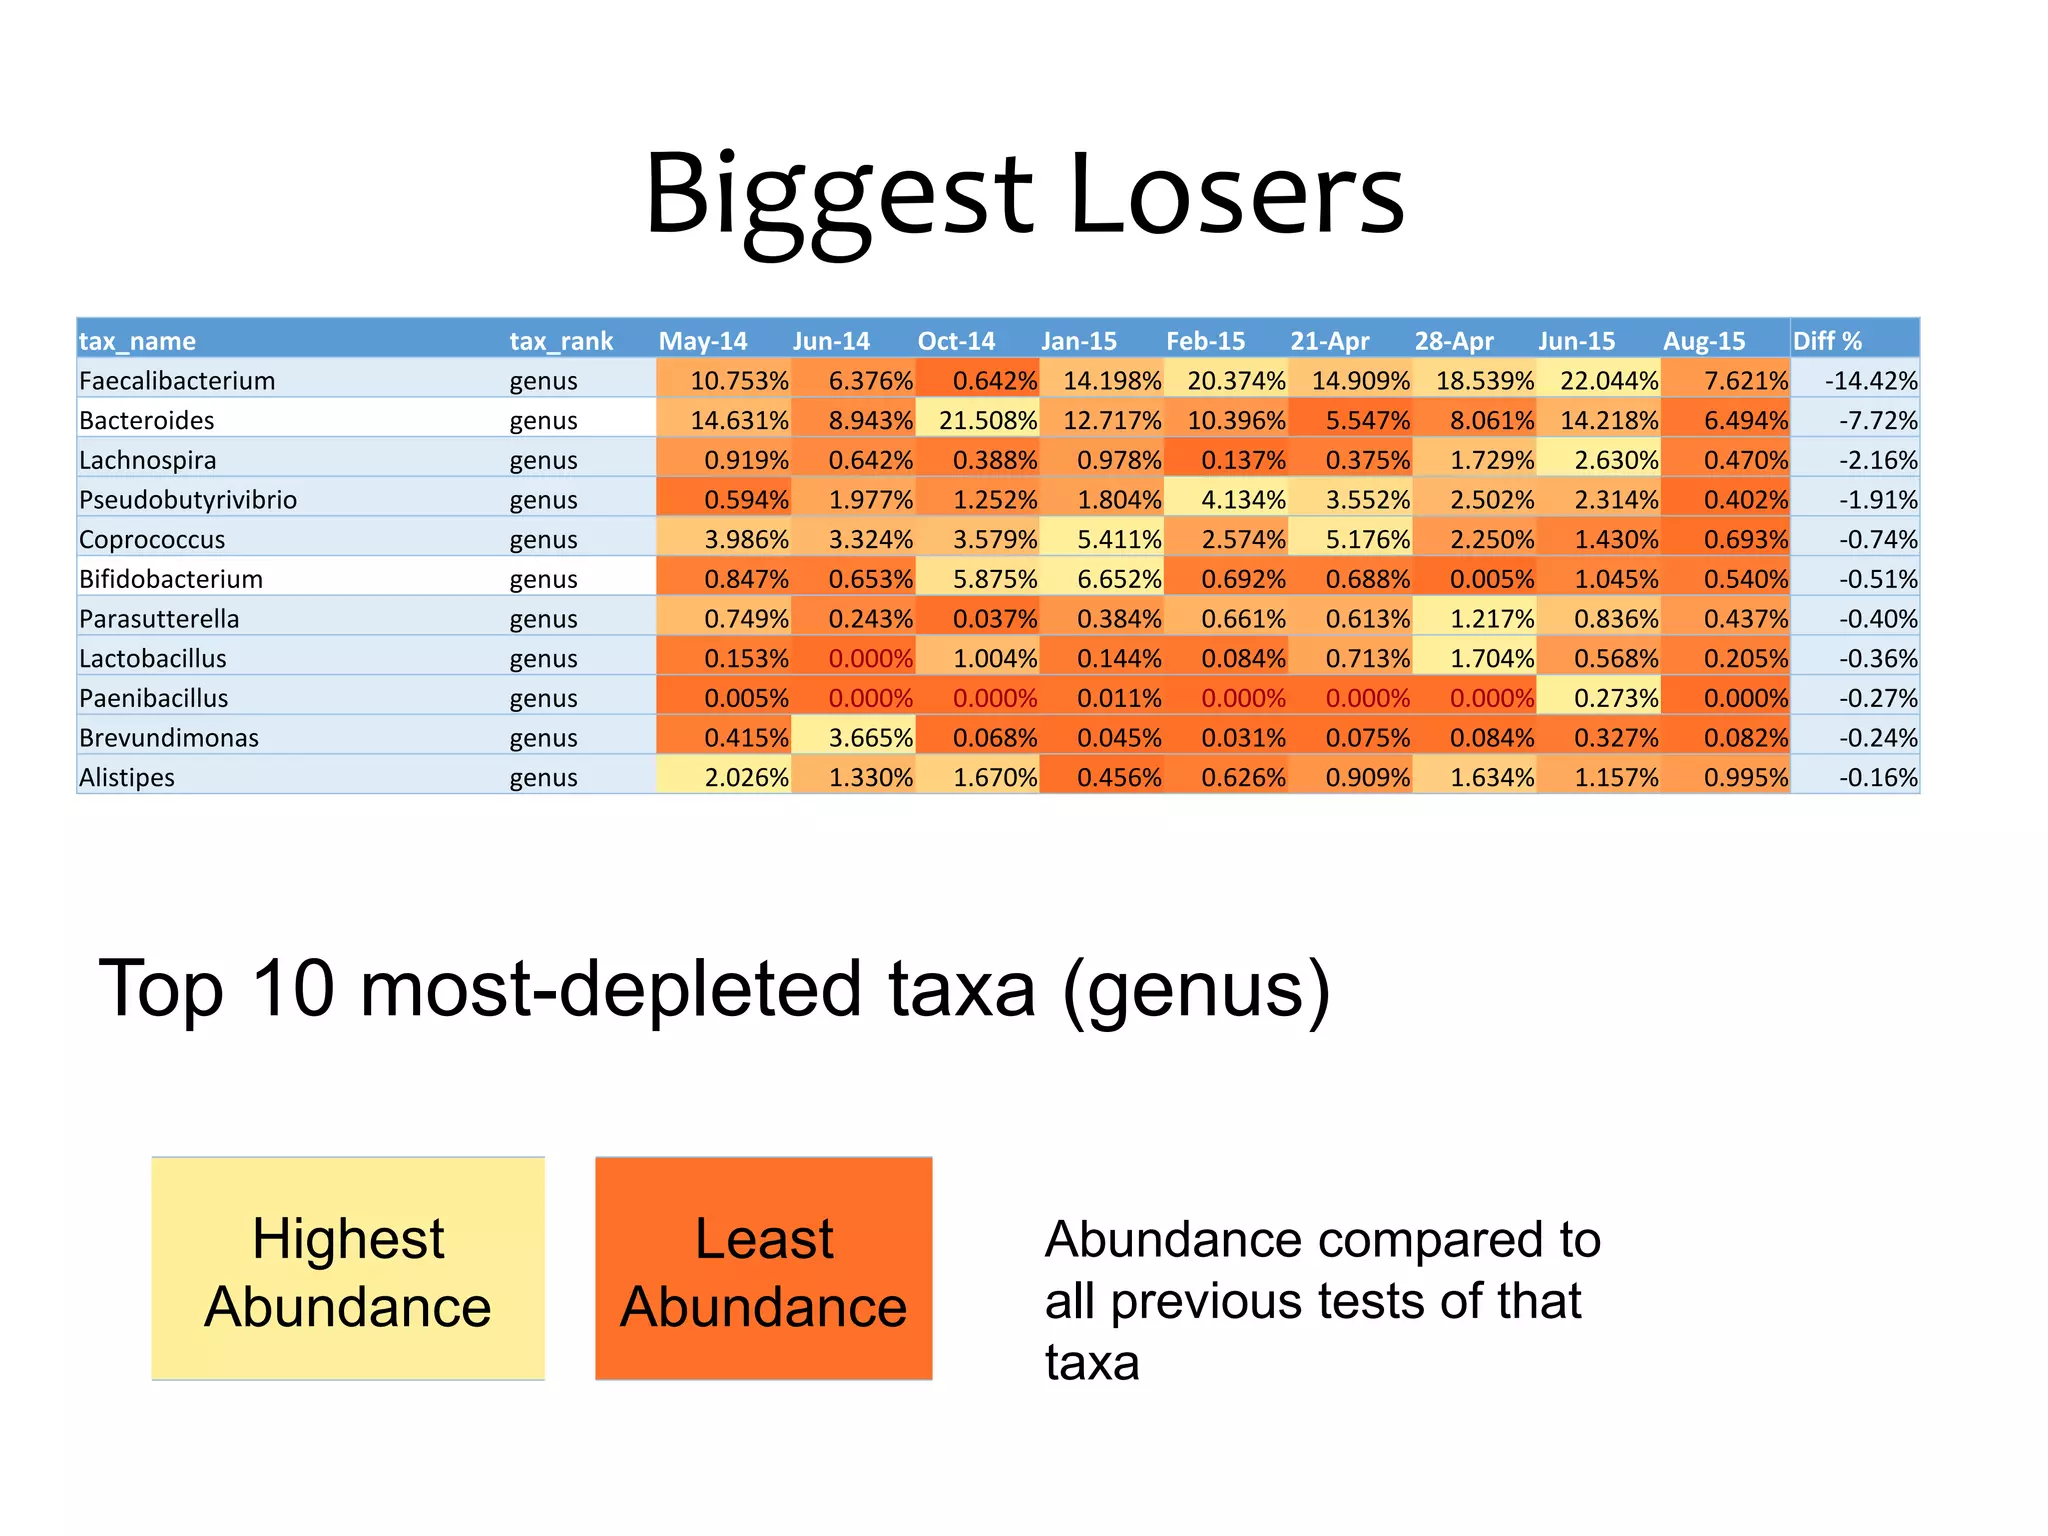
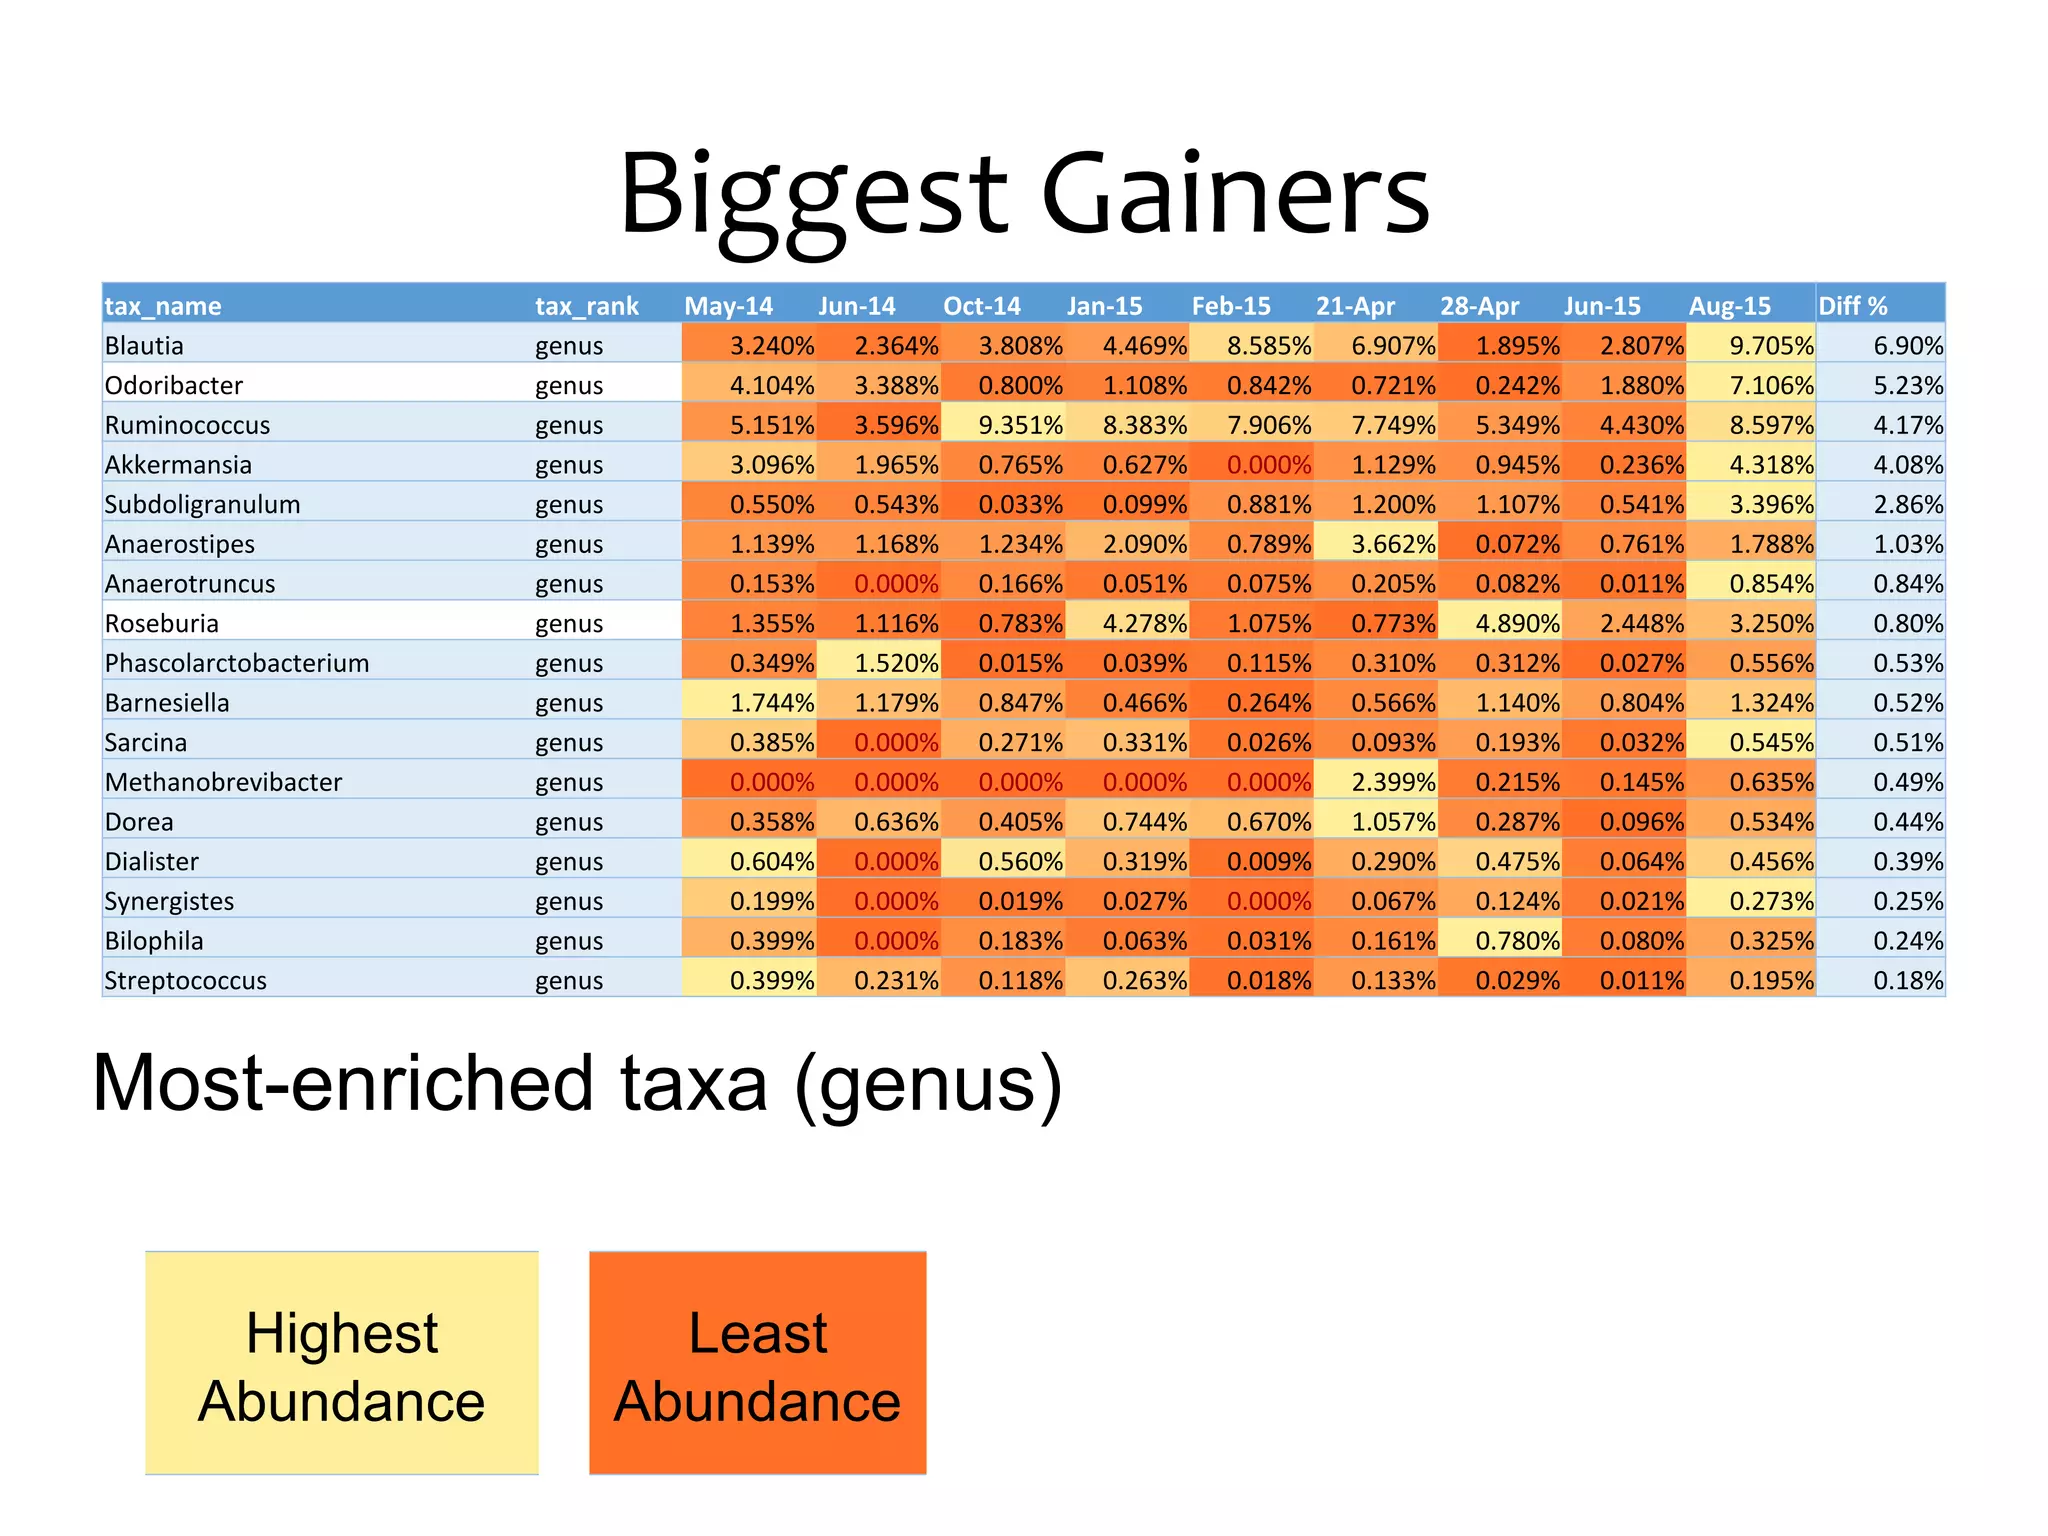
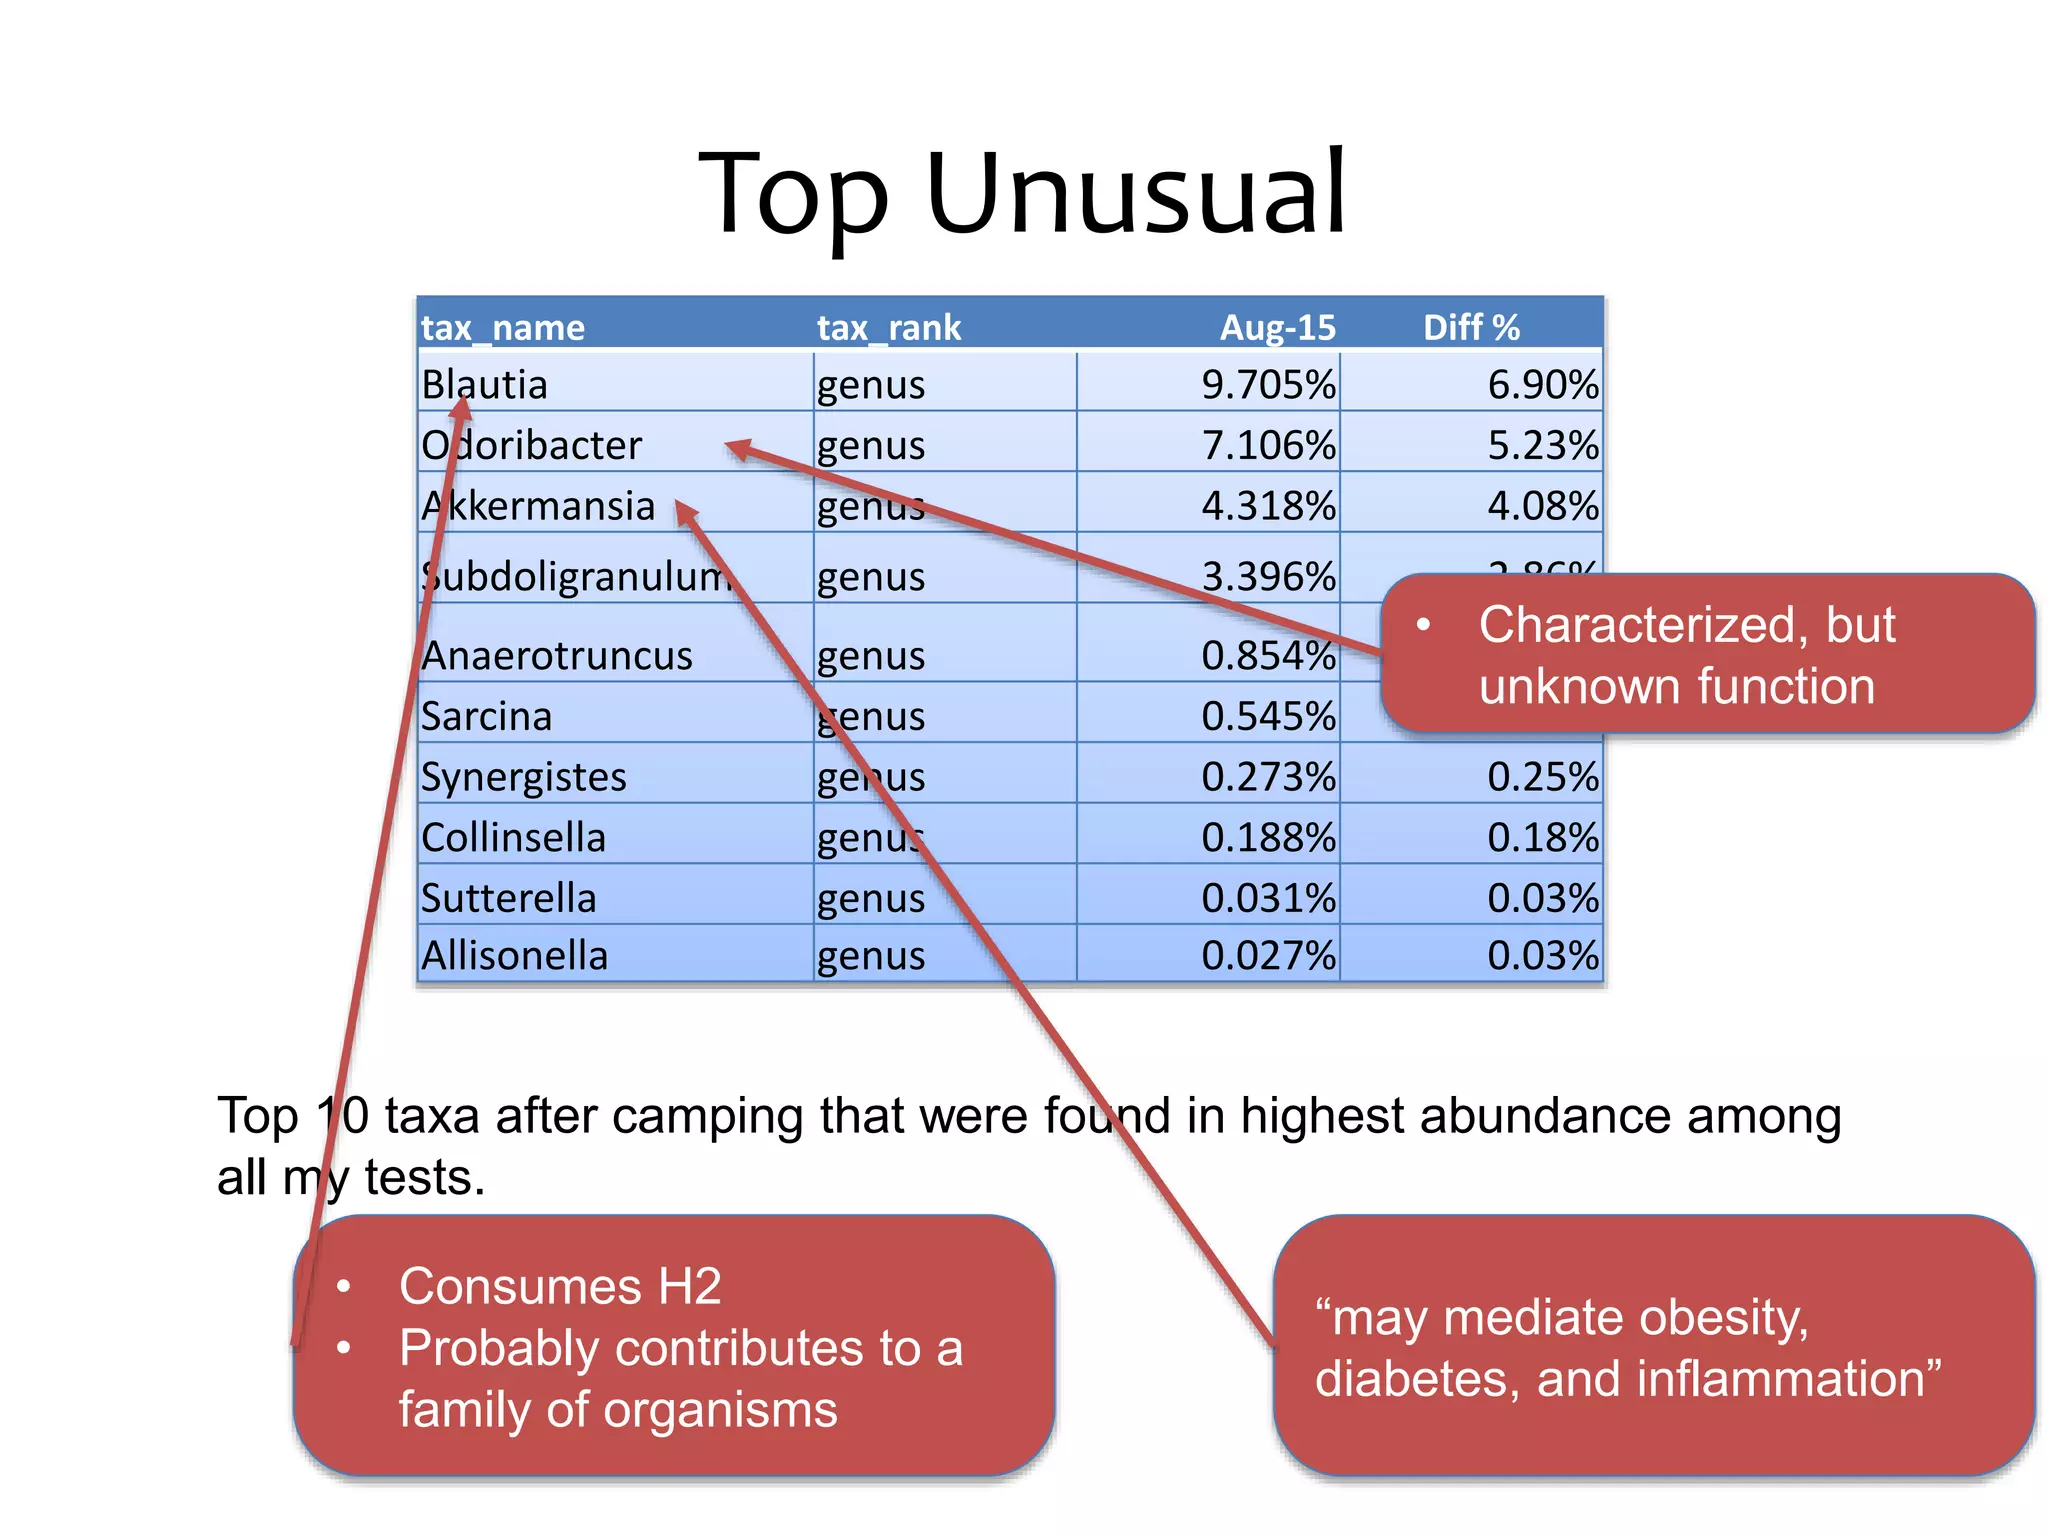
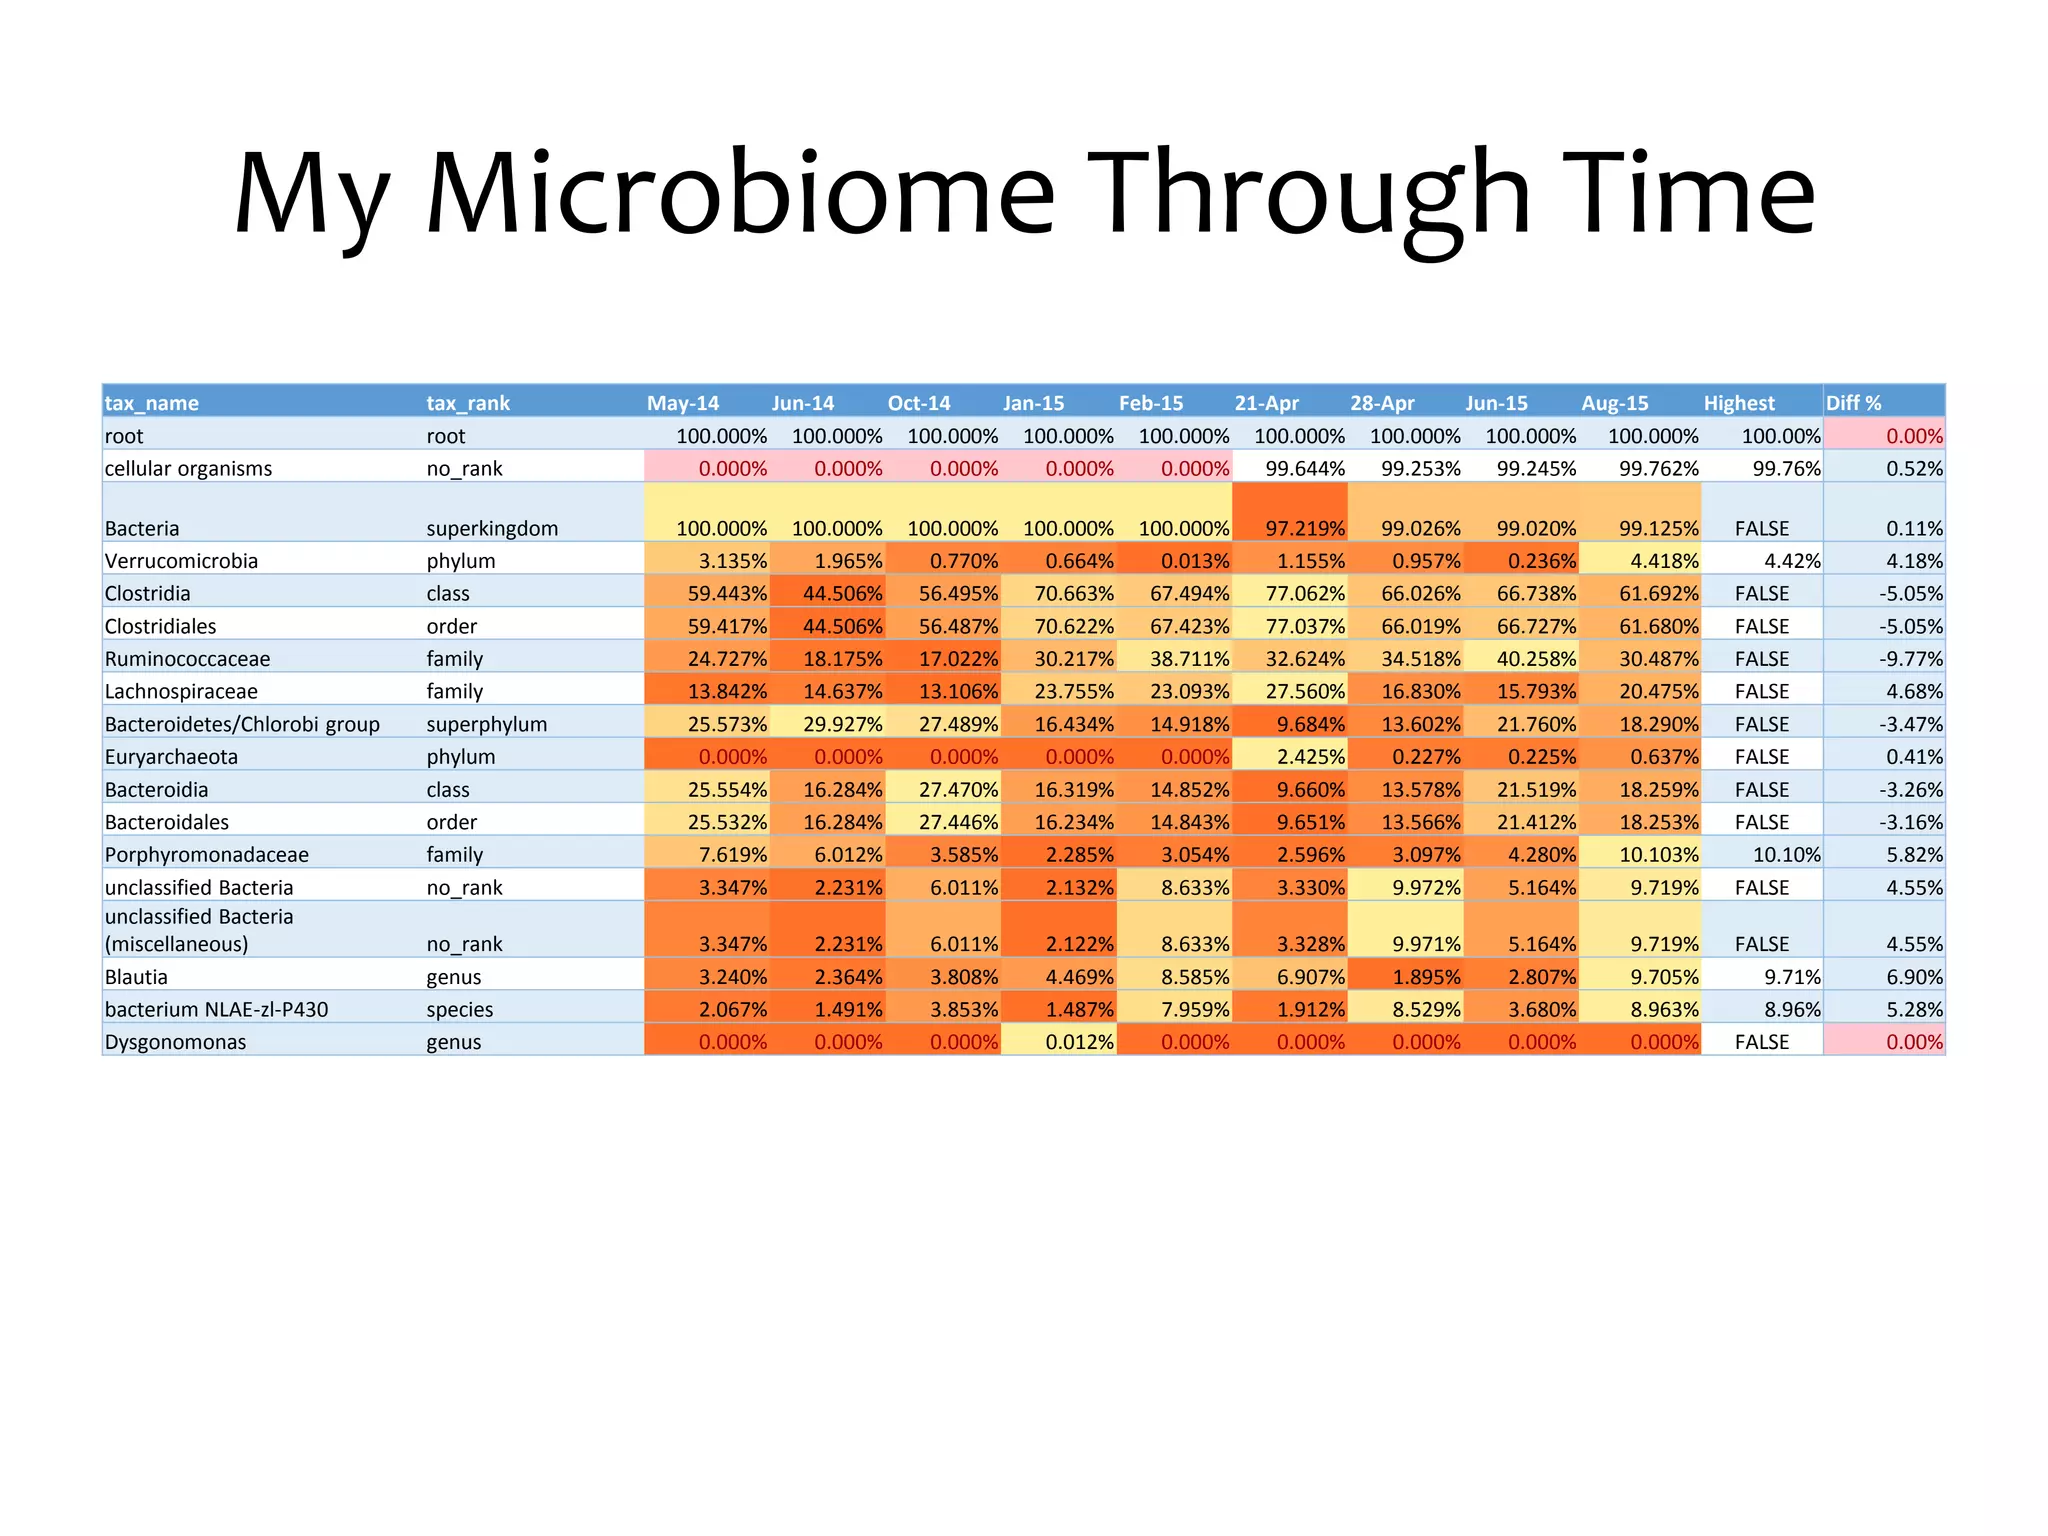
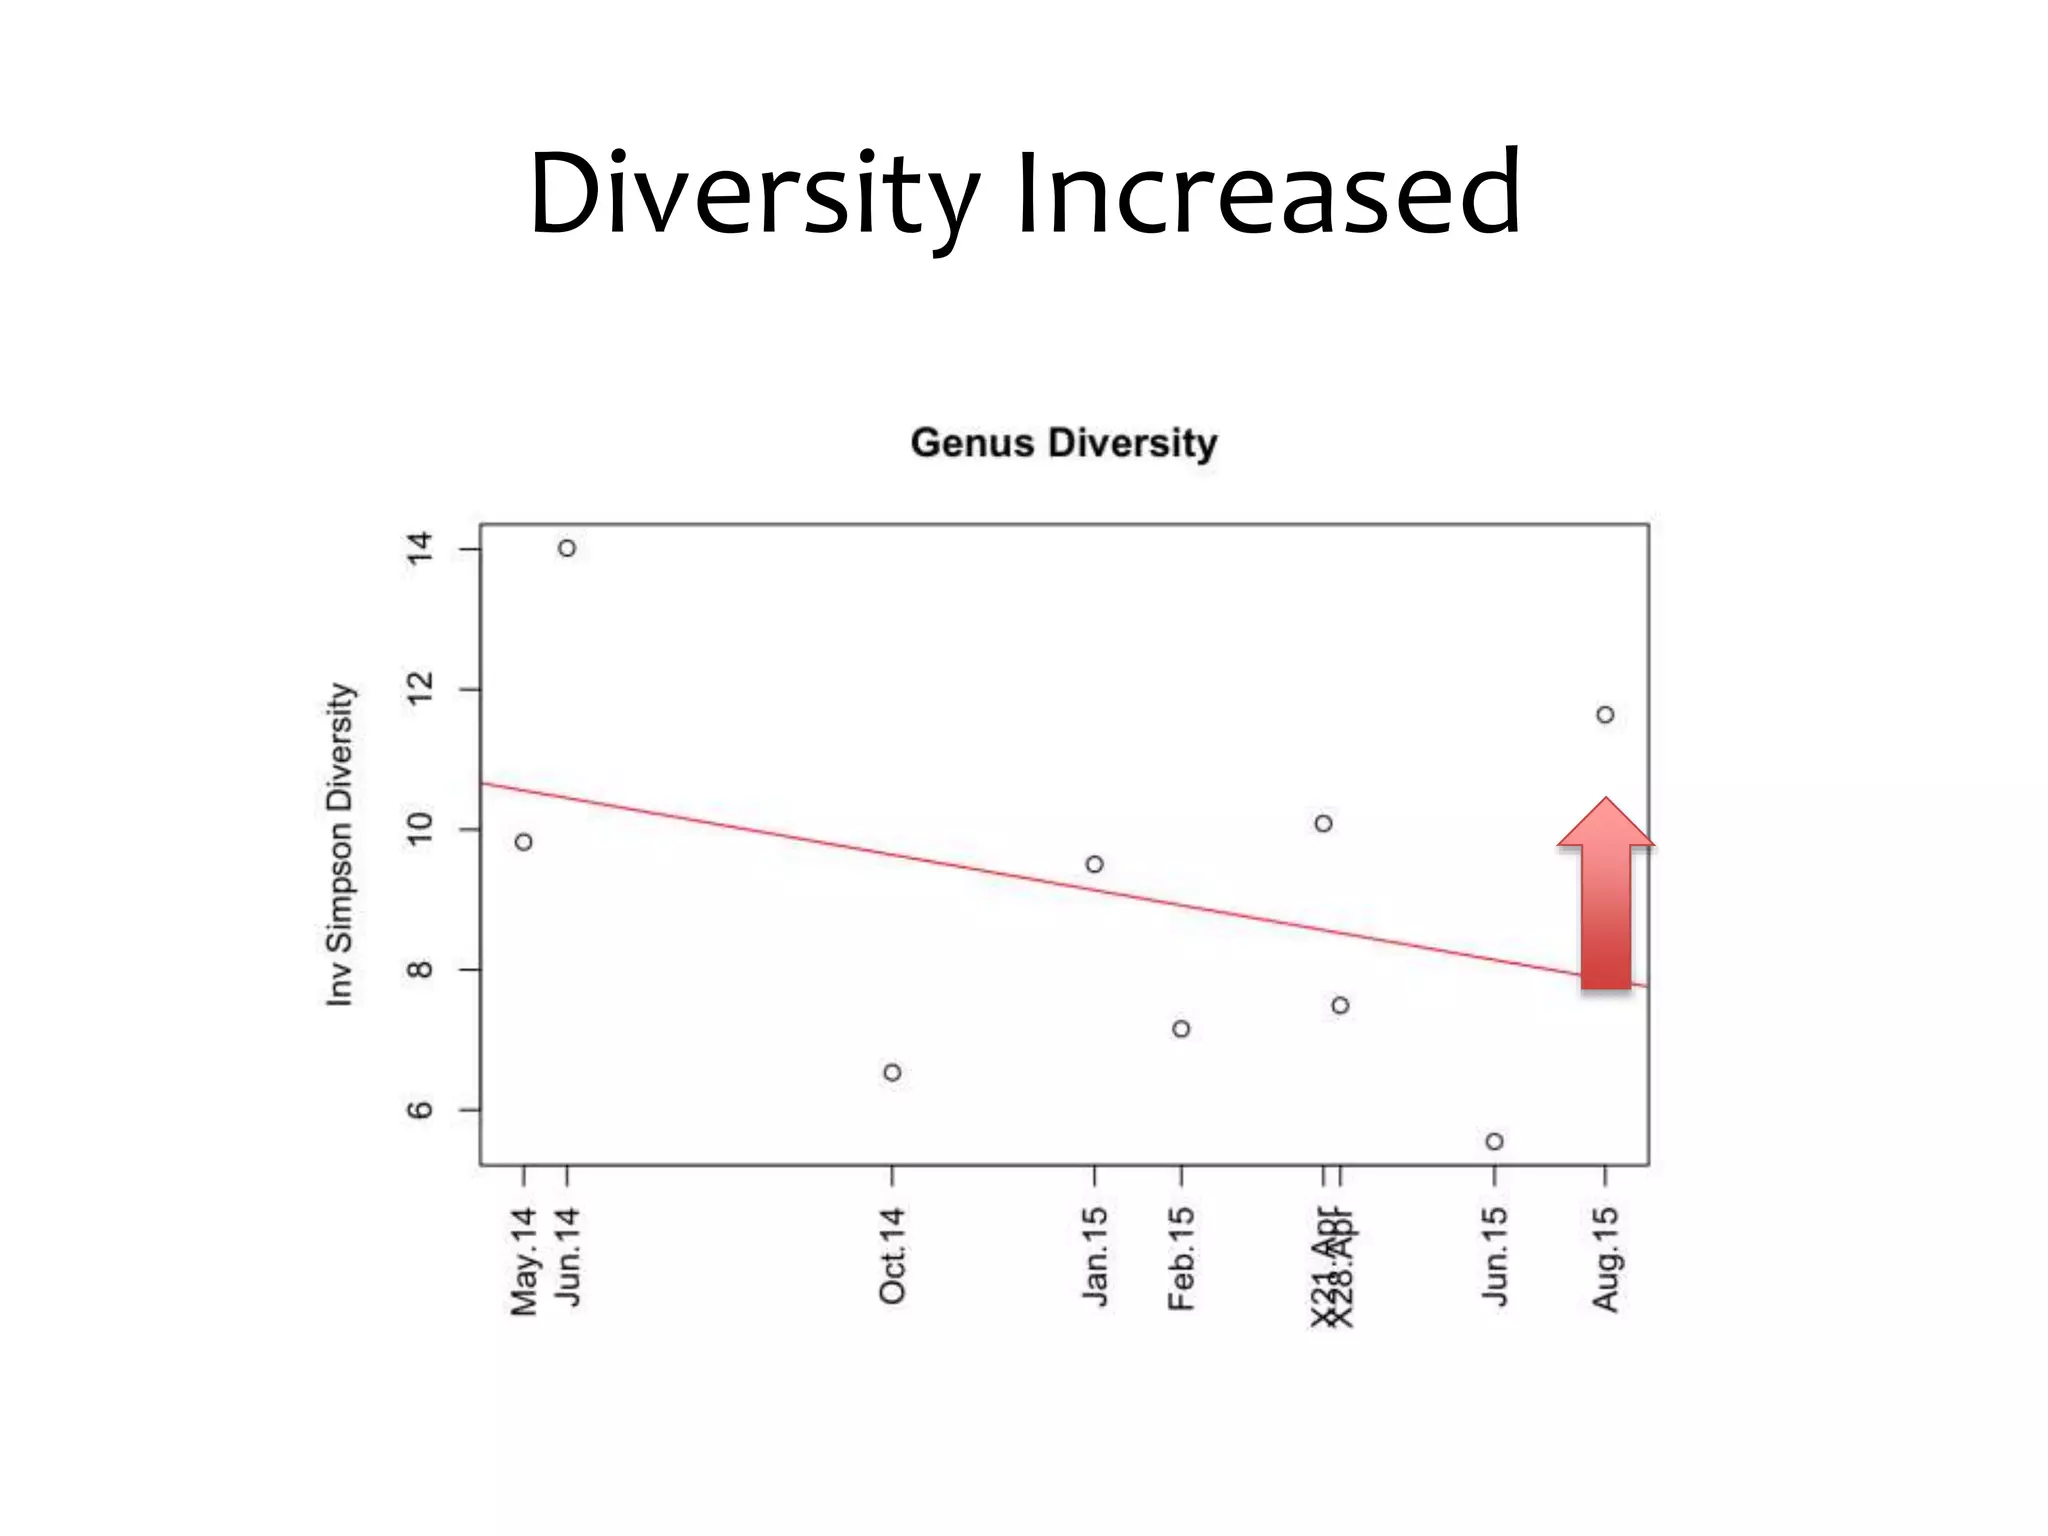

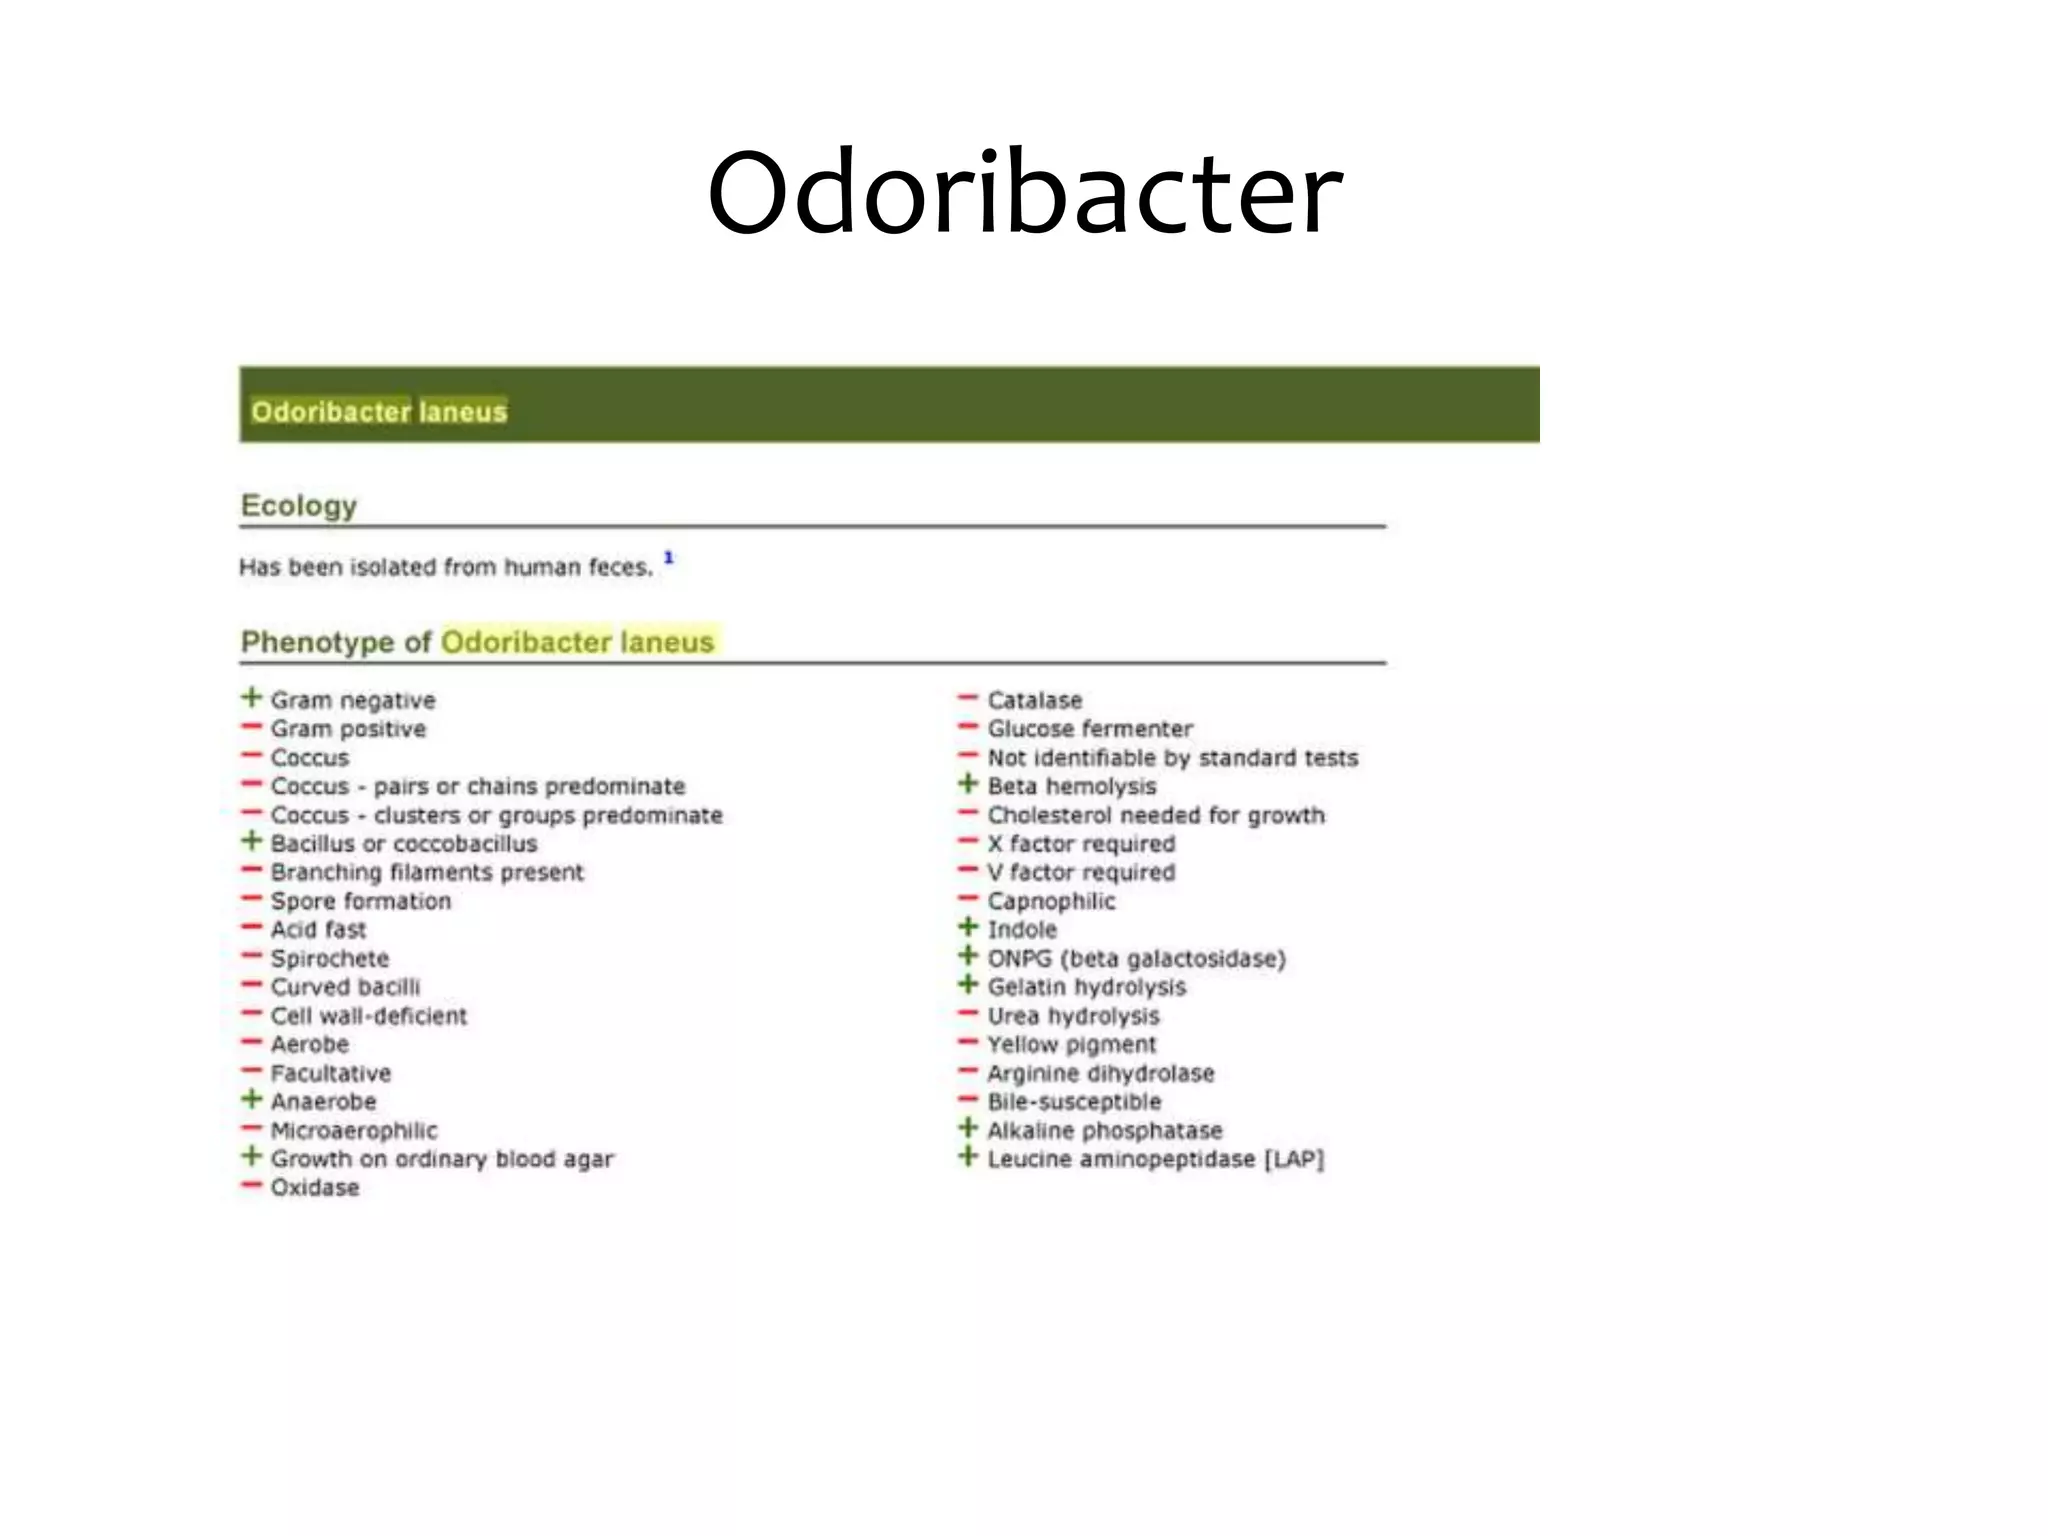
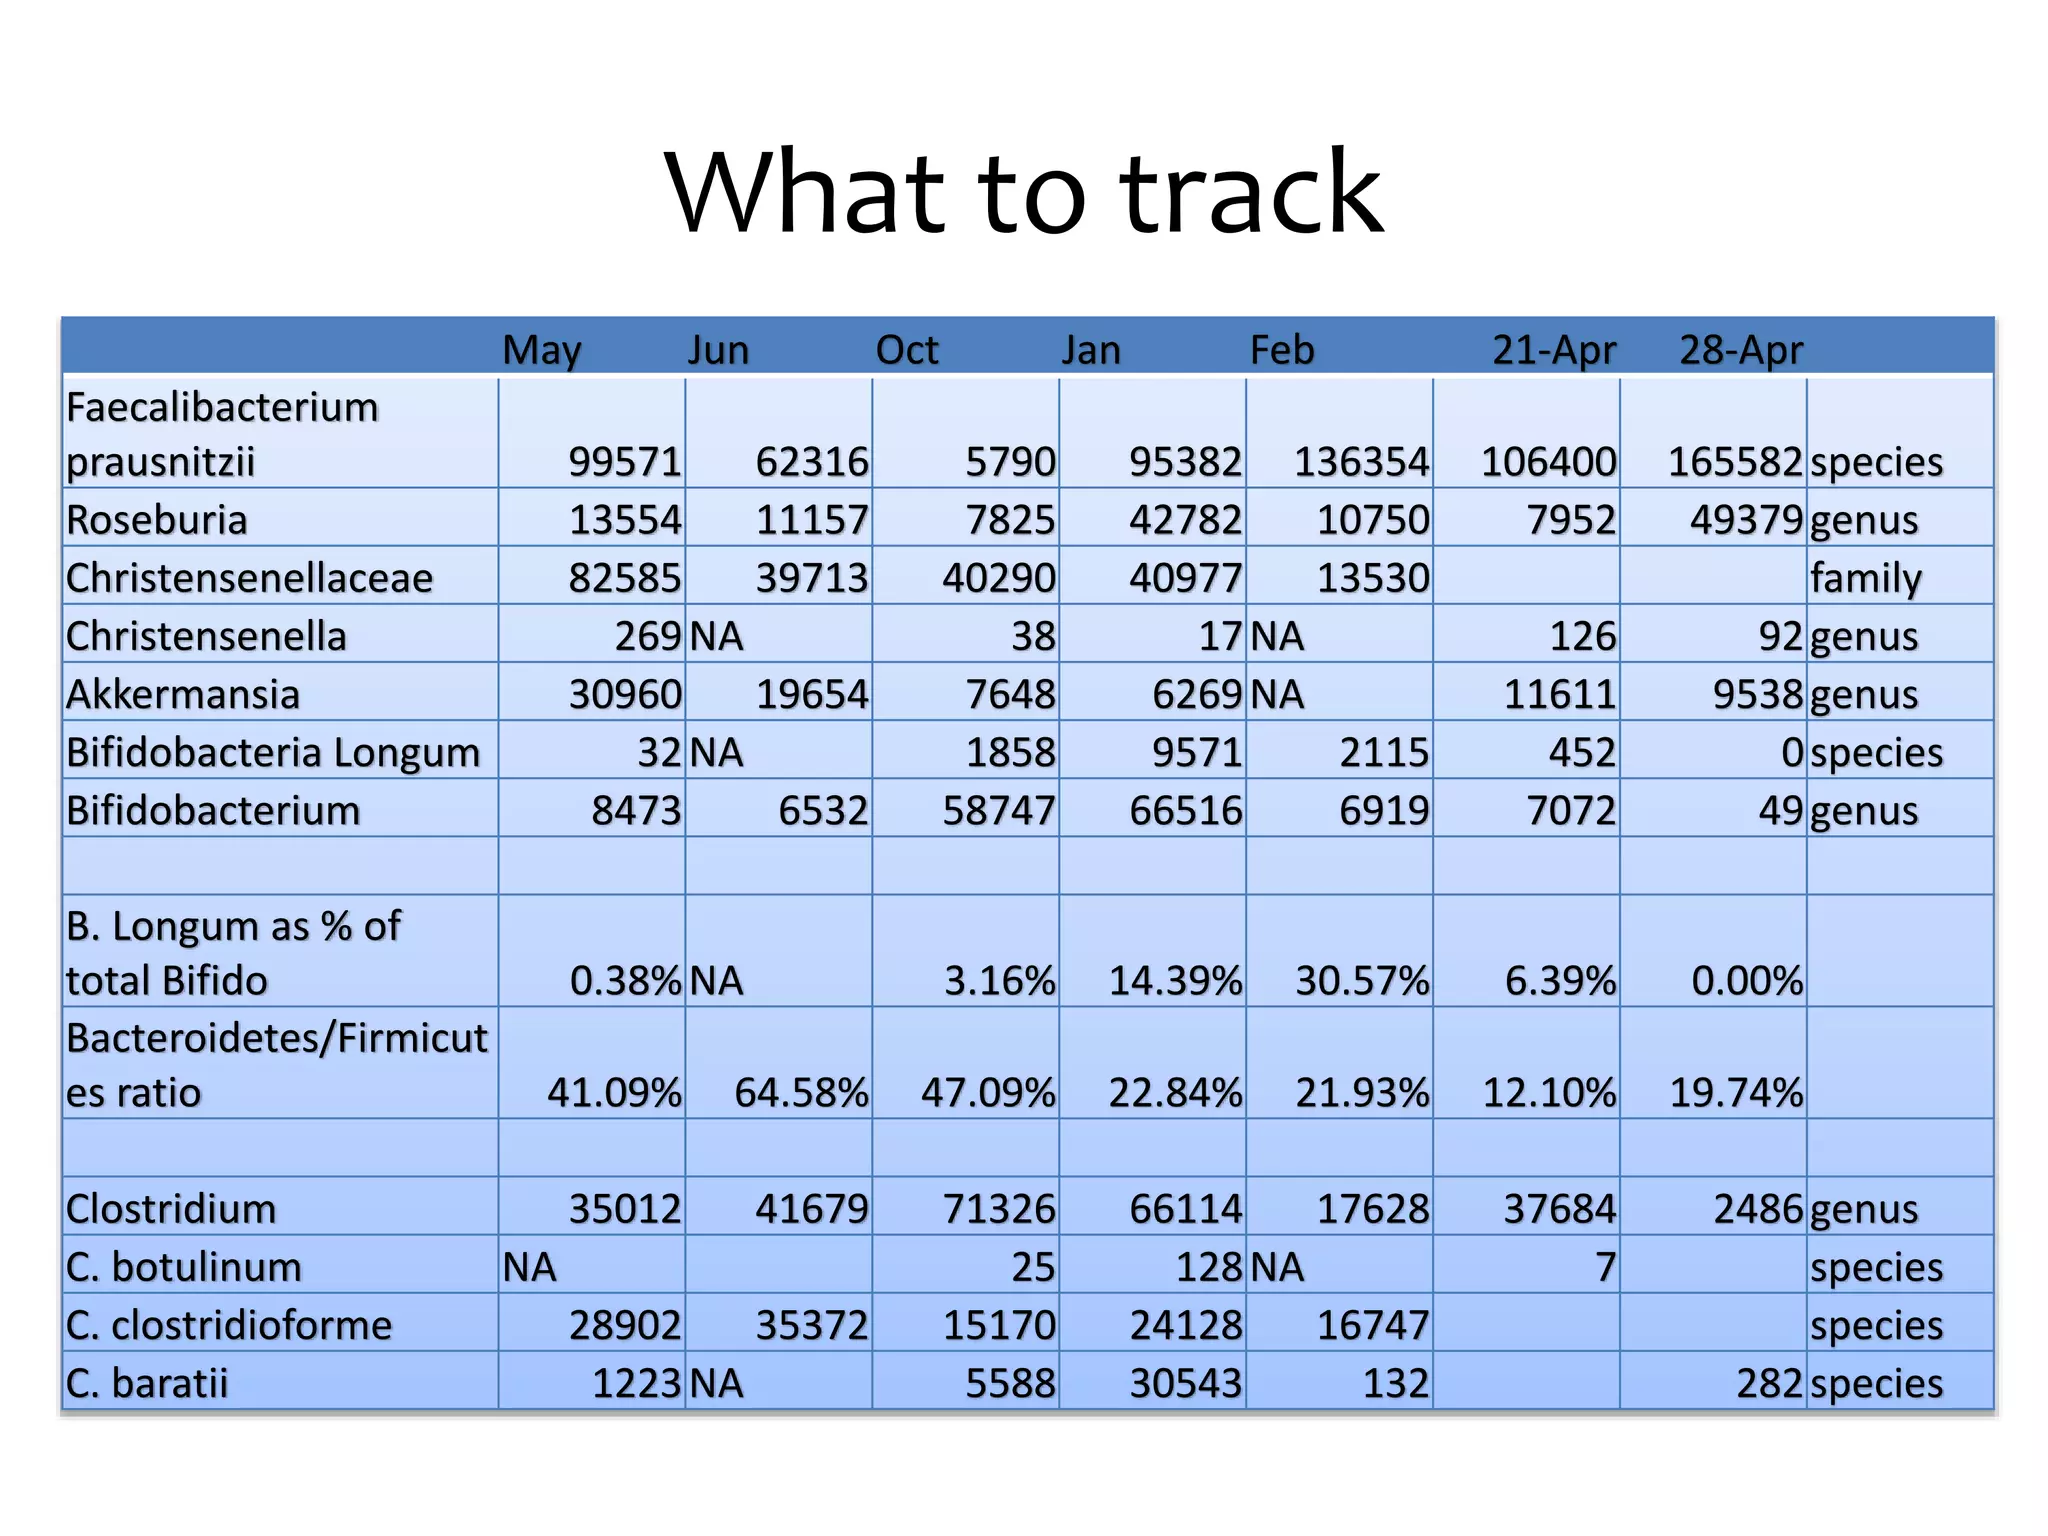

The document summarizes the results of analyzing changes in a person's gut microbiome before and after a 2-week backpacking trip in New Mexico. Some key findings include: - The microbiome was overall pretty stable, with the main bacterial phyla composition not changing much. - Certain genera like Faecalibacterium and Bacteroides decreased after the trip, while Blautia, Odoribacter, and Akkermansia increased. - Microbial diversity was higher after the trip compared to previous tests, suggesting the trip helped diversity.


