Download as PDF, PPTX


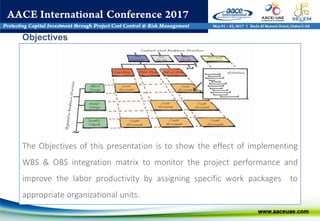
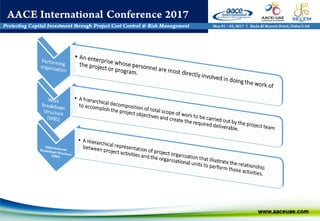
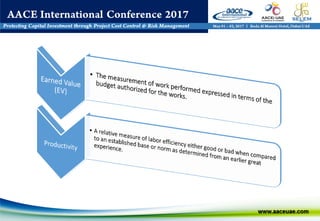
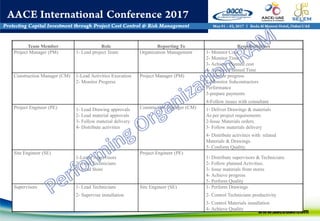
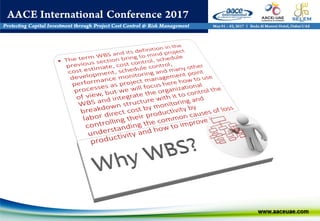

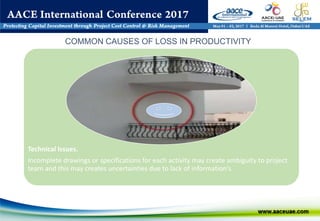
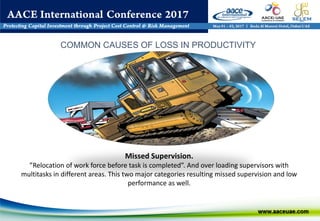

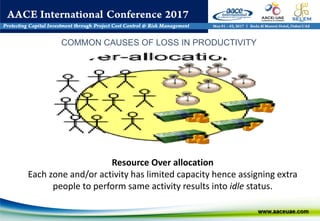
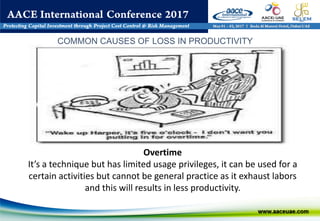


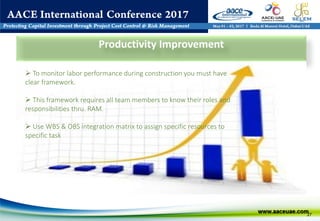
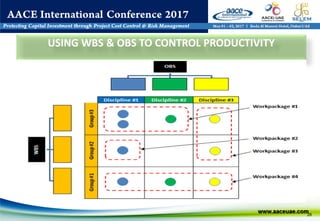
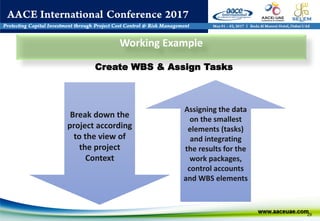
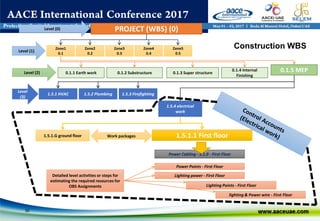
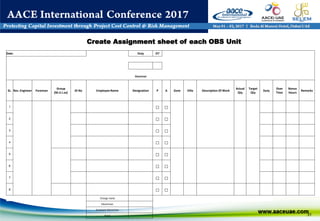
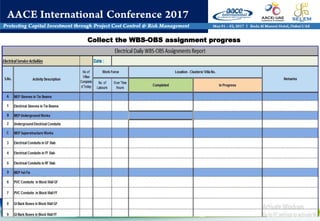
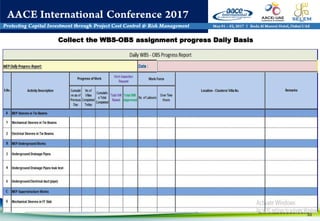
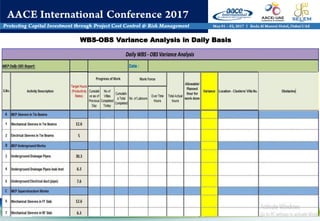
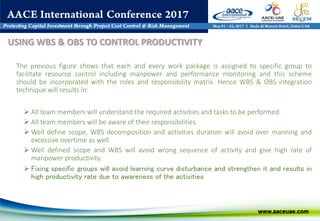

The document discusses using WBS (Work Breakdown Structure) and OBS (Organizational Breakdown Structure) integration to improve labor productivity in construction projects. It outlines common causes of lost productivity such as technical issues, missed supervision, and improper resource distribution. The presentation recommends assigning specific work packages to organizational units using a WBS-OBS matrix to provide clear roles and responsibilities. This approach avoids lost productivity and allows for monitoring of resource usage and performance. An example demonstrates tracking labor assignments and progress to analyze variances. WBS-OBS integration provides a framework for control and improvement of direct labor costs and productivity.


