Downloaded 2,772 times


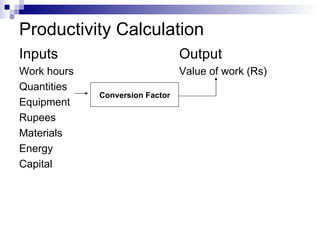
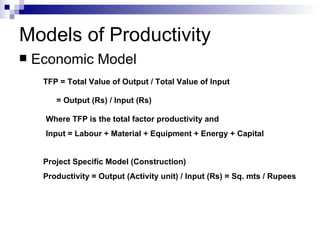
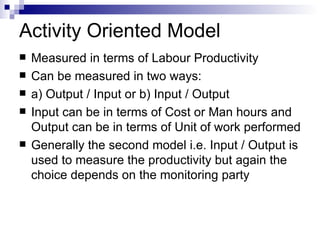
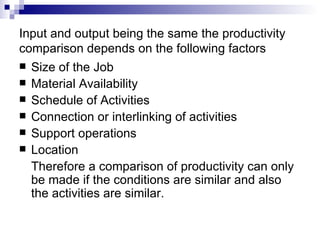
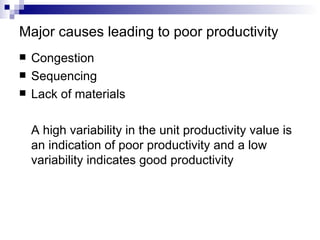


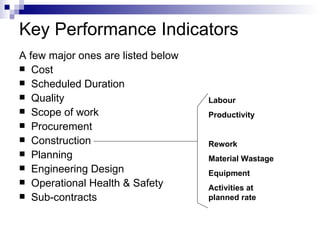

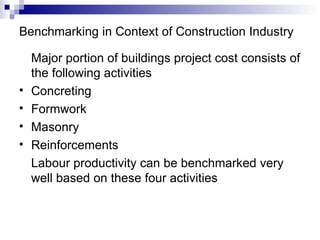
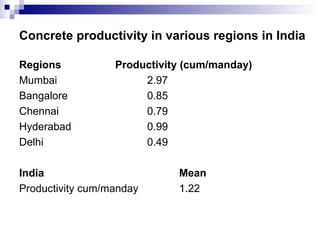
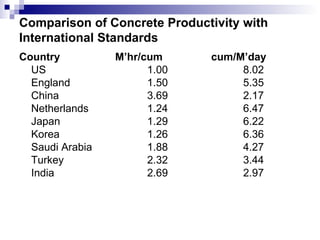

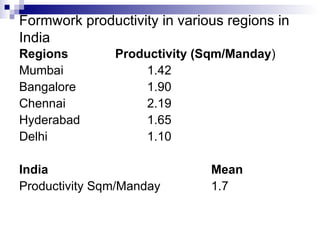
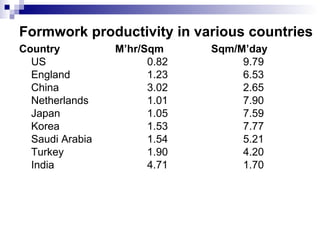

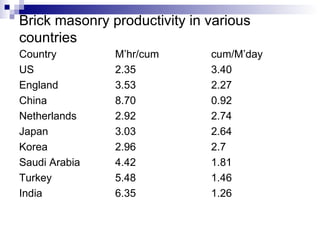

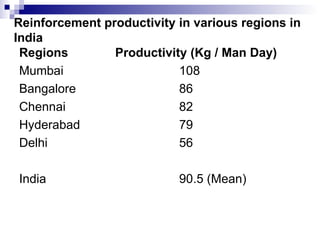


The document discusses construction productivity measurement and benchmarking. It defines productivity and explains why it is important, especially for the construction industry. Some key factors affecting construction labor productivity are identified. The document also discusses quality and its relationship to productivity. Various methods for improving productivity are outlined. Productivity calculation and benchmarking models and their application to the construction industry are explained. Labor productivity studies comparing different regions in India and internationally are summarized.