Downloaded 11 times
![Proceedings of the International Conference on Emerging Trends in Engineering and Management (ICETEM14)
30 – 31, December 2014, Ernakulam, India
93
CONSTRUCTION OF PHYLOGENETIC TREE FROM
MULTIPLE GENE TREES USING PRINCIPAL
COMPONENT ANALYSIS
Anu Sabarish R, Tessamma Thomas
Department of Electronics, Cochin University of Science and Technology, Cochin, India
ABSTRACT
A wide range of methods have been used to study molecular phylogeny to discover the appropriate degree of
relationship within a group of organisms. An approach to construct the phylogenetic tree from multiple gene trees is
presented here. Multiple gene trees corresponding to different proteins, obtained from 15 placental mammals are created.
A principal component analysis based method of inferring a phylogenetic tree from these multiple gene trees is
described. The information thus gathered provide meaningful insights into the pattern and process of evolution which
will show the recency of common ancestry. The result clearly indicates that the species tree generated using the proposed
method is more accurate and consistent compared to the trees that are inferred from a single gene.
Keywords: Correlation, Dendrogram, Distance Matrix, Electron Ion Interaction Potential, Gene Tree, Genomic Signal
Processing, Principal Component Analysis, Phylogenetic Tree, SVD.
1. INTRODUCTION
Genomic signal processing is an interdisciplinary field of representing, analyzing and understanding biological
sequences and images using improved computational techniques that are commonly applied to areas of voice, image and
video processing. It is becoming increasingly important to process the vast amount of data generated by the wide range of
new sequencing techniques. Compared to the conventional approaches, traditional as well as new signal processing
methods can play a significant role in processing this large volume of data. Various pattern recognition, data mining and
machine learning algorithms are developed for processing and understanding the genomic data.
Genome contains the biological information needed to construct and maintain every organism. In most of the
organisms, except a few viruses, the genome is made of deoxyribonucleic acid (DNA) having a double helix structure [1]
with two strands. Each strand consists of a linked chain of nucleotides or nitrogenated bases which are of 4 types-
adenine(A), thymine(T), cytosine(C) and guanine(G). Three adjacent bases in a DNA sequence form a triplet called codon,
each one representing an amino acid. A linear chain of amino acids, starting with the codon ATG, corresponding to the
amino acid methionine, followed by a sequence of amino acids and ending with a stop codon, constitutes a protein. Protein
sequences belonging to the same functional class from different organisms have some sort of sequence similarity that
allows them to perform their common function. This similarity in structure and sequence can be attributed to the fact that
they are derived phylogenetically from a common precursor and evolution process appears to have exerted a considerable
degree of conservatism towards functionally critical residues [2].
Phylogenetics is the study of evolutionary relationship among the different forms of life, both existing and
extinct. In the past, different methods were used for phylogenetic analysis including Paleontological, Morphological and
Embryological studies. Recently, owing to the development of advanced sequencing techniques, molecular phylogenetics
INTERNATIONAL JOURNAL OF ELECTRONICS AND
COMMUNICATION ENGINEERING & TECHNOLOGY (IJECET)
ISSN 0976 – 6464(Print)
ISSN 0976 – 6472(Online)
Volume 5, Issue 12, December (2014), pp. 93-98
© IAEME: http://www.iaeme.com/IJECET.asp
Journal Impact Factor (2014): 7.2836 (Calculated by GISI)
www.jifactor.com
IJECET
© I A E M E](https://image.slidesharecdn.com/constructionofphylogenetictreefrommultiplegenetreesusingprincipalcomponentanalysis-141216082216-conversion-gate01/85/Construction-of-phylogenetic-tree-from-multiple-gene-trees-using-principal-component-analysis-1-320.jpg)
![Proceedings of the International Conference on Emerging Trends in Engineering and Management (ICETEM14)
30 – 31, December 2014, Ernakulam, India
93
CONSTRUCTION OF PHYLOGENETIC TREE FROM
MULTIPLE GENE TREES USING PRINCIPAL
COMPONENT ANALYSIS
Anu Sabarish R, Tessamma Thomas
Department of Electronics, Cochin University of Science and Technology, Cochin, India
ABSTRACT
A wide range of methods have been used to study molecular phylogeny to discover the appropriate degree of
relationship within a group of organisms. An approach to construct the phylogenetic tree from multiple gene trees is
presented here. Multiple gene trees corresponding to different proteins, obtained from 15 placental mammals are created.
A principal component analysis based method of inferring a phylogenetic tree from these multiple gene trees is
described. The information thus gathered provide meaningful insights into the pattern and process of evolution which
will show the recency of common ancestry. The result clearly indicates that the species tree generated using the proposed
method is more accurate and consistent compared to the trees that are inferred from a single gene.
Keywords: Correlation, Dendrogram, Distance Matrix, Electron Ion Interaction Potential, Gene Tree, Genomic Signal
Processing, Principal Component Analysis, Phylogenetic Tree, SVD.
1. INTRODUCTION
Genomic signal processing is an interdisciplinary field of representing, analyzing and understanding biological
sequences and images using improved computational techniques that are commonly applied to areas of voice, image and
video processing. It is becoming increasingly important to process the vast amount of data generated by the wide range of
new sequencing techniques. Compared to the conventional approaches, traditional as well as new signal processing
methods can play a significant role in processing this large volume of data. Various pattern recognition, data mining and
machine learning algorithms are developed for processing and understanding the genomic data.
Genome contains the biological information needed to construct and maintain every organism. In most of the
organisms, except a few viruses, the genome is made of deoxyribonucleic acid (DNA) having a double helix structure [1]
with two strands. Each strand consists of a linked chain of nucleotides or nitrogenated bases which are of 4 types-
adenine(A), thymine(T), cytosine(C) and guanine(G). Three adjacent bases in a DNA sequence form a triplet called codon,
each one representing an amino acid. A linear chain of amino acids, starting with the codon ATG, corresponding to the
amino acid methionine, followed by a sequence of amino acids and ending with a stop codon, constitutes a protein. Protein
sequences belonging to the same functional class from different organisms have some sort of sequence similarity that
allows them to perform their common function. This similarity in structure and sequence can be attributed to the fact that
they are derived phylogenetically from a common precursor and evolution process appears to have exerted a considerable
degree of conservatism towards functionally critical residues [2].
Phylogenetics is the study of evolutionary relationship among the different forms of life, both existing and
extinct. In the past, different methods were used for phylogenetic analysis including Paleontological, Morphological and
Embryological studies. Recently, owing to the development of advanced sequencing techniques, molecular phylogenetics
INTERNATIONAL JOURNAL OF ELECTRONICS AND
COMMUNICATION ENGINEERING & TECHNOLOGY (IJECET)
ISSN 0976 – 6464(Print)
ISSN 0976 – 6472(Online)
Volume 5, Issue 12, December (2014), pp. 93-98
© IAEME: http://www.iaeme.com/IJECET.asp
Journal Impact Factor (2014): 7.2836 (Calculated by GISI)
www.jifactor.com
IJECET
© I A E M E](https://image.slidesharecdn.com/constructionofphylogenetictreefrommultiplegenetreesusingprincipalcomponentanalysis-141216082216-conversion-gate01/75/Construction-of-phylogenetic-tree-from-multiple-gene-trees-using-principal-component-analysis-1-2048.jpg)
![Proceedings of the International Conference on Emerging Trends in Engineering and Management (ICETEM14)
30 – 31, December 2014, Ernakulam, India
94
is widely used which involves the analysis of hereditary molecular differences, mainly in DNA sequences and amino acid
sequences. The pattern of evolutionary relationship among different species is best illustrated by phylogenetic trees. A
relationship topology based on the observation of divergence within a single homologous gene is called a gene tree. An
internal node in a gene tree represents the divergence of an ancestral gene into alleles with different DNA sequences by
mutation. A gene tree represents the evolutionary history of that gene, while the tree based on data from multiple genes is a
species tree. An internal node in a species tree represents a speciation event. The species trees are not exactly same as the
gene trees, as the mutations and speciation events do not occur strictly at the same time, but gene trees are generally an
accurate representation of species trees.
A Molecular Clock Hypothesis was proposed in [3] where, the accumulation of amino acid changes was
compared to steady ticking of a clock and the substitution rates were expected to remain constant within homologous
protein over a large period of time. Thus the number of differences between two homologous proteins can be well
correlated to the amount of time since speciation caused them to diverge independently. And this will facilitate to
decipher the phylogenetic relationship between different species and also the time of their divergence. As the genomes
evolve by gradual accumulation of mutations, the amount of difference in nucleotide sequence between a pair of
genomes indicates the recency of common ancestor. In [2] it is demonstrated that the number of variant residues gives an
approximation of the evolutionary distance between two species and their time of divergence. The evolutionary distance
between all pairs of sequences, obtained from the corresponding nucleotide difference is represented as the distance
matrix. Then a representation in the form of a tree is generated from this distance matrix using Unweighted Pair Group
Method with Arithmetic average (UPGMA) algorithm.
In this work, a computational technique based on direct protein sequence correlation described in [4] is used to
analyse the phylogenetic relationship between different species. From a group of organisms, a sample set of proteins are
selected. For processing, the alphabetical amino acid sequence has to be converted into a numerical form. Individual
gene trees are constructed based on each of these sequences. Then a method based on principal component analysis for
combining the information gained from the individual gene trees to infer a phylogenetic tree is proposed. Using the
method, phylogenetic tree for two set of organisms are constructed and compared.
The paper is organized as follows. The method for representing protein sequence data in numerical form is
mentioned in section 2. Section 3 describes a method of constructing phylogenetic tree using sequence correlation, the
theory of principal component analysis and its application in inferring phylogenetic tree from gene trees. Section 4
describes the details of implementation and finally the results are discussed in section 5.
2. NUMERICAL REPRESENTATION OF AMINO ACID SEQUENCES
Most of the identified protein sequence data is available freely over the web at various online databases, one of
which is the Entrez search and retrieval system of the National Center for Biotechnology Information [5]. The protein
sequences obtained from these sources are often in the form of a sequence of characters, each representing a distinct
amino acid, which has to be converted into numerical form for further processing. Various methods have been used in
literature for numerical mapping [6] [7] [8] [9] [10] [11] [12].
A comparison of the informational capacity of various physicochemical, thermodynamic, structural and
statistical parameters of amino acids are performed in [9] and it is shown that Electron Ion Interaction Potential (EIIP) is
the most suitable known amino acid property that can be used in structure-function analysis of proteins. The EIIP values
for amino acids and nucleotides are calculated using the general model of pseudo potential described in [13]:
πµ
µπβα
2
)2sin()( 0 ZZZ
kwqk
−
=+
rrr
(1)
where, q is the change in momentum of delocalized electron in the interaction with the potential w, Z is the atomic
number, Z0 is the atomic number of the inert element that begins the period which includes the actual Z in the standard
periodic table, and
FK
q
2
=µ (2)
where, q is a wave number and KF the corresponding Fermi momentum.
)(
)(
3
2
0ZZ
E ZF
Z
−
=
α
β (3)
where ZFE )( is the corresponding Fermi energy.](https://image.slidesharecdn.com/constructionofphylogenetictreefrommultiplegenetreesusingprincipalcomponentanalysis-141216082216-conversion-gate01/85/Construction-of-phylogenetic-tree-from-multiple-gene-trees-using-principal-component-analysis-2-320.jpg)
![Proceedings of the International Conference on Emerging Trends in Engineering and Management (ICETEM14)
30 – 31, December 2014, Ernakulam, India
95
The EIIP values of the 20 amino acids that form the linear polypeptide chain of each protein sequence are
obtained from [14]. We can obtain a numerical sequence by substituting the EIIP value of each amino acid for the
corresponding alphabetic letter in protein sequence. In this work EIIP value is used for the transformation of protein
sequences into numerical form.
3. METHODOLOGY
3.1 Phylogenetic analysis using sequence correlation
In this method, the numerical form of amino acid sequence is subjected to cross correlation with other
homologous sequences. The correlation function is a measure of similarity between two functions which is normalized
such that its magnitude is always less than 1. The correlation coefficient R(i) is calculated as follows,
∑ ∑
∑
− −
−
×
−
=
1
0
1
0
22
1
0
)()(
)()(
)(
N N
N
nYnX
inXnY
iR (4)
where, X[n] and Y[n] are the two sequences and i represents the shift. The maximum value of R(i), denoted by Cxy, is
taken as the measure of similarity between the two sequences X and Y. The correlation Cxy thus obtained is then converted
to the corresponding distance parameter (Dxy) using the relation given below.
Dxy = 1- Cxy (5)
where 0 ≤ Dxy ≤ 1. All the pair wise sequence correlation is found and pair wise distance is calculated. A distance matrix
is thus formed which is used for gene tree construction using UPGMA method.
3.2 Principal component analysis
Principal component analysis (PCA) is a dimensionality reduction technique which transforms high dimensional
data to a lower dimensional subspace. PCA is an orthogonal transformation that transforms a data set with correlated
variables into a smaller uncorrelated set of variables with less redundancy while retaining most of the useful information.
The first principal component (PC) represents the direction of highest variance; the second PC represents the direction
that maximises the remaining variance in the orthogonal subspace to the first component. This can be extended up to the
adequate number of PC’s required to represent the system in an optimal way.
The PCA can be considered as a linear transformation, P that transforms X into Y. Here X represents the original
data set and Y represents the new data set which is the projection of X on principal components. Both X and Y are p x q
matrices where p is the number of variables and q is the number of observations or samples. In order to quantify the
redundancy in the variable a covariance function Cx is defined as,
ܥ௫ =
ଵ
ିଵ
்ܺܺ
(6)
where Cx is an p x p matrix with diagonal elements representing the variance of each variables and the off diagonal
elements represent the covariance between the variables. The optimized data set without redundancy must have a
covariance matrix with all off diagonal elements as zero. Hence the transformation matrix P should be selected such that
Cy is diagonalized. One method is to calculate the eigen vectors of Cx and forming a transformation matrix P with the
eigen vectors as its rows. The eigen vectors also represent the PC’s of the original data set X where the significance of
PC’s is given by the corresponding eigen values. The first PC is the eigen vector with the largest eigen value and so on.
The principal components can also be obtained by using singular value decomposition (SVD). The SVD of an p x
q matrix X is represented by,
்ܺ
≝ ்ܷܸܵ
(7)
Here the columns of V are equivalent to the eigen vectors obtained from the covariance matrix Cx and are the
principal components of X. The number of PC’s extracted is same as the number of variables in original data. To achieve
dimensionality reduction the first few meaningful components are retained.
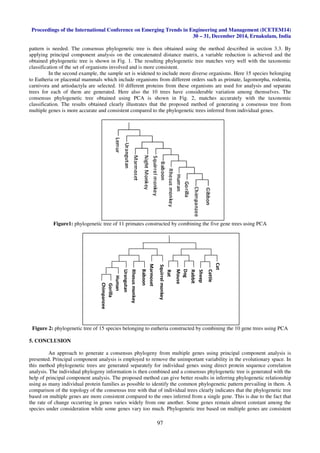
3.3 Inferring phylogenetic tree from multiple gene trees using PCA
Multiple gene trees are generated using the method described above. Using the correlation method separate
distance matrices (Di) having all pair wise distance are obtained for each of the N genes.](https://image.slidesharecdn.com/constructionofphylogenetictreefrommultiplegenetreesusingprincipalcomponentanalysis-141216082216-conversion-gate01/85/Construction-of-phylogenetic-tree-from-multiple-gene-trees-using-principal-component-analysis-3-320.jpg)
![Proceedings of the International Conference on Emerging Trends in Engineering and Management (ICETEM14)
30 – 31, December 2014, Ernakulam, India
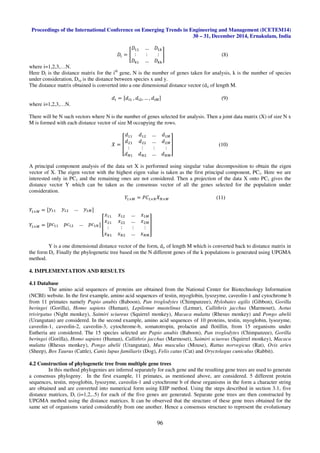
98
compared to the ones inferred from a single gene, as different rate of changes of sequences of different genes can lead to
inconsistent topology of relationship. The proposed approach can also be used to generate a consensus phylogenetic tree
from a group of phylogenetic trees generated using different approaches.
REFERENCES
[1] J.D. Watson and F.H.C. Crick, A structure for DNA, Nature, Vol. 171, 737-738, 1953.
[2] E. Margoliash, Primary structure and evolution of cytochrome c, Proceedings of the National academy of
sciences of the USA, Vol. 50, 672-679, 1963.
[3] E. Zuckerkandl, and L.B. Pauling, Molecular disease, evolution and genetic heterogeneity, Horizons in
Biochemistry, Academic Press, New York, 189–225, 1962.
[4] A.R. Sabarish, and T. Thomas, Molecular phylogeny analysis using correlation distance and spectral distance,
Int. J. Data Mining and Bioinformatics, Vol. 10, No. 4, 391-406, 2014.
[5] National Center for Biotechnology Information. [online] Available at http://www.ncbi.nlm.nih.gov/ (Accessed
15 October 2013).
[6] K.H. Chu, J. Qi, Z.G. Yu, and V.Anh, Origin and phylogeny of chloroplasts revealed by a simple correlation
analysis of complete genomes, Molecular Biology and Evolution, Vol. 21, No. 1, 200–206, 2004.
[7] I. Cosic, and E. Pirogova, Application of ionization constant of amino acids for protein signal analysis within
the resonant recognition model, Proceedings of the 20th Annual International Conference of the IEEE
Engineering in Medicine and Biology Society, Vol. 20, No 2, 1072-1075, 1998.
[8] J.A. Glazier, S. Raghavachari, C.L. Berthelsen, and M.H. Skolnick, Reconstructing phylogeny from the
multifractal spectrum of mitochondrial DNA, Physical Review Letters, Vol. 51, No. 3, 2665-2668, 1995.
[9] L. Lazovic, Selection of amino acid parameters for fourier transform-based analysis of proteins, CABIOS
Communication, Vol. 12, No. 6, 553-562, 1996.
[10] L. Marsella, F. Sirocco, A. Trovato, F. Seno, and S.C.E. Tosatto, REPETITA: detection and discrimination of
the periodicity of protein solenoid repeats by discrete Fourier transform, Bioinformatics, Vol.25, 285-295, 2009.
[11] A.R. Sabarish, and T. Thomas, A Frequency domain approach to protein sequence similarity analysis and
functional classification, Signal & Image processing : An International Journal, Vol.2, No.1, 36-49, 2011.
[12] P.P. Vaidyanathan, Genomics and proteomics: A signal processor’s tour, IEEE Circuits and Systems Magazine,
Vol. 4, 6-29, 2005.
[13] V. Veljkovic, and I. Slavic, Simple General-Model Pseudopotential, Physical Review Letters, Vol. 29, No.2,
105-107, 1972.
[14] I. Cosic, Macromolecular Bioactivity: Is it resonant interaction between macromolecules?- Theory and
applications, IEEE Transactions on biomedical engineering, Vol. 41, No. 12, 1101-1114, 1994.
[15] Shashikant S. Patil, Sachin A Sonawane, Nischay Upadhyay and Aanchal Srivastava, “Compressive Assessment
of Bioinformatics in Biomedical Imaging and Image Processing”, International Journal of Computer
Engineering & Technology (IJCET), Volume 5, Issue 4, 2014, pp. 175 - 185, ISSN Print: 0976 – 6367,
ISSN Online: 0976 – 6375.](https://image.slidesharecdn.com/constructionofphylogenetictreefrommultiplegenetreesusingprincipalcomponentanalysis-141216082216-conversion-gate01/85/Construction-of-phylogenetic-tree-from-multiple-gene-trees-using-principal-component-analysis-6-320.jpg)

This document describes a method for constructing a phylogenetic tree from multiple gene trees using principal component analysis. Multiple gene trees are generated from different protein sequences from various organisms. Distance matrices are calculated for each gene tree and combined into a single data matrix. Principal component analysis is performed on the data matrix to extract the first principal component, which represents the consensus distance vector combining information from all gene trees. A phylogenetic tree is then generated from the consensus distance vector using UPGMA, providing a species tree that integrates information from multiple genes. The method is demonstrated on protein sequence data from primates and placental mammals.