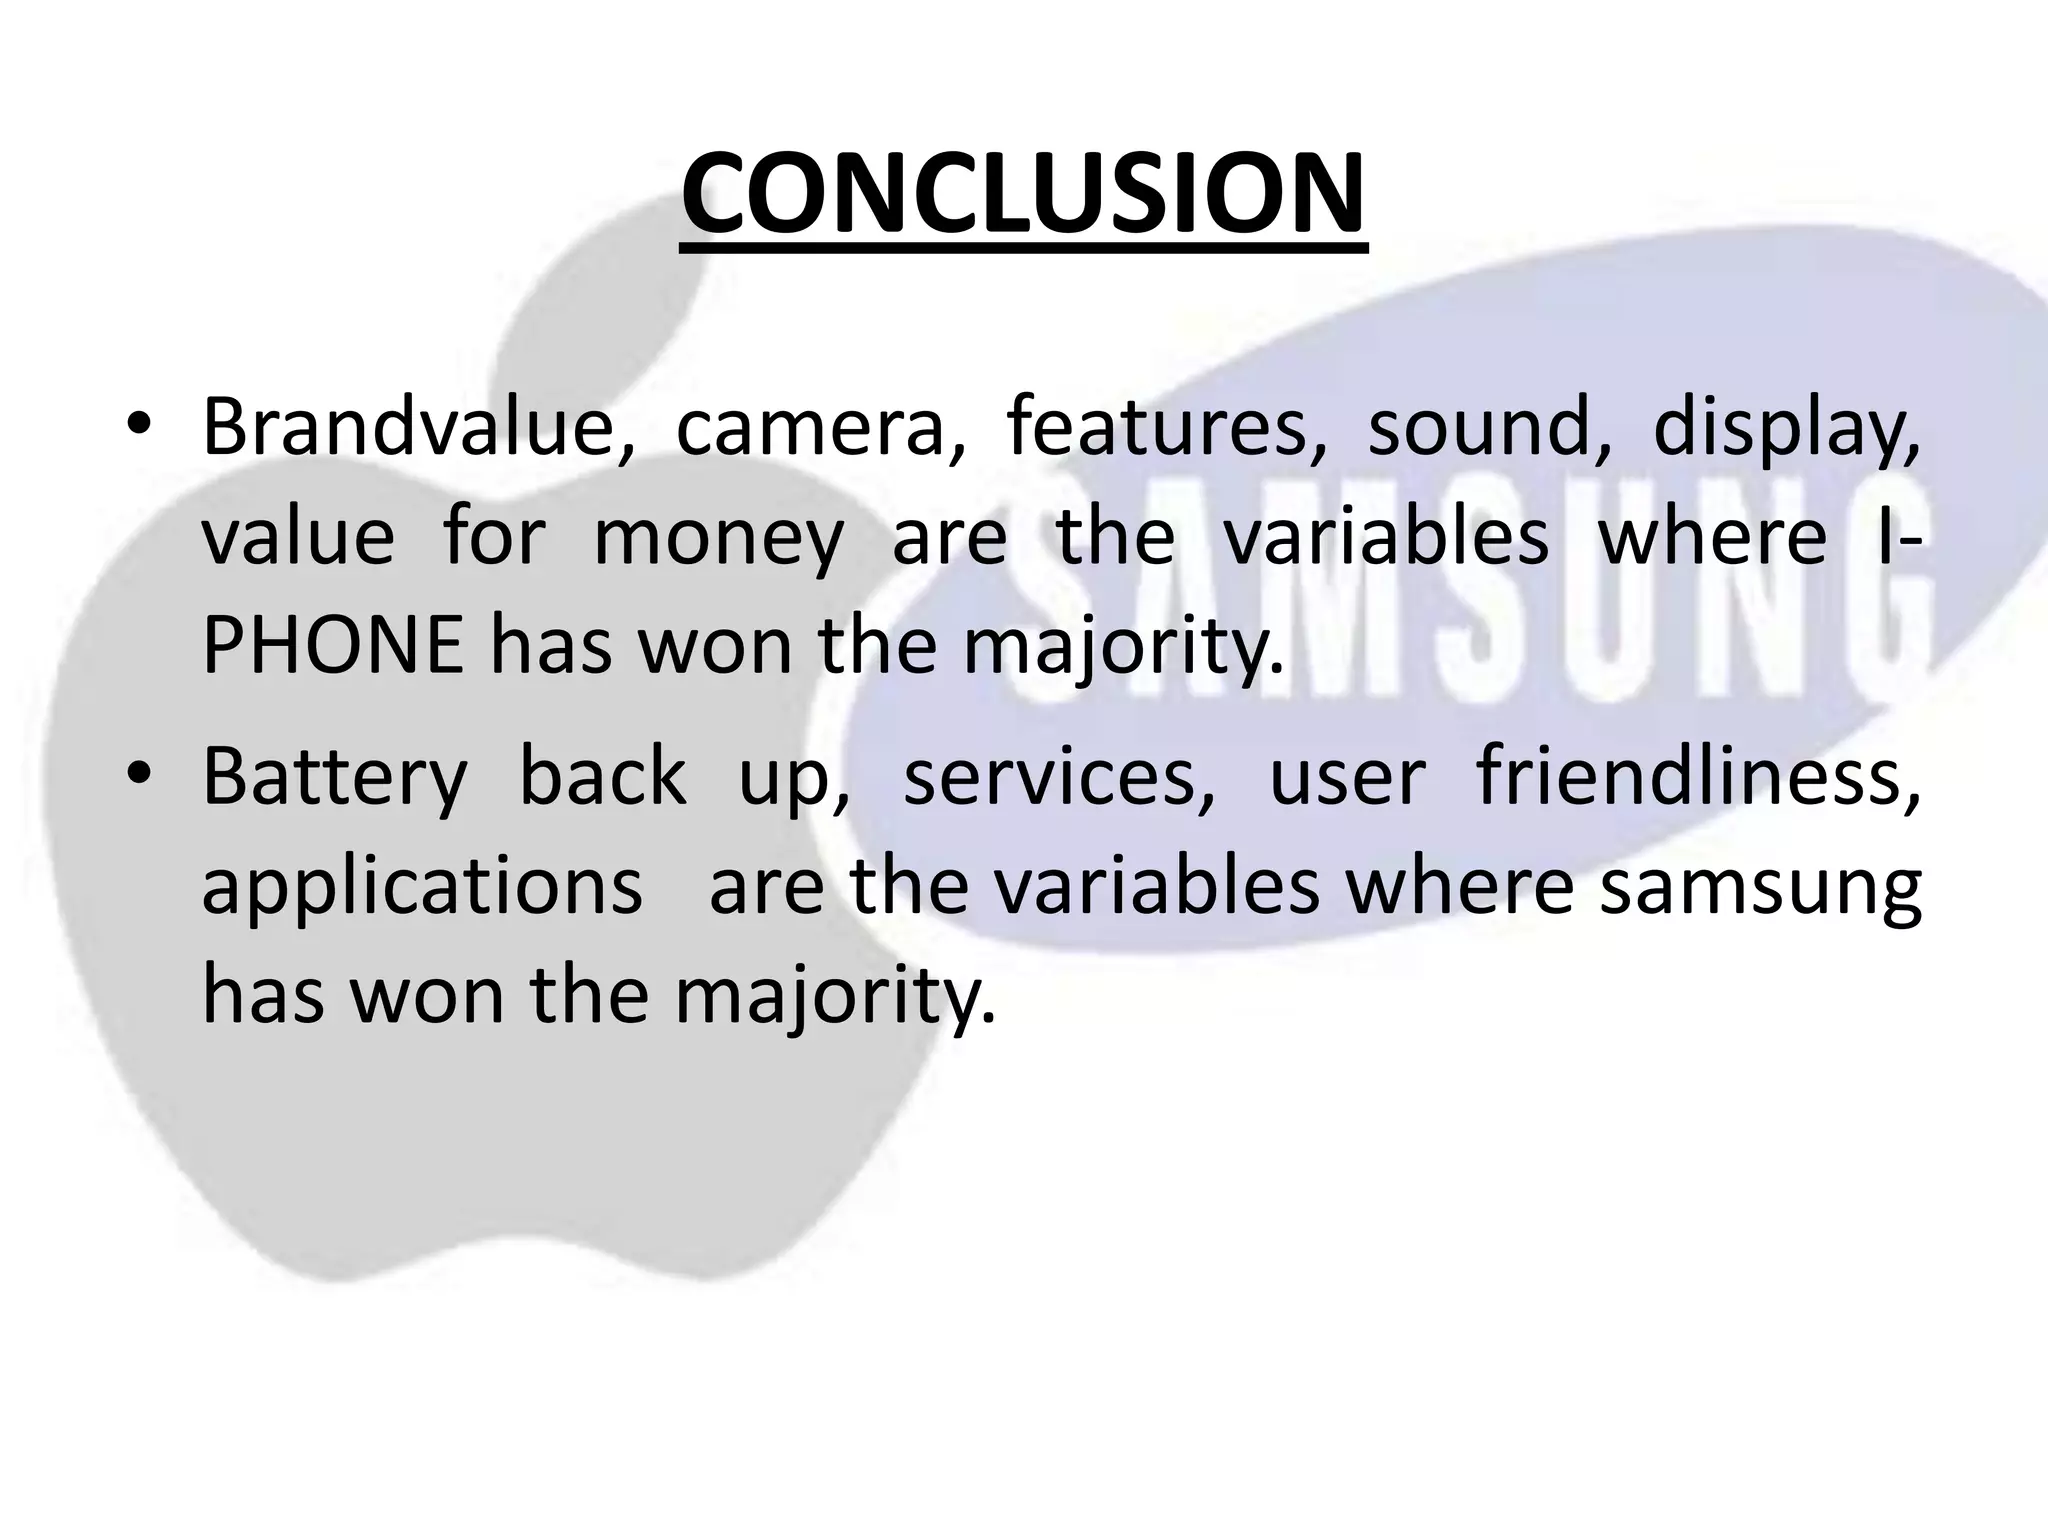
This document compares various variables of Samsung and Apple/i-Phone using statistical measures. It calculates the mean, mode, median, standard deviation, skewness, and correlation for metrics like brand value, camera, features, display, sound, applications, services, user friendliness, battery life and value for money. Hypothesis testing using z-test and chi-square test show significant differences in brand value but not value for money between the two companies. In conclusion, i-Phone performs better in areas like brand value, camera, features, sound and display while Samsung leads in battery life, services and applications.

![MODE
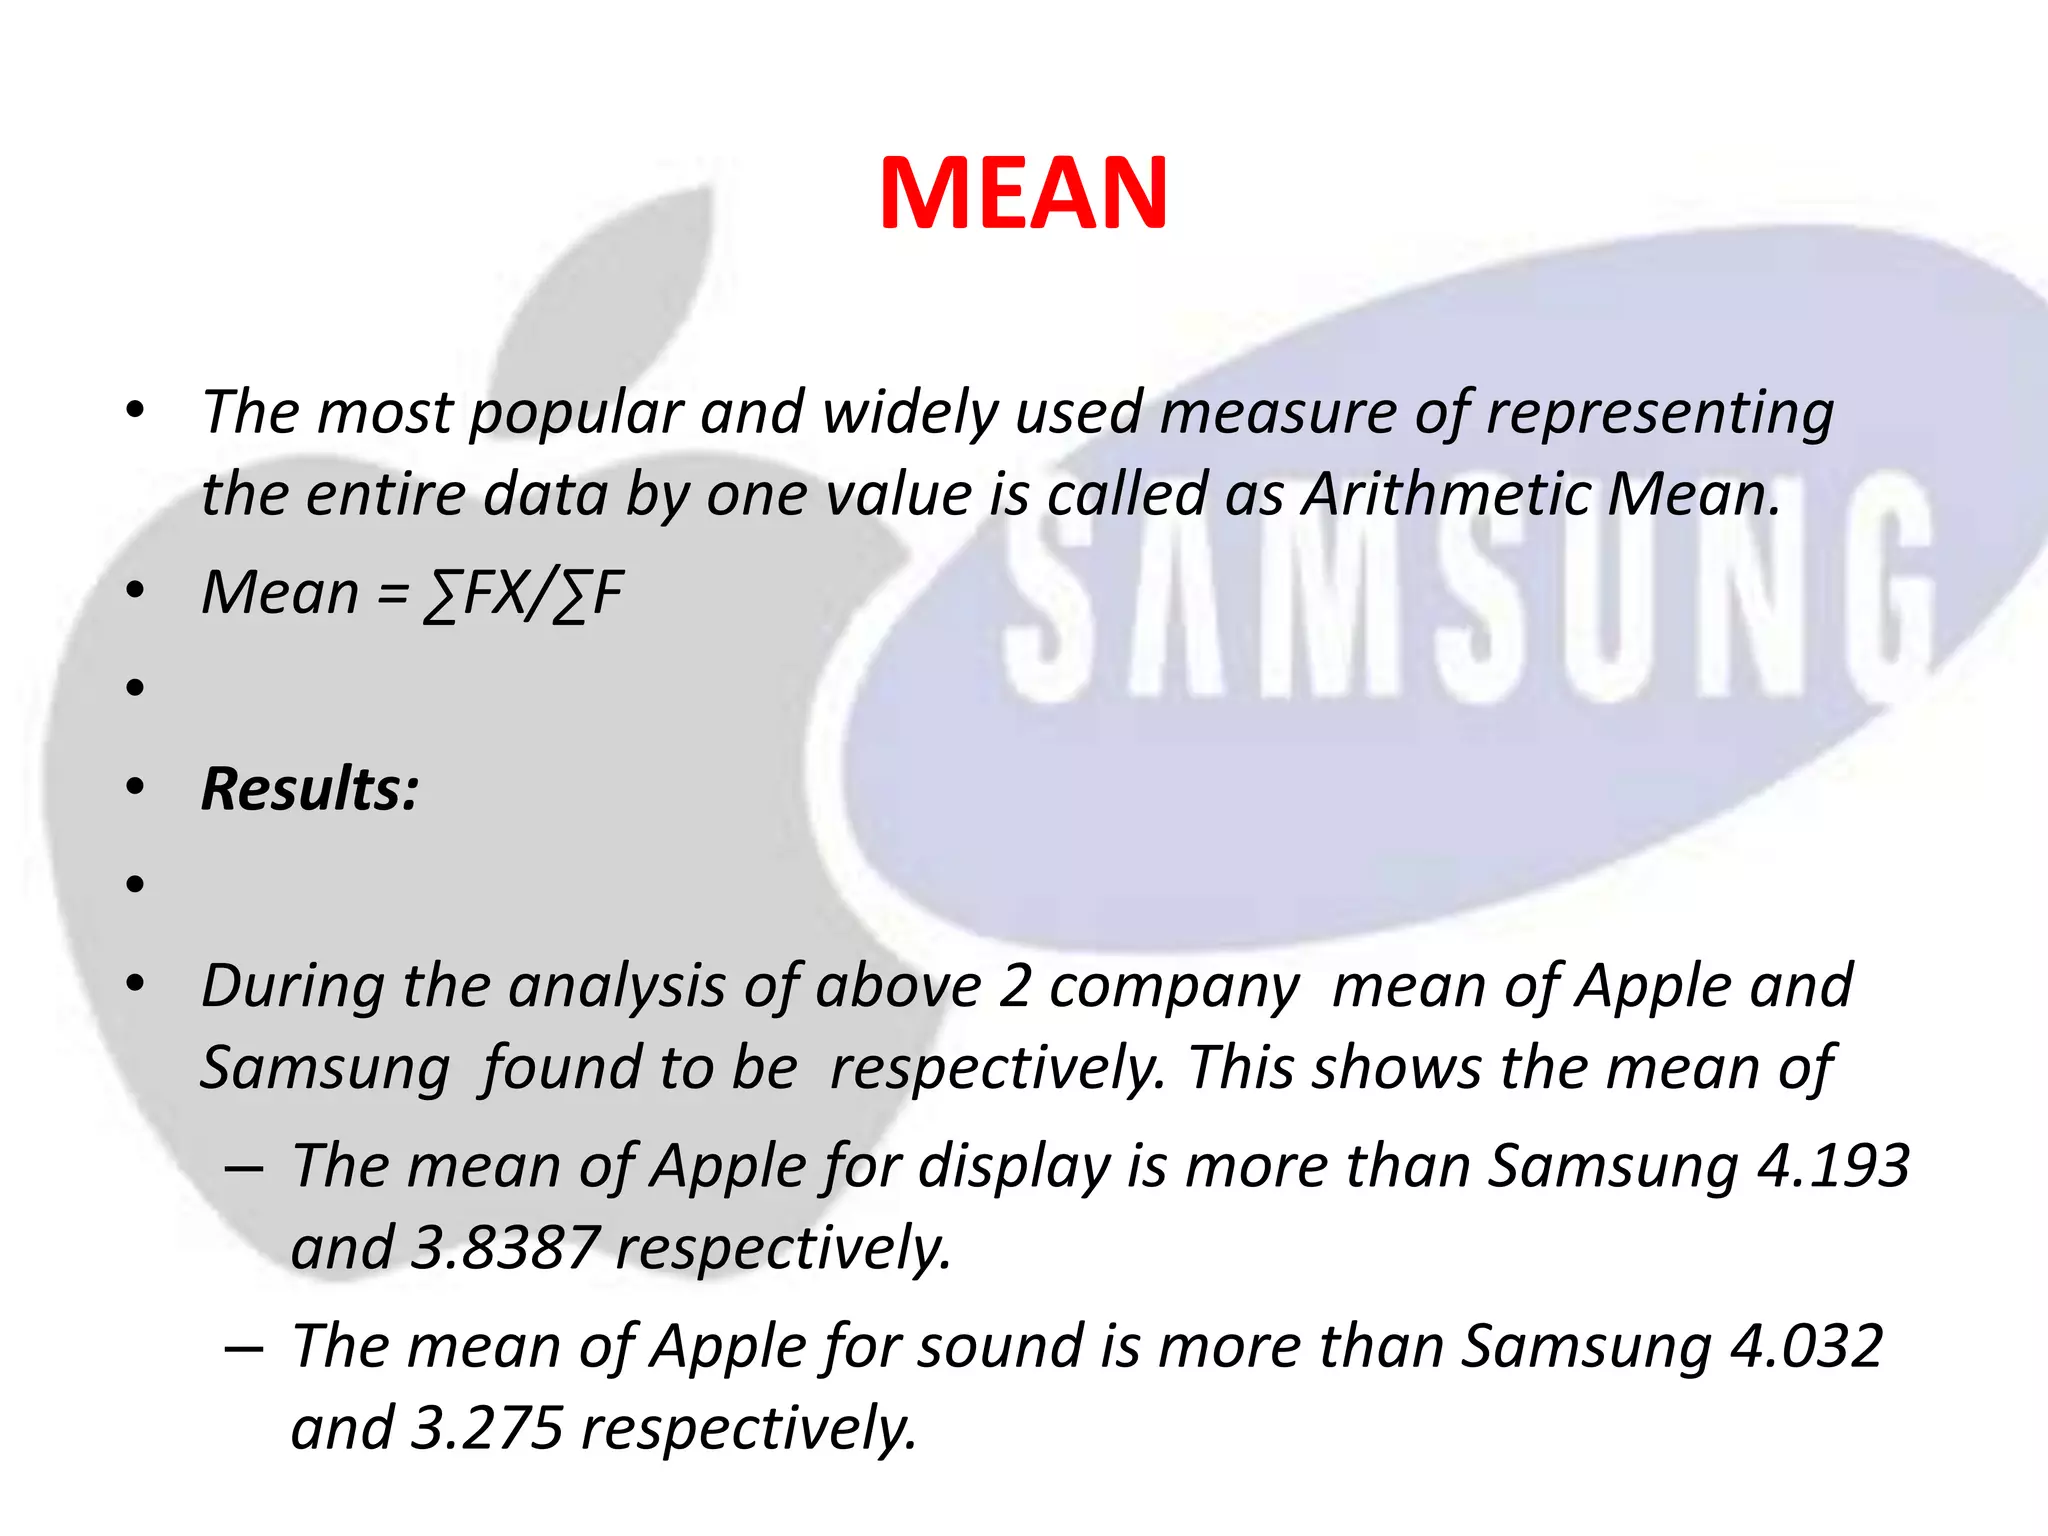
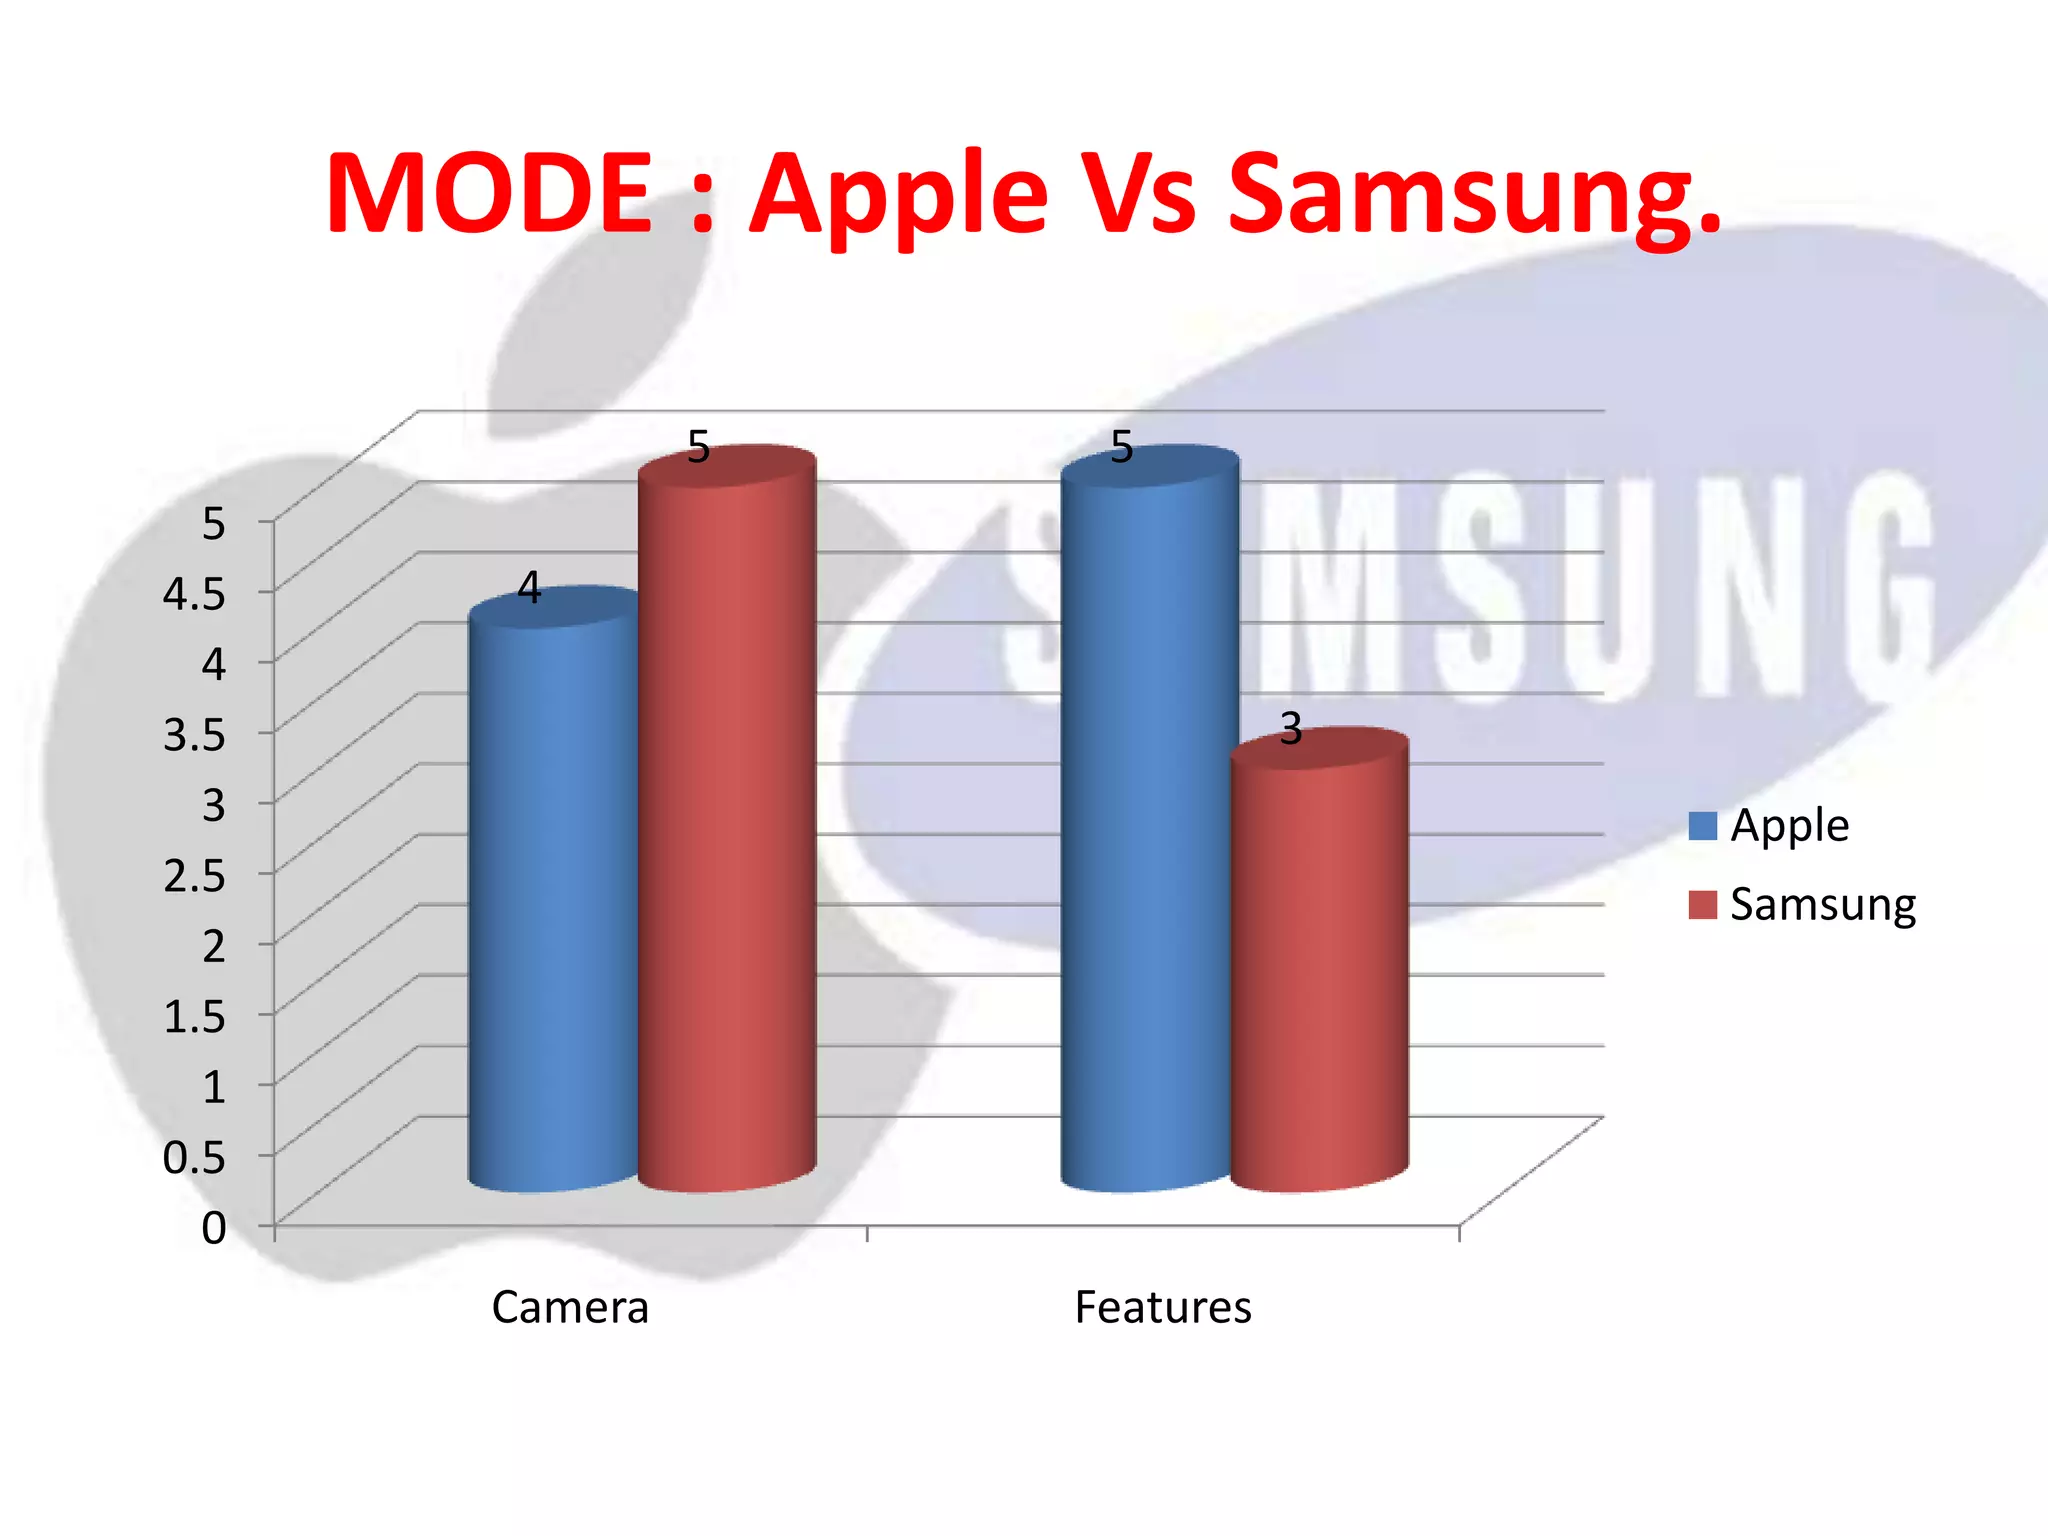
• Mode is defined as the value which occurs maximum number of time i.e. which has
maximum frequency .It is calculated as:
• Mode = L+ *{Δ1/(Δ1+Δ2)}×i]
Where,
L=Lower limit of the class interval of mode class
Δ1=Diff b/w frequency of modal class and frequency of premodal class
Δ2=Diff b/w frequency of modal class and frequency of postmodal class
i= Class Interval
• Results:
• During the analysis of above 2 company , mode of Apple and Samsung shows
• In matter of camera, mode of Samsung is more than Apple 5 and 4 respectively.
• In matter of features, mode of Apple is more than Samsung 5 and 3 respectively.](https://image.slidesharecdn.com/finalstats-140328060953-phpapp02/75/comparison-between-samsung-and-i-phone-using-statistical-measures-9-2048.jpg)
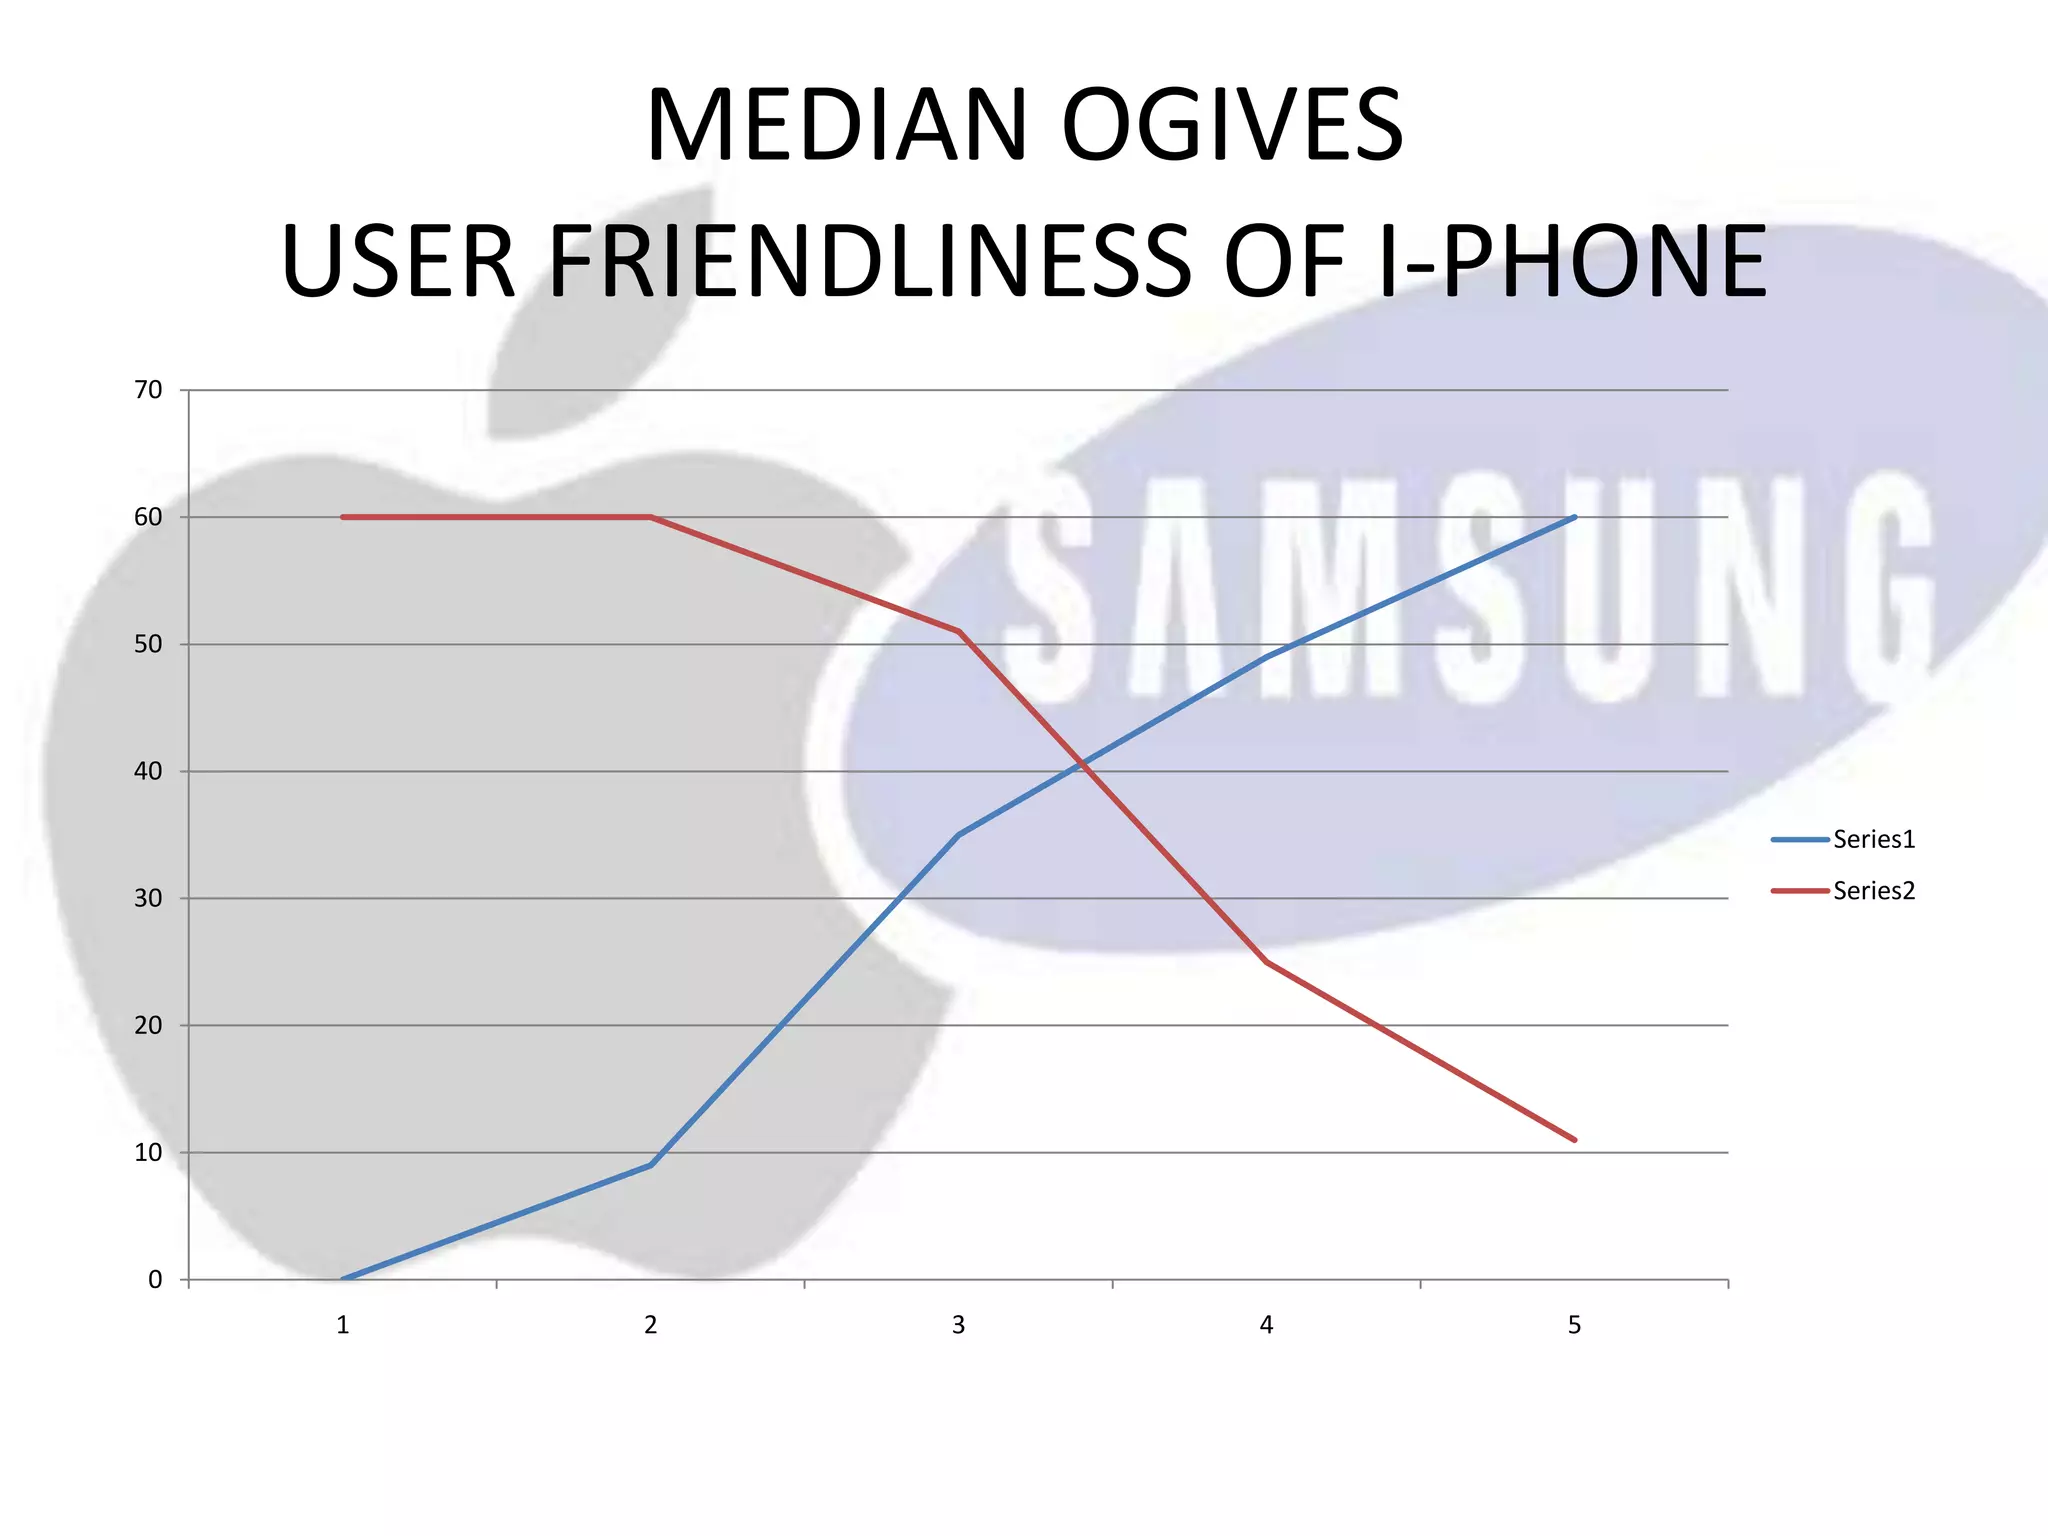
![MEDIAN
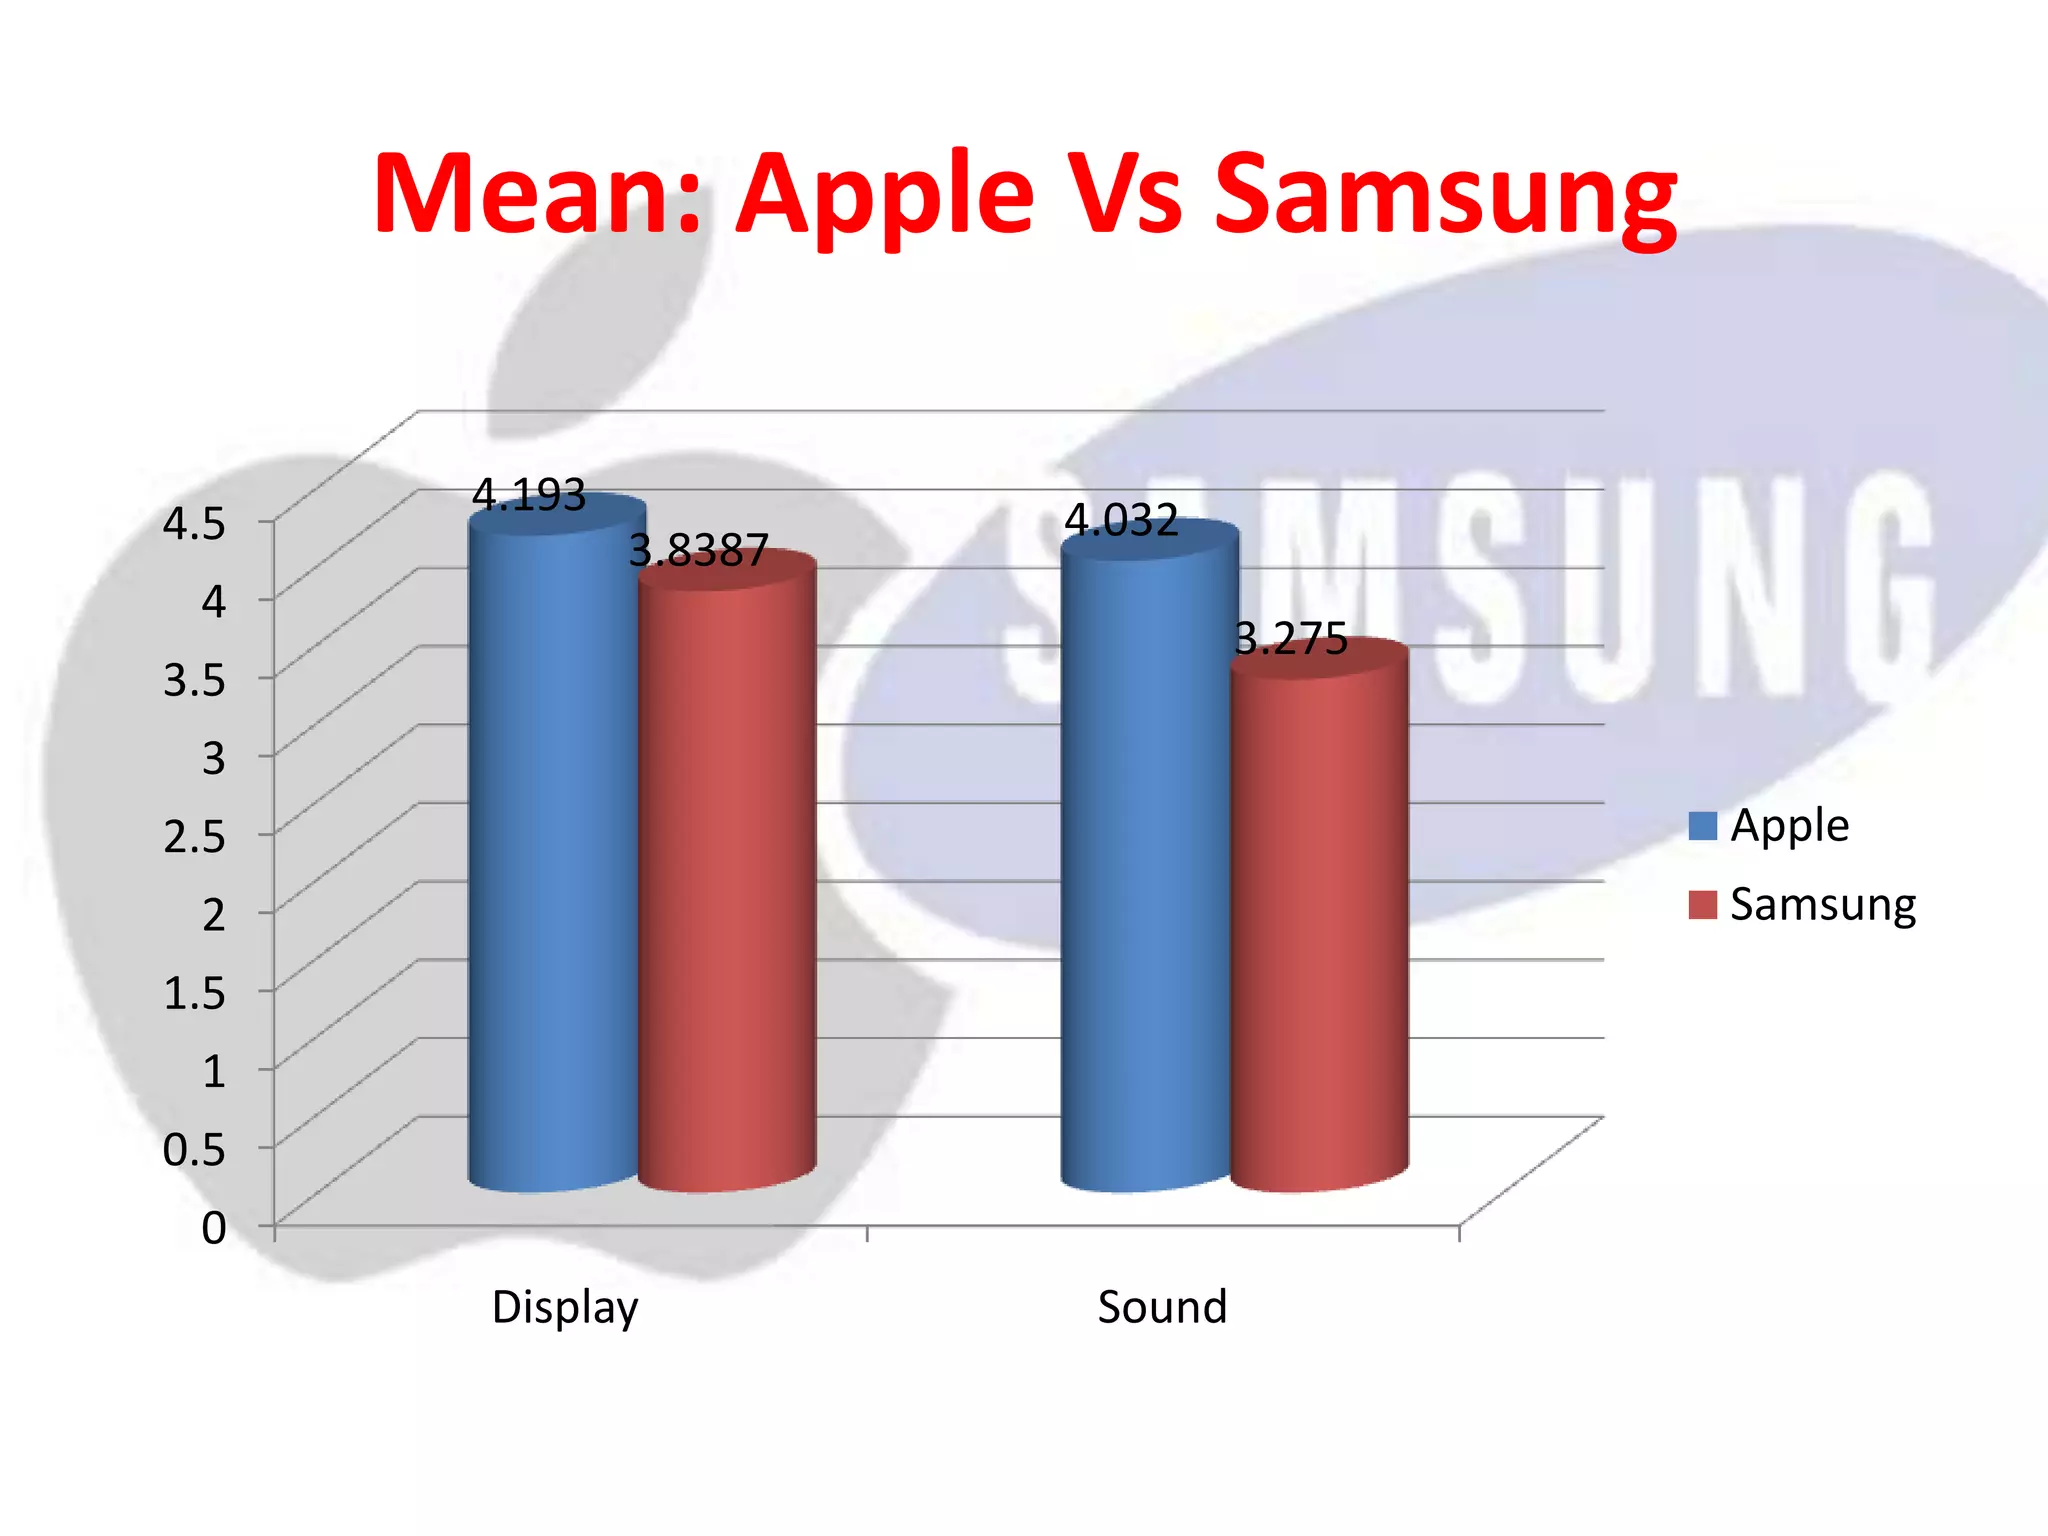
• It is a measure of central tendency which appears in the middle of order sequence of values i.e. half
of the observation in the set of the data are lower and half are greater than it .Hence median is
called as ‘Positional Average’ .It is calculated as
•
• N/2 - Locate the median Class = Median Position
•
• Median = L+ [{(N/2 – P.C.F)/F}×i]
• Where,
L=Lower limit of the class interval of median class
P.C.F=Preceding Cumulative Frequency
F=Frequency of median class
i =class interval
• Results:
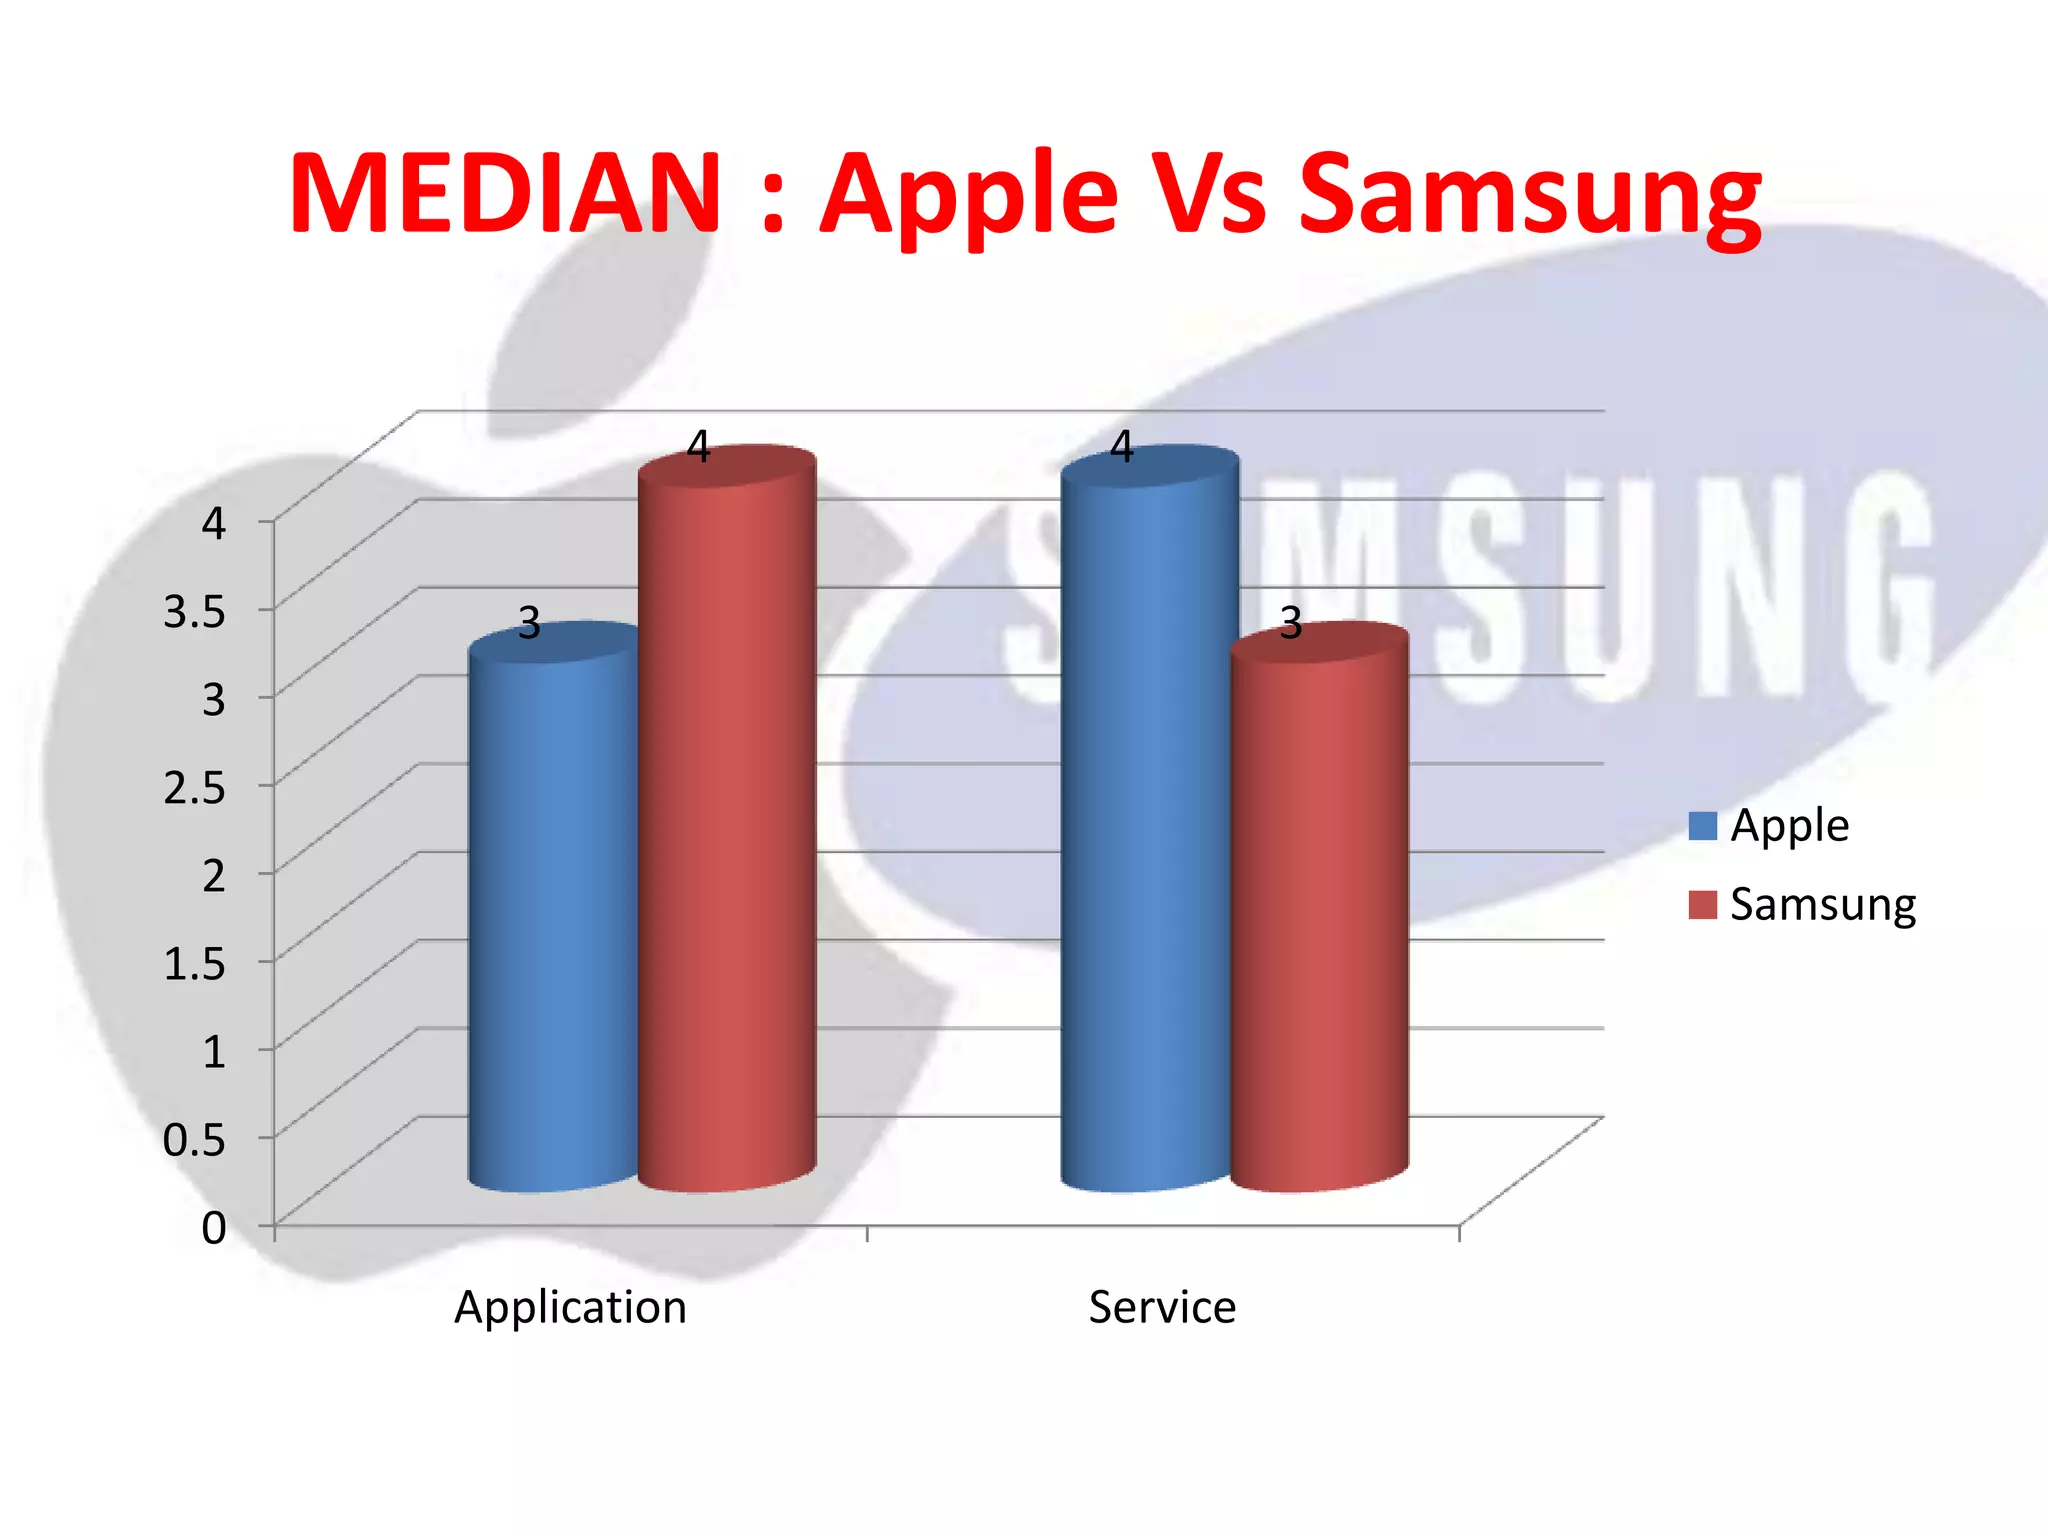
• During the analysis of above 2 company median of Apple and Samsung shows.
• In matter of applications of both phones Samsung is more than Apple 3 and 4 respectively.
• In matter of service of both phones Apple is more than Samsung 4 and 3 respectively.](https://image.slidesharecdn.com/finalstats-140328060953-phpapp02/75/comparison-between-samsung-and-i-phone-using-statistical-measures-10-2048.jpg)


![[DSC Europe 25] Bogdan Daniel Maruneac - AI - It starts with you.pptx](https://cdn.slidesharecdn.com/ss_thumbnails/odov3snhrcqs9hx5ny2n-4-251205085715-f1daacfe-thumbnail.jpg?width=640&height=640&fit=bounds)
![[DSC Europe 25] Dragan Vucic - Building the Learning Organization - How AI Tr...](https://cdn.slidesharecdn.com/ss_thumbnails/8brigo2sbu6qur6gxrra-7-251205085715-6ae07d24-thumbnail.jpg?width=640&height=640&fit=bounds)


![[DSC Europe 25] Goran Obradovic - The Rise of Sovereign AI: Building the Regi...](https://cdn.slidesharecdn.com/ss_thumbnails/7nw2xxixrxqdxvrb5wca-6-251205085714-ab09a2ac-thumbnail.jpg?width=640&height=640&fit=bounds)

![[DSC Europe 25] Andy Cotgreave - Nothing is new in analytics.pptx](https://cdn.slidesharecdn.com/ss_thumbnails/mba4vzcurvoh5lfrd5zw-6-251205194645-341bbbbe-thumbnail.jpg?width=640&height=640&fit=bounds)
![[DSC Europe 25] Marija Vlajkovic & Andrea Radonjanin - Integration of AI tool...](https://cdn.slidesharecdn.com/ss_thumbnails/qf1jrglttoc3bm8s3aop-final-integration-of-ai-tools-251208151905-394f3a6a-thumbnail.jpg?width=640&height=640&fit=bounds)

![[DSC Europe 25] Max Talanov - Non digital NNs.pptx](https://cdn.slidesharecdn.com/ss_thumbnails/wif8tr3gtua74qvtopke-non-digital-nns-251205090438-26b0eea6-thumbnail.jpg?width=640&height=640&fit=bounds)

