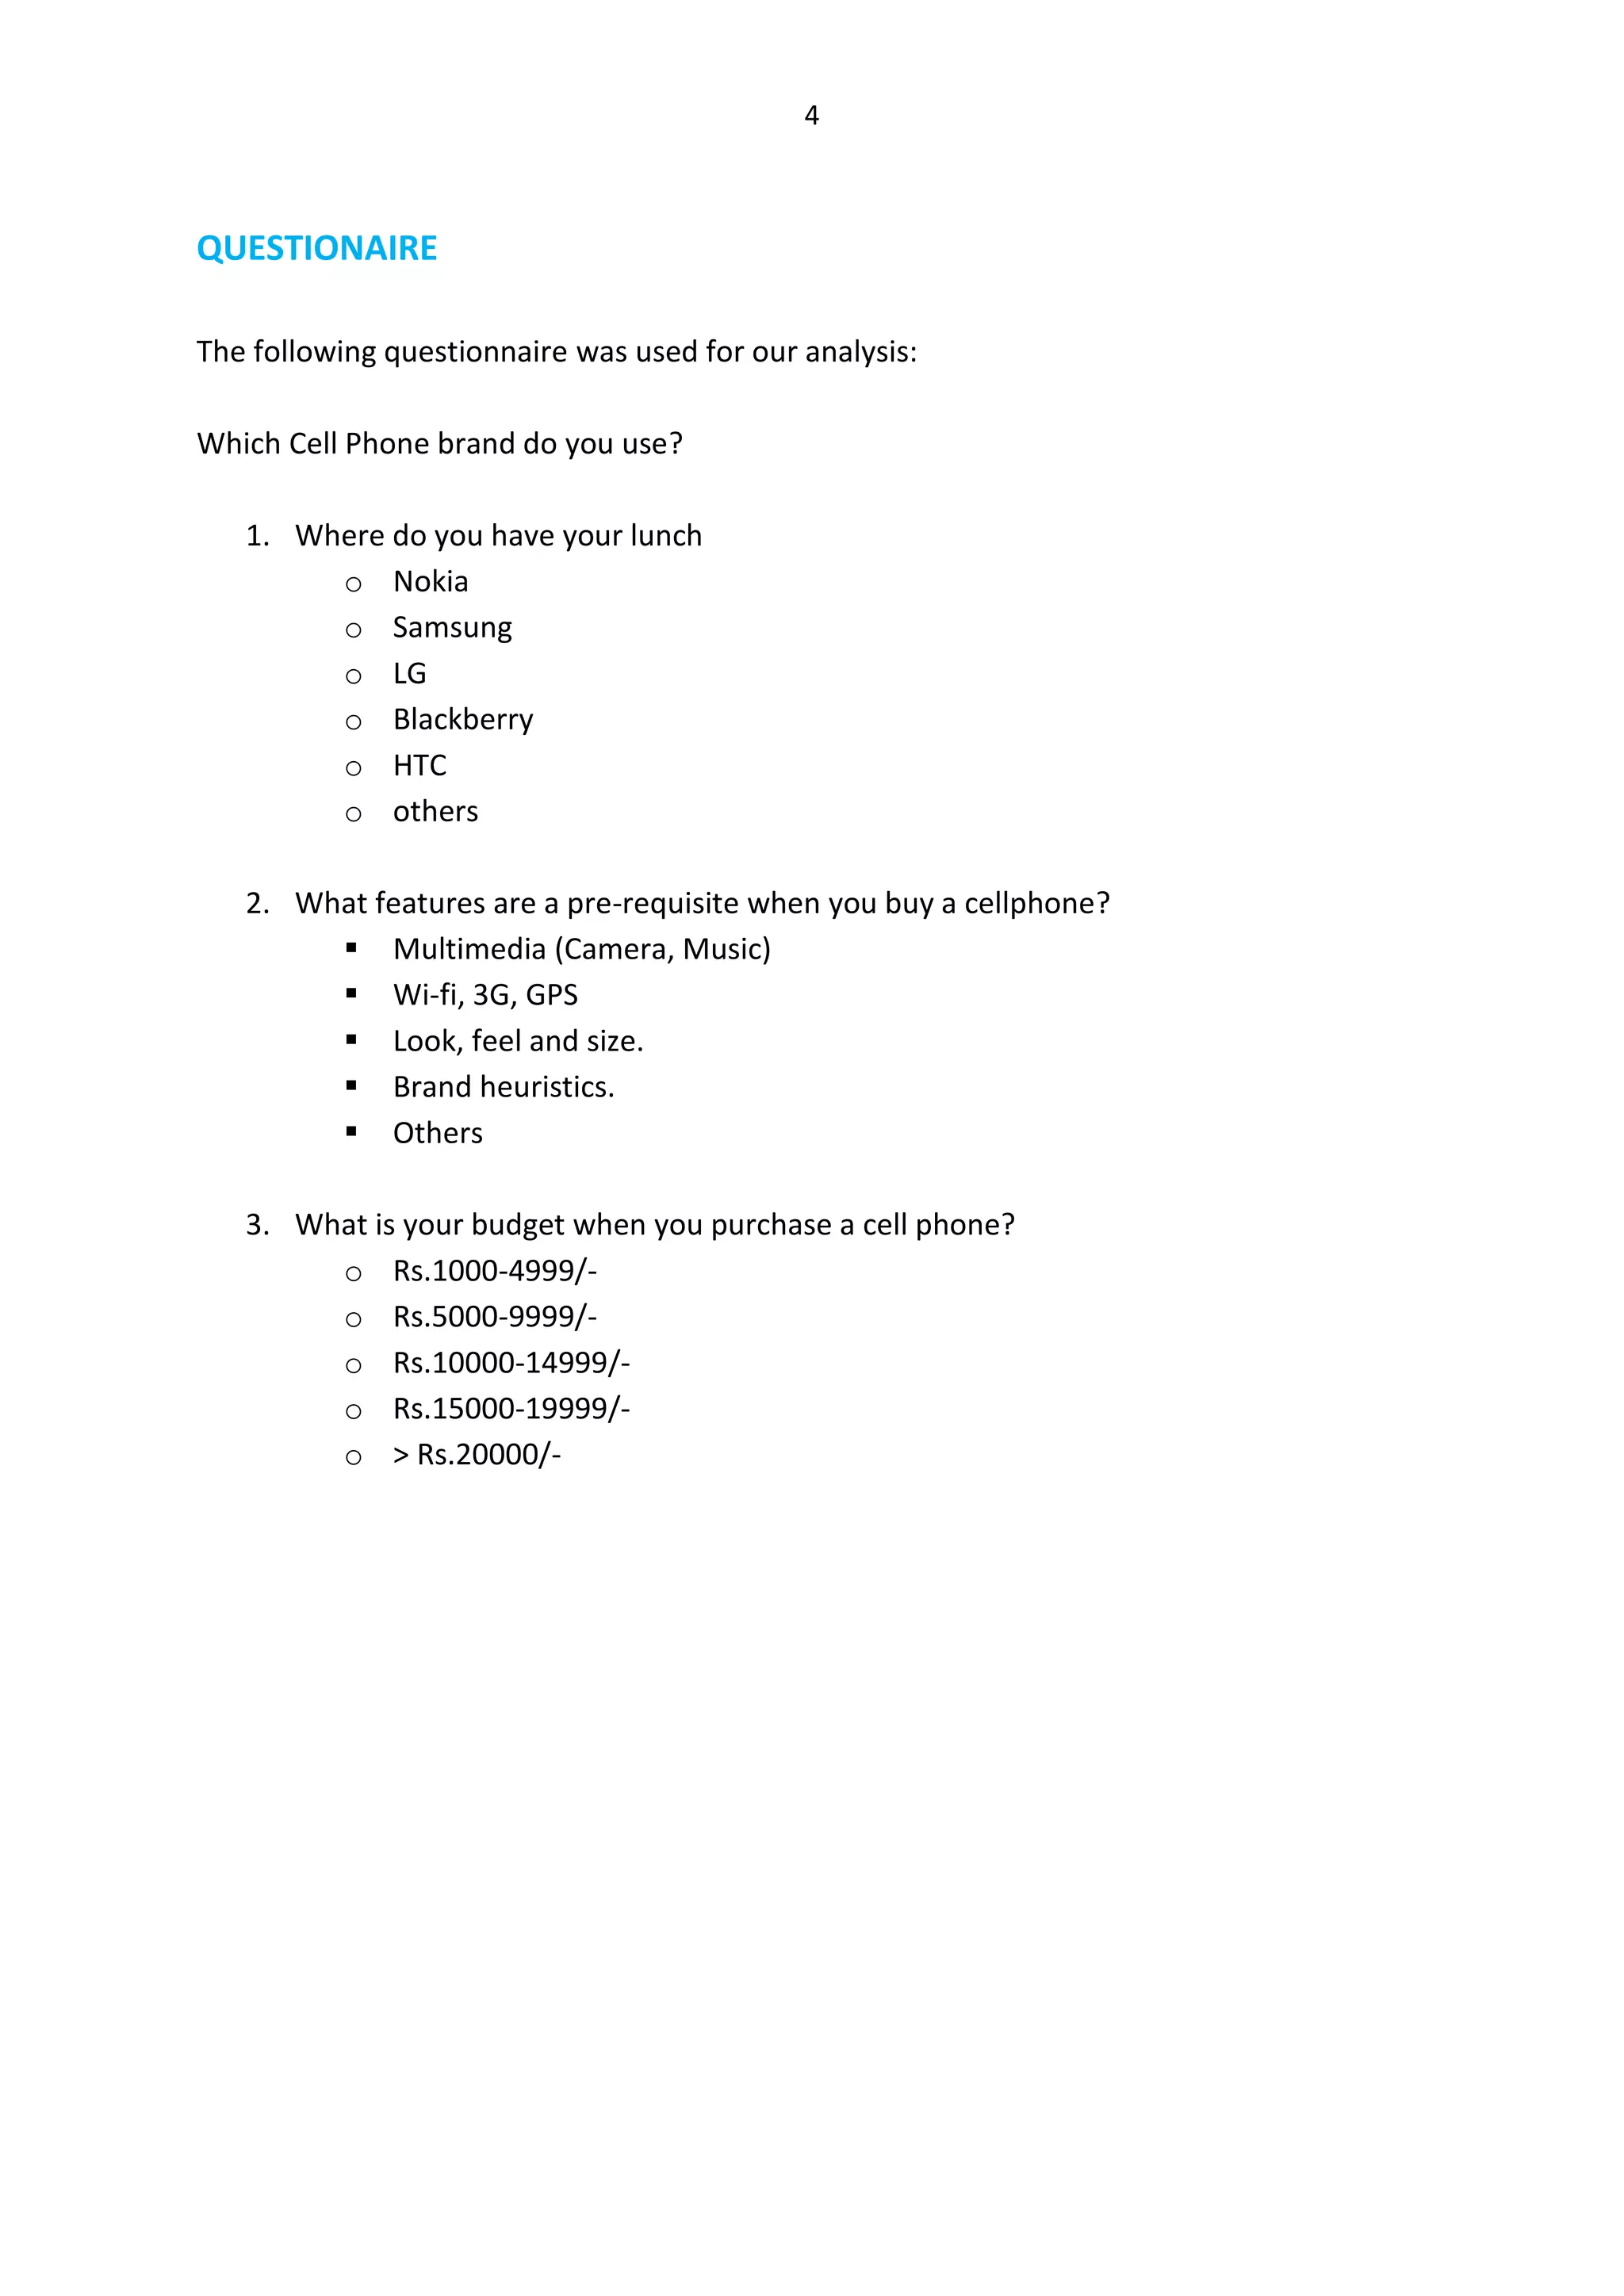
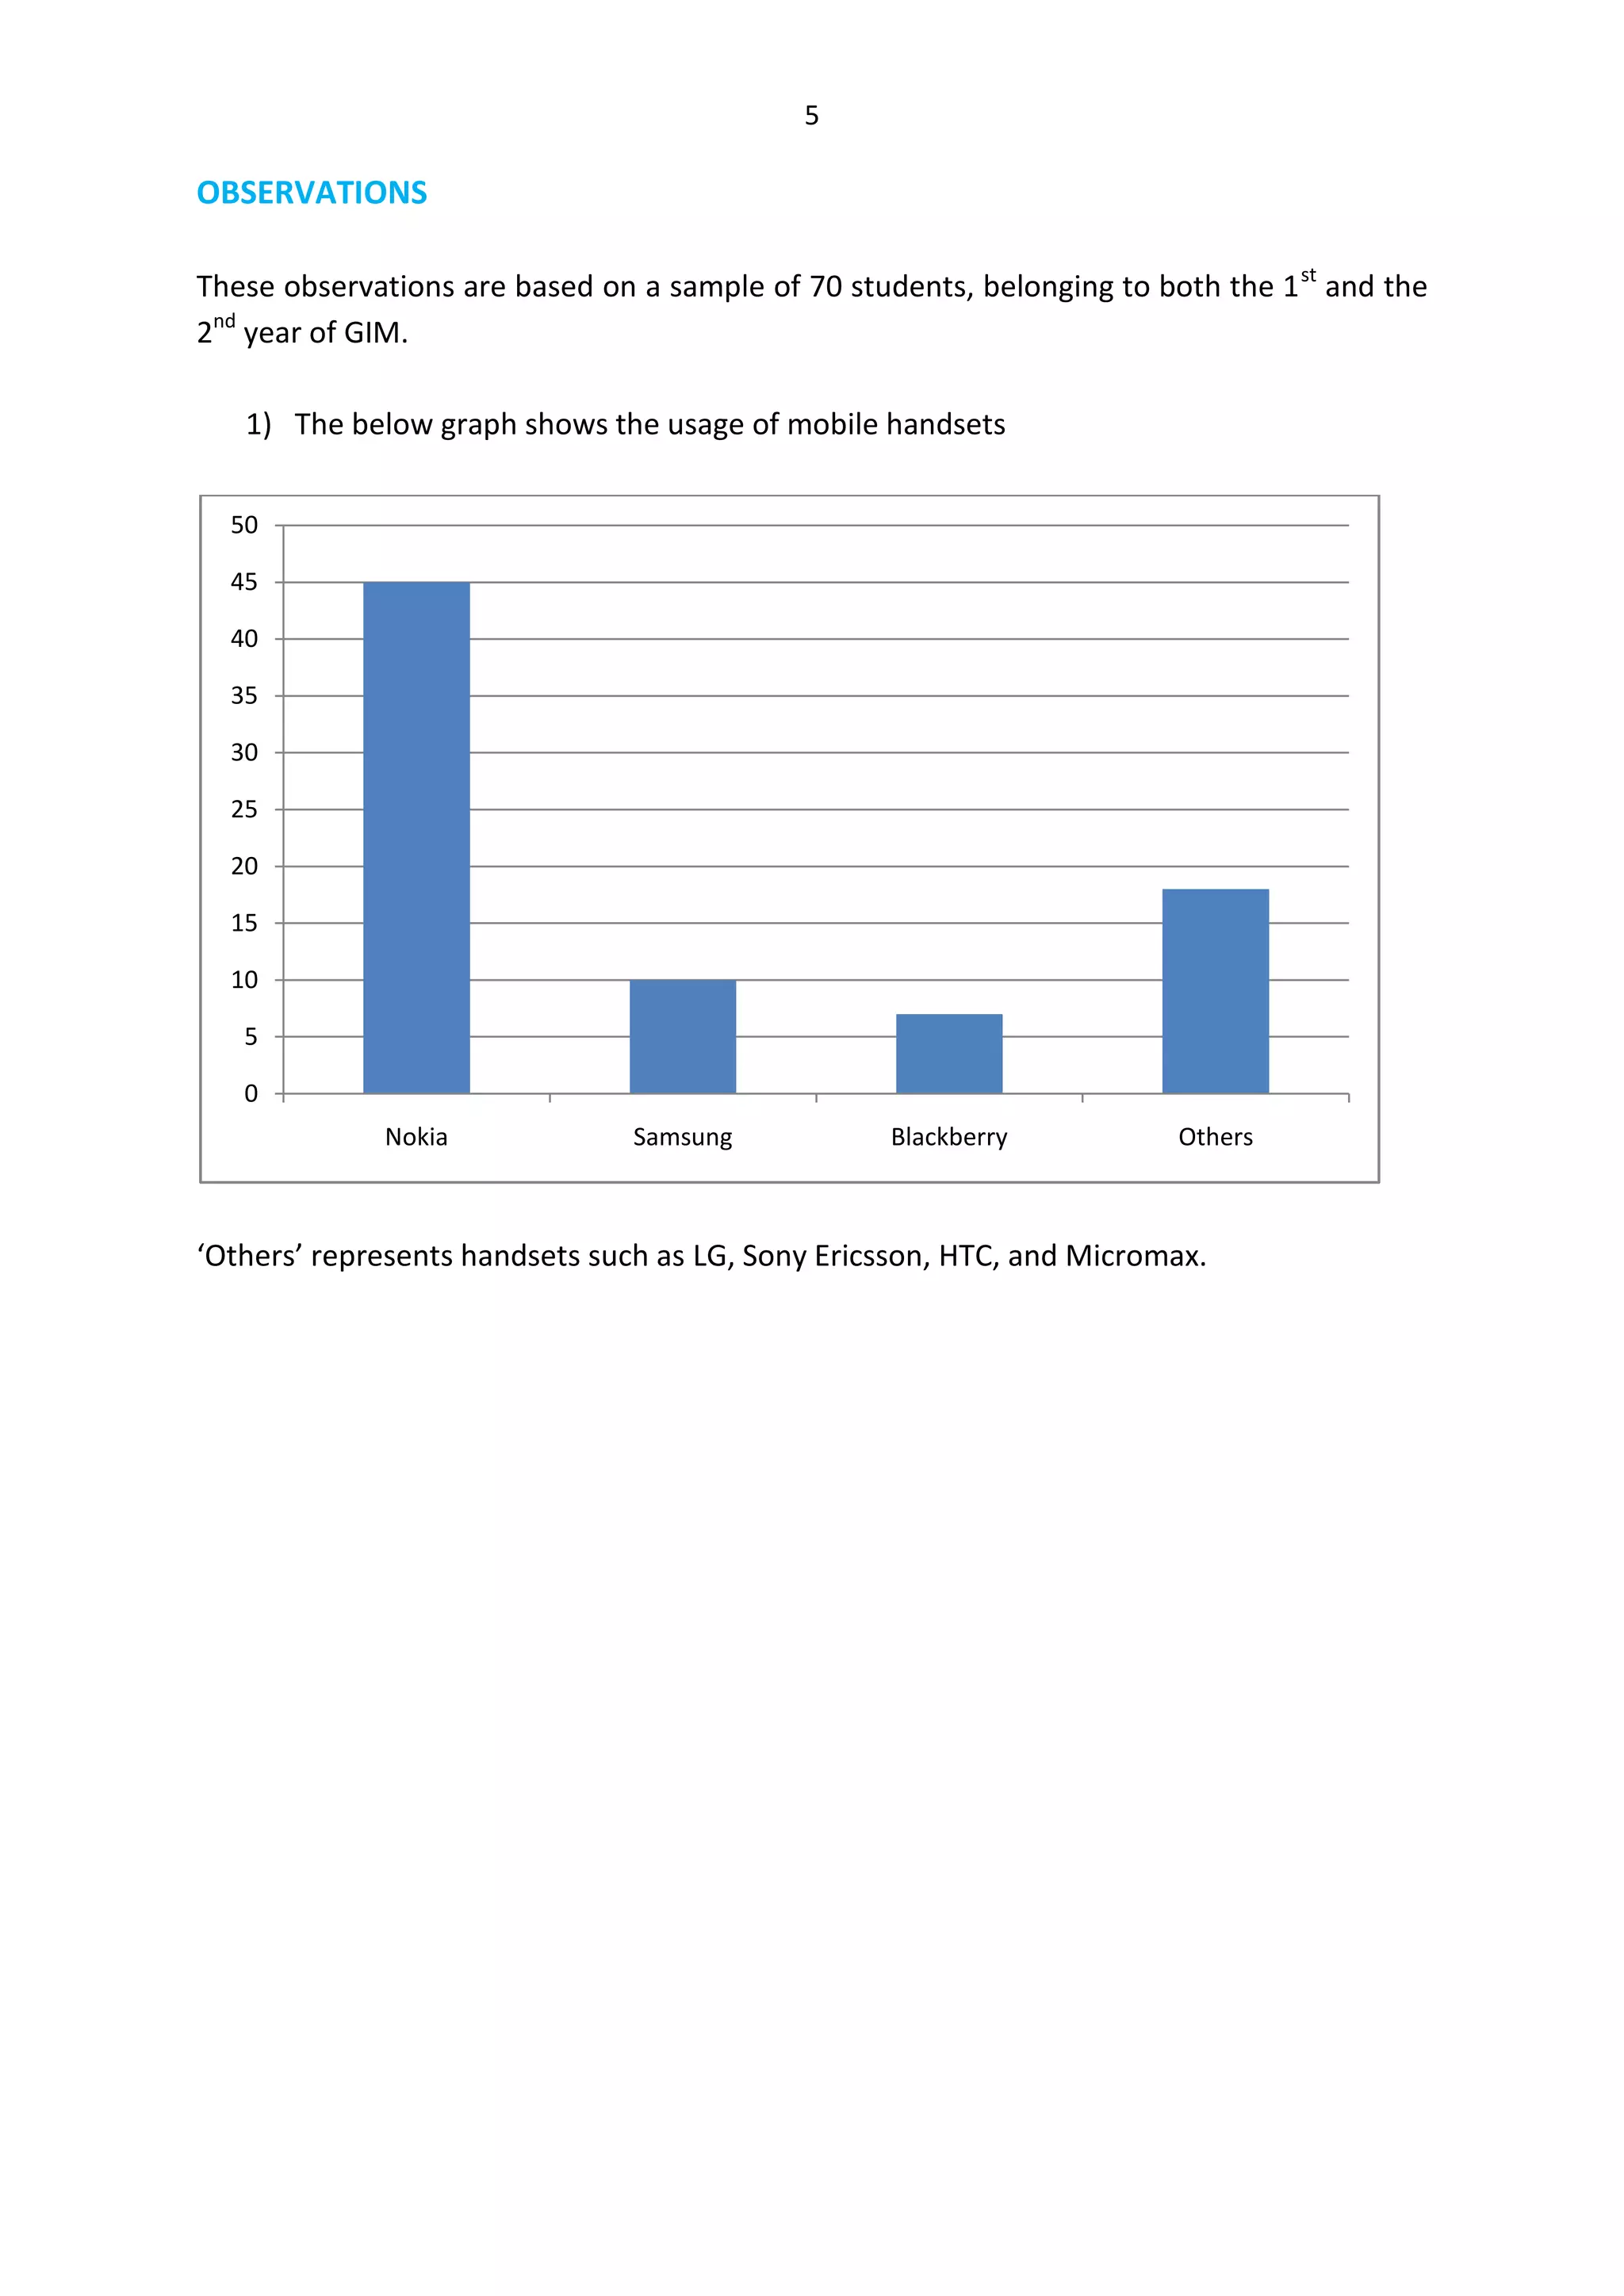
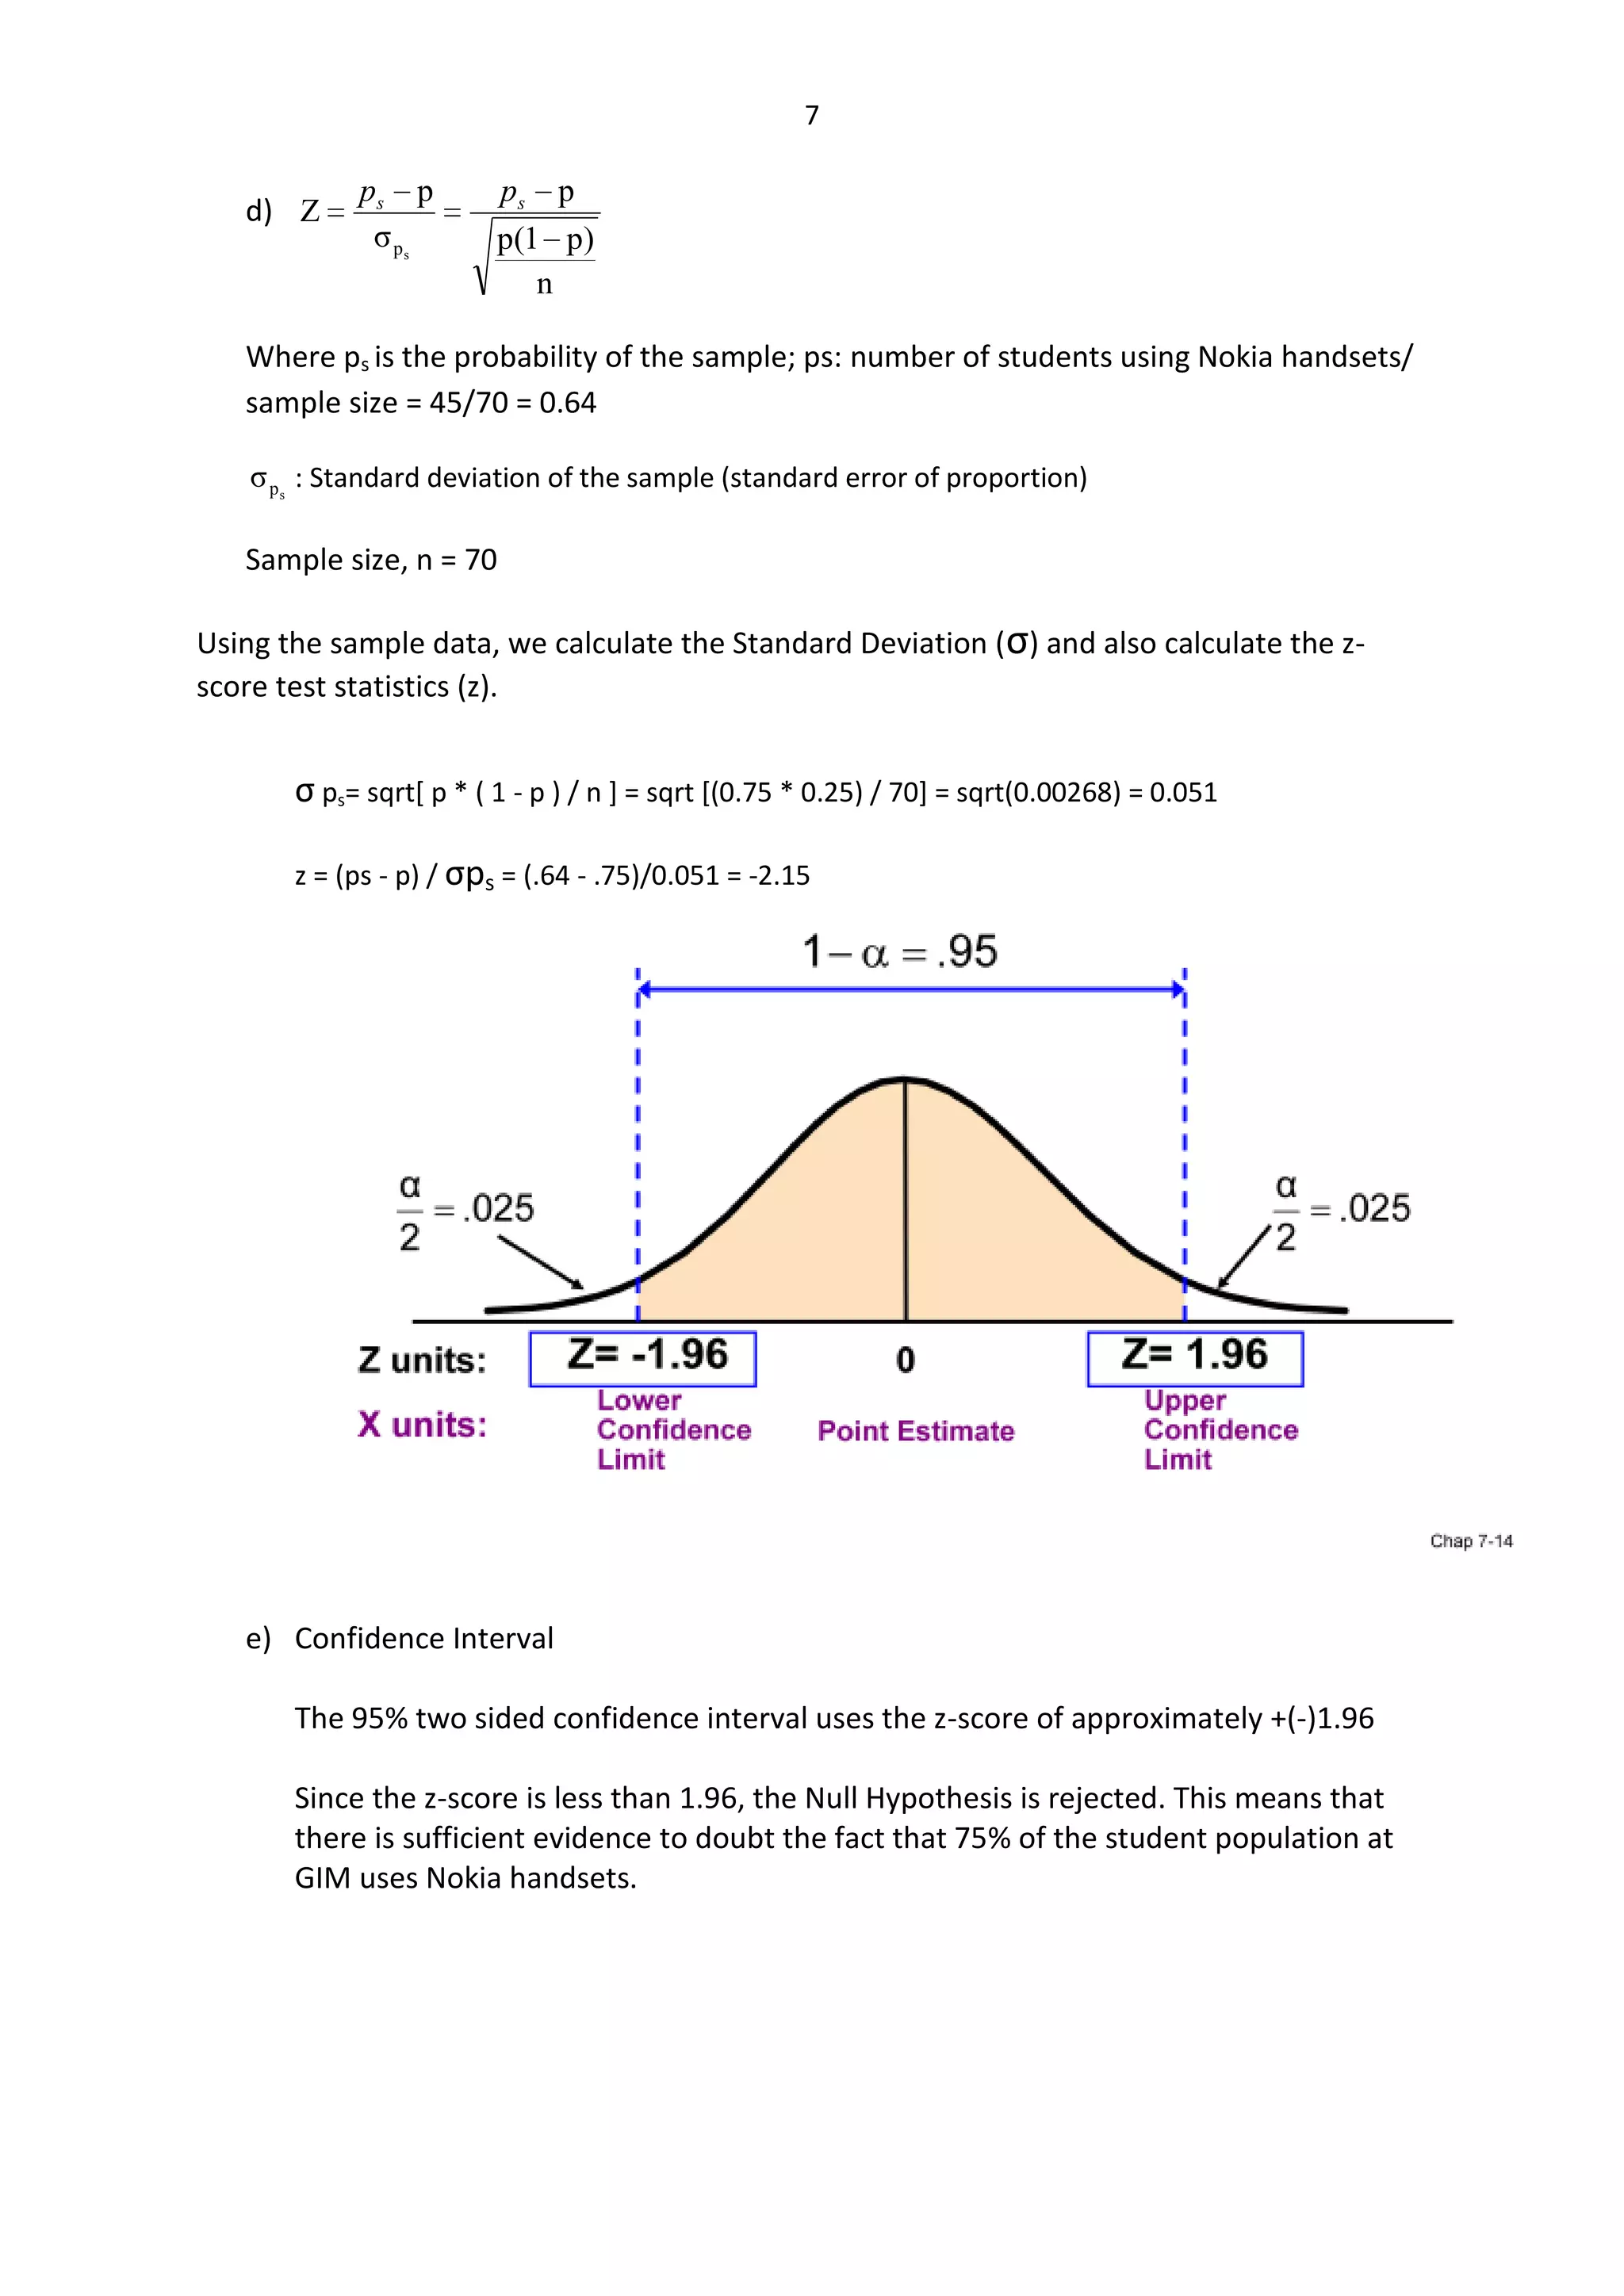
A STUDY OF PREFERENCE OF CELL PHONE BRAND<br /> AT THE GOA INSTITUTE OF MANAGEMENT <br />Submitted to<br />Prof. Sameek Ghosh<br />In partial fulfilment of course requirements in<br />Managerial Statistics<br />By<br />PGP I - Goa Institute of Management<br />Avnika  Suri2011138Hitaishi Khuller2011150Joel Dias2011154Sukritta Loonia 2011173Sumeet  Saluja2011174Umair Khalid Siddiqui2011177<br />TABLE OF CONTENTS<br /> TOC \o \"
1-3\"
 \h \z \u SUMMARY PAGEREF _Toc301135941 \h 3<br />METHODS3<br />Questionnaire4<br />Observations5<br />Calculations6<br />CONCLUSIONS AND RECOMMENDATIONS8<br /> SUMMARY<br />This report gives us an insight of cell phone usage in Goa Institute of Management. We have studied the cell phone brands used by the students at GIM. Although Nokia has emerged to be the most popular brand, its share has started to decline as it faces stiff competition from other brands that offer a variety of features at competitive prices.<br />A survey was conducted at the GIM campus, where the students were asked to fill up the questionnaires asking about the cell phones used by them and attributes that they look out for while buying cell phones.<br />Hence, the objective of this survey was to get an idea of the most preferred brand of mobile handsets amongst the students at GIM.<br />METHODS<br />To find out the most preferred cell phone brand, we opted for a combination of statistical tools and questionnaires. <br />The questionnaire was distributed to the students of both the batches assessing their preferences for cell phones and the important attributes they look out for in their phones.<br />QUESTIONAIRE <br />The following questionnaire was used for our analysis:<br />Which Cell Phone brand do you use?<br />Where do you have your lunch
Nokia
Samsung
LG
Blackberry
HTC
others
What features are a pre-requisite when you buy a cellphone?

Statistics project section c group 6

  • 1.
    A STUDY OFPREFERENCE OF CELL PHONE BRAND<br /> AT THE GOA INSTITUTE OF MANAGEMENT <br />Submitted to<br />Prof. Sameek Ghosh<br />In partial fulfilment of course requirements in<br />Managerial Statistics<br />By<br />PGP I - Goa Institute of Management<br />Avnika Suri2011138Hitaishi Khuller2011150Joel Dias2011154Sukritta Loonia 2011173Sumeet Saluja2011174Umair Khalid Siddiqui2011177<br />TABLE OF CONTENTS<br /> TOC \o \" 1-3\" \h \z \u SUMMARY PAGEREF _Toc301135941 \h 3<br />METHODS3<br />Questionnaire4<br />Observations5<br />Calculations6<br />CONCLUSIONS AND RECOMMENDATIONS8<br /> SUMMARY<br />This report gives us an insight of cell phone usage in Goa Institute of Management. We have studied the cell phone brands used by the students at GIM. Although Nokia has emerged to be the most popular brand, its share has started to decline as it faces stiff competition from other brands that offer a variety of features at competitive prices.<br />A survey was conducted at the GIM campus, where the students were asked to fill up the questionnaires asking about the cell phones used by them and attributes that they look out for while buying cell phones.<br />Hence, the objective of this survey was to get an idea of the most preferred brand of mobile handsets amongst the students at GIM.<br />METHODS<br />To find out the most preferred cell phone brand, we opted for a combination of statistical tools and questionnaires. <br />The questionnaire was distributed to the students of both the batches assessing their preferences for cell phones and the important attributes they look out for in their phones.<br />QUESTIONAIRE <br />The following questionnaire was used for our analysis:<br />Which Cell Phone brand do you use?<br />Where do you have your lunch
  • 2.
  • 3.
  • 4.
  • 5.
  • 6.
  • 7.
  • 8.
    What features area pre-requisite when you buy a cellphone?
  • 9.
  • 10.
  • 11.
  • 12.
  • 13.
  • 14.
    What is yourbudget when you purchase a cell phone?
  • 15.
  • 16.
  • 17.
  • 18.
  • 19.
    > Rs.20000/-OBSERVATIONS<br />Theseobservations are based on a sample of 70 students, belonging to both the 1st and the 2nd year of GIM.<br />The below graph shows the usage of mobile handsets‘Others’ represents handsets such as LG, Sony Ericsson, HTC, and Micromax.<br />CALCULATIONS AND ANALYSIS<br />To perform our study, after conducting the survey using the questionnaire, we have used statistical hypothesis testing. A statistical hypothesis test is a method of making decisions using data, whether from a controlled experiment or an observational study (not controlled). In statistics, a result is called statistically significant if it is unlikely to have occurred by chance alone, according to a pre-determined threshold probability, the significance level.<br />We test that assuming that the null hypothesis is true, what is the probability of observing a value for the test statistic that is at least as extreme as the value that was actually observed. One use of hypothesis testing is deciding whether experimental results contain enough information to cast doubt on conventional wisdom.<br />A result that was found to be statistically significant is also called a positive result; conversely, a result that is not unlikely under the null hypothesis is called a negative result or a null result.<br />The critical region of a hypothesis test is the set of all outcomes which, if they occur, will lead us to decide that there is a difference. That is, cause the null hypothesis to be rejected in favor of the alternative hypothesis. The critical region is usually denoted by the letter C.<br />In our survey, we suppose that 75% of the students in GIM use Nokia handsets. The probability of population, p is 0.75. Hence,<br />Null Hypothesis, Ho: 75% of students in Goa Institute of Management use Nokia handsets H0: p = 0.75<br />Alternative Hypothesis, H1: p ≠ 0.75
  • 20.
    Reject H0: p≠ 0.75
  • 21.
    Hence, we usea two tailed hypothesis
  • 22.
  • 23.
  • 24.
  • 25.
    Sample size of70 students is well distributed and represents the cell phone usage of the entire campusWhere ps is the probability of the sample; ps: number of students using Nokia handsets/ sample size = 45/70 = 0.64<br />: Standard deviation of the sample (standard error of proportion)<br />Sample size, n = 70<br />Using the sample data, we calculate the Standard Deviation (σ) and also calculate the z-score test statistics (z).<br />σ ps= sqrt[ p * ( 1 - p ) / n ] = sqrt [(0.75 * 0.25) / 70] = sqrt(0.00268) = 0.051 <br />z = (ps - p) / σps = (.64 - .75)/0.051 = -2.15<br />Chap 7-14Z= -1.96Z= 1.96Point EstimateLower Confidence LimitUpperConfidence LimitZ units:X units:Point Estimate0<br />Confidence IntervalThe 95% two sided confidence interval uses the z-score of approximately +(-)1.96<br />Since the z-score is less than 1.96, the Null Hypothesis is rejected. This means that there is sufficient evidence to doubt the fact that 75% of the student population at GIM uses Nokia handsets.<br />CONCLUSIONS AND RECOMMENDATIONS<br />The conclusions from our study are:<br />Nokia’s usage in GIM has declined over the past years. The reason cited for this observation is the increasing trend towards other smart phones such as Blackberry and HTC.
  • 26.
    Students have startedto prefer brands such as Samsung that offer similar features at more reasonable prices.
  • 27.
    A considerable numberof students consider features such as wi-fi connectivity and 3G facility before purchasing a phone. This is where brands such as HTC and Blackberry are increasingly banking on Nokia’s market share.
  • 28.
    The budget isa primary concern for students studying at GIM. Since the budget range for a majority of students lies between Rs. 5000 and Rs. 10000, several students have shifted to high end Nokia and Blackberry handsets.
  • 29.
    Although Nokia holdsa significant share in the market, other cell phone handsets are giving the brand a stiff competition.