Downloaded 787 times


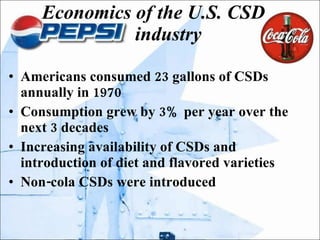


The cola wars between Coke and Pepsi continued into the 21st century with both companies facing new challenges. While CSD consumption had grown steadily in the US from 1970 to 2000, growth slowed in the 2000s. Both companies relied on brand extensions like Diet Coke and Diet Pepsi to boost sales. By 2004, Pepsi had gained market share over Coke, but both remained the top two brands. To sustain profits, Coke and Pepsi expanded their product portfolios beyond carbonated soft drinks into non-carbonated beverages, bottled water and juices.


![Coca Cola Presentation[1]](https://cdn.slidesharecdn.com/ss_thumbnails/cocacolapresentation1-12796581248162-phpapp01-thumbnail.jpg?width=640&height=640&fit=bounds)


