Solan Call Girl Just Call 8084732287 Top Class Call Girl Service Available
Case Analysis Coke Pepsi2
1. 1. Why is the soft drink industry so profitable?
An industry analysis through Porter’s Five Forces reveals that market forces are favorable for profitability.
Defining the industry: Both concentrate producers (CP) and bottlers are profitable. These two parts of the
industry are extremely interdependent, sharing costs in procurement, production, marketing and distribution.
Many of their functions overlap; for instance, CPs do some bottling, and bottlers conduct many promotional
activities. The industry is already vertically integrated to some extent. They also deal with similar suppliers
and buyers. Entry into the industry would involve developing operations in either or both disciplines.
Beverage substitutes would threaten both CPs and their associated bottlers. Because of operational overlap
and similarities in their market environment, we can include both CPs and bottlers in our definition of the soft
drink industry. In 1993, CPs earned 29% pretax profits on their sales, while bottlers earned 9% profits on their
sales, for a total industry profitability of 14% (Exhibit 1). This industry as a whole generates positive
economic profits.
Rivalry: Revenues are extremely concentrated in this industry, with Coke and Pepsi, together with their
associated bottlers, commanding 73% of the case market in 1994. Adding in the next tier of soft drink
companies, the top six controlled 89% of the market. In fact, one could characterize the soft drink market as an
oligopoly, or even a duopoly between Coke and Pepsi, resulting in positive economic profits. To be sure, there
was tough competition between Coke and Pepsi for market share, and this occasionally hampered profitability.
For example, price wars resulted in weak brand loyalty and eroded margins for both companies in the 1980s.
The Pepsi Challenge, meanwhile, affected market share without hampering per case profitability, as Pepsi was
able to compete on attributes other than price.
Substitutes: Through the early 1960s, soft drinks were synonymous with “colas” in the mind of consumers.
Over time, however, other beverages, from bottled water to teas, became more popular, especially in the 1980s
and 1990s. Coke and Pepsi responded by expanding their offerings, through alliances (e.g. Coke and Nestea),
acquisitions (e.g. Coke and Minute Maid), and internal product innovation (e.g. Pepsi creating Orange Slice),
capturing the value of increasingly popular substitutes internally. Proliferation in the number of brands did
threaten the profitability of bottlers through 1986, as they more frequent line set-ups, increased capital
investment, and development of special management skills for more complex manufacturing operations and
distribution. Bottlers were able to overcome these operational challenges through consolidation to achieve
economies of scale. Overall, because of the CPs efforts in diversification, however, substitutes became less of
a threat.
Power of Suppliers: The inputs for Coke and Pepsi’s products were primarily sugar and packaging. Sugar
could be purchased from many sources on the open market, and if sugar became too expensive, the firms could
easily switch to corn syrup, as they did in the early 1980s. So suppliers of nutritive sweeteners did not have
much bargaining power against Coke, Pepsi, or their bottlers. NutraSweet, meanwhile, had recently come off
patent in 1992, and the soft drink industry gained another supplier, Holland Sweetener, which reduced Searle’s
bargaining power and lowering the price of aspartame.
1
2. With an abundant supply of inexpensive aluminum in the early 1990s and several can companies
competing for contracts with bottlers, can suppliers had very little supplier power. Furthermore, Coke and
Pepsi effectively further reduced the supplier of can makers by negotiating on behalf of their bottlers, thereby
reducing the number of major contracts available to two. With more than two companies vying for these
contracts, Coke and Pepsi were able to negotiate extremely favorable agreements. In the plastic bottle
business, again there were more suppliers than major contracts, so direct negotiation by the CPs was again
effective at reducing supplier power.
Power of buyers: The soft drink industry sold to consumers through five principal channels: food stores,
convenience and gas, fountain, vending, and mass merchandisers (primary part of “Other” in “Cola Wars…”
case).
Supermarkets, the principal customer for soft drink makers, were a highly fragmented industry. The
stores counted on soft drinks to generate consumer traffic, so they needed Coke and Pepsi products. But due
to their tremendous degree of fragmentation (the biggest chain made up 6% of food retail sales, and the largest
chains controlled up to 25% of a region), these stores did not have much bargaining power. Their only power
was control over premium shelf space, which could be allocated to Coke or Pepsi products. This power did
give them some control over soft drink profitability. Furthermore, consumers expected to pay less through this
channel, so prices were lower, resulting in somewhat lower profitability.
National mass merchandising chains such as Wal-Mart, on the other hand, had much more bargaining
power. While these stores did carry both Coke and Pepsi products, they could negotiate more effectively due
to their scale and the magnitude of their contracts. For this reason, the mass merchandiser channel was
relatively less profitable for soft drink makers.
The least profitable channel for soft drinks, however, was fountain sales. Profitability at these
locations was so abysmal for Coke and Pepsi that they considered this channel “paid sampling.” This was
because buyers at major fast food chains only needed to stock the products of one manufacturer, so they could
negotiate for optimal pricing. Coke and Pepsi found these channels important, however, as an avenue to build
brand recognition and loyalty, so they invested in the fountain equipment and cups that were used to serve their
products at these outlets. As a result, while Coke and Pepsi gained only 5% margins, fast food chains made
75% gross margin on fountain drinks.
Vending, meanwhile, was the most profitable channel for the soft drink industry. Essentially there
were no buyers to bargain with at these locations, where Coke and Pepsi bottlers could sell directly to
consumers through machines owned by bottlers. Property owners were paid a sales commission on Coke and
Pepsi products sold through machines on their property, so their incentives were properly aligned with those of
the soft drink makers, and prices remained high. The customer in this case was the consumer, who was
generally limited on thirst quenching alternatives.
The final channel to consider is convenience stores and gas stations. If Mobil or Seven-Eleven were
to negotiate on behalf of its stations, it would be able to exert significant buyer power in transactions with
2
3. Coke and Pepsi. Apparently, though, this was not the nature of the relationship between soft drink producers
and this channel, where bottlers’ profits were relatively high, at $0.40 per case, in 1993. With this high
profitability, it seems likely that Coke and Pepsi bottlers negotiated directly with convenience store and gas
station owners.
So the only buyers with dominant power were fast food outlets. Although these outlets captured most
of the soft drink profitability in their channel, they accounted for less than 20% of total soft drink sales.
Through other markets, however, the industry enjoyed substantial profitability because of limited buyer power.
Barriers to Entry: It would be nearly impossible for either a new CP or a new bottler to enter the industry.
New CPs would need to overcome the tremendous marketing muscle and market presence of Coke, Pepsi, and
a few others, who had established brand names that were as much as a century old. Through their DSD
practices, these companies had intimate relationships with their retail channels and would be able to defend
their positions effectively through discounting or other tactics. So, although the CP industry is not very capital
intensive, other barriers would prevent entry. Entering bottling, meanwhile, would require substantial capital
investment, which would deter entry. Further complicating entry into this market, existing bottlers had
exclusive territories in which to distribute their products. Regulatory approval of intrabrand exclusive
territories, via the Soft Drink Interbrand Competition Act of 1980, ratified this strategy, making it impossible
for new bottlers to get started in any region where an existing bottler operated, which included every
significant market in the US.
In conclusion, an industry analysis by Porter’s Five Forces reveals that the soft drink industry in 1994
was favorable for positive economic profitability, as evidenced in companies’ financial outcomes.
2. Compare the economics of the concentrate business to the bottling business. Why is the profitability so
different?
In some ways, the economics of the concentrate business and the bottling business should be
inextricably linked. The CPs negotiate on behalf of their suppliers, and they are ultimately dependent on the
same customers. Even in the case of materials, such as aspartame, that are incorporated directly into
concentrates, CPs pass along any negotiated savings directly to their bottlers. Yet the industries are quite
different in terms of profitability.
The fundamental difference between CPs and bottlers is added value. The biggest source of added
value for CPs is their proprietary, branded products. Coke has protected its recipe for over a hundred years as
a trade secret, and has gone to great lengths to prevent others from learning its cola formula. The company
even left a billion-person market (India) to avoid revealing this information. As a result of extended histories
and successful advertising efforts, Coke and Pepsi are respected household names, giving their products an
aura of value that cannot be easily replicated. Also hard to replicate are Coke and Pepsi’s sophisticated
strategic and operational management practices, another source of added value.
Bottlers have significantly less added value. Unlike their CP counterparts, they do not have branded
products or unique formulas. Their added value stems from their relationships with CPs and with their
3
4. customers. They have repeatedly negotiated contracts with their customers, with whom they work on an
ongoing basis, and whose idiosyncratic needs are familiar to them. Through long-term, in depth relationships
with their customers, they are able to serve customers effectively. Through DSD programs, they lower their
customers’ costs, making it possible for their customers to purchase and sell more product. In this way,
bottlers are able to grow the pie of the soft drink market. Their other source of profitability is their contract
relationships with CPs, which grant them exclusive territories and share some cost savings. Exclusive
territories prevent intrabrand competition, creating oligopolies at the bottler level, which reduce rivalry and
allow profits. To further build “glass houses,” as described by Nalebuff and Brandenberger (Co-opetition, p.
88), for their bottlers, CPs pass along some of their negotiated supply savings to their bottlers. Coke gives 2/3
of negotiated aspartame savings to its bottlers by contract, and Pepsi does this in practice. This practice keeps
bottlers comfortable enough, so that they are unlikely to challenge their contracts. Bottlers’ principal ability is
to use their capital resources effectively. Such operational effectiveness is not a driver of added value,
however, as operational effectiveness is easily replicated.
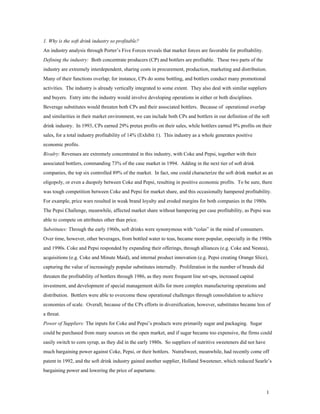
Between 1986 and 1993, the differences in added value between CPs and bottlers resulted in a major
shift in profitability within the industry. Exhibit 1 demonstrates these dramatic changes. While industry
profitability increased by 11%, CP profits rose by 130% on a per case basis, from $0.10 to $0.23. During this
period, bottler profits actually dropped on a per case basis by 23%, from $0.35 to 0.27.
One possibility is that product line expansion in defense against new age beverages helped CPs but
hurt bottlers. This would be expected if bottler’s per case costs increased due to the operational challenges and
capital costs of producing and distributing broader product lines. This, however, was not the case; cost of sales
per case decreased for both CPs and bottlers by 27% during this period, mostly due to economies of scale
developed through consolidation. The real difference between the fortunes of CPs and bottlers through this
period, then, is in top line revenues. While CPs were able to charge more for their products, bottlers faced
price pressure, resulting in lower revenues per case.
These per case revenue changes occurred during a period of slowing growth in the industry, as shown
in Exhibit 2. Growth in per capita consumption of soft drinks slowed to a 1.2% CAGR in the period 1989 to
1993, while case volume growth tapered to 2.3%. In an struggle to secure limited shelf space with more
products and slower overall growth, bottlers were probably forced to give up more margin on their products.
CPs, meanwhile, could continue increasing the prices for their concentrates with the consumer price index.
Coke had negotiated this flexibility into its Master Bottling Contact in 1986, and Pepsi had worked price
increases based on the CPI into its bottling contracts. So, while the bottlers faced increasing price pressure in a
slowing market, CPs could continue raising their prices. Despite improvements in per case costs, bottlers
could not improve their profitability as a percent of total sales. As a result, through the period of 1986 to 1993,
bottlers did not gain any of the profitability gains enjoyed by CPs.
3. Why have contracts between CPs and bottlers taken the form they have in the soft drink industry?
4
5. Contracts between CPs and bottlers were strategically constructed by the CPs. Although beneficial to
bottlers on the surface, the contracts favored the CPs’ long-term strategies in important ways.
First, territorial exclusivity is beneficial to bottlers, as it prevents intrabrand competition, ensures
bargaining power over buyers and establishes barriers to entry. But it is also beneficial to CPs, who are also
not subject to price wars within their own brand. The contracts also excluded bottlers from producing the
flagship products of competitors. This created monopoly status for the CPs, from the bottler perspective. Each
bottler could only negotiate with one supplier for its premium product. Violation of this stipulation would
result in termination of the contract, which would leave the bottler in a difficult position.
Historically, contracts were designed hold syrup prices constant into perpetuity, only influenced by
rising prices of sugar. This changed in 1978 and 1986, as contracts were renegotiated, first to accommodate
for rises in the CPI, and then to give general flexibility to the CP (Coke) in setting prices. Coke could
negotiate this more flexible pricing because its bottlers were dependent on it for business. It further ensured
that its bottlers would be captive to its monopoly status by buying major bottlers and then selling them into the
CCE holding company, which would only produce Coke products. Coke would capture 49% of the dividends
from CCE, without the complications of vertical integration.
4. Should concentrate producers vertically integrate into bottling?
Given the data in Exhibit 1, indicating the CP business has grown more profitable over the last seven
years, while the bottling industry has struggled to retain any profitability, it would not be advisable to vertically
integrate.
Stuckey and White (p. 78) indicate that a firm should “Integrate into those stages of the industry chain
where the most economic surplus is available, irrespective of closeness to the customer or the absolute size of
the value added.” In the soft drink industry, CPs generally miss out on the profits earned through fountain
sales. Pepsi, realizing that fast food chains were capturing most of the value of fountain sales, entered the fast
food business by purchasing Taco Bell, Pizza Hut, and KFC. These mergers allowed the firm to capture more
value from its soft drink sales, but these mergers could also be problematic. For example, PepsiCo might not
have a core competency in food sales or a strong position in the industry. Because it might not be able to
effectively transfer skills or share activities with its fast food businesses, the mergers might not be successful in
the long run. Stuckey and White also point out that “high-surplus stages must, by definition, be protected by
barriers to entry.” So it could be difficult for Coke to enter the fast food business. It could be prohibitively
expensive to purchase McDonalds or Burger King, and developing a chain of its own against such formidable
competition would be extremely risky. So integration into this phase of the value chain would be difficult or
impossible for Coke.
As Stuckey and White say, “don’t vertically integrate unless it is absolutely necessary to create or
protect value.” We shall address each of these individually to formally refute the plausibility of vertical
integration of CPs into bottling. (1) “The market is too risky and unreliable.” On the contrary, the concentrate
market is highly stable and will be for a long time to come. (2) “Companies in adjacent stages of the industry
5
6. chain have more market power than companies in your stage.” The opposite is true, CPs already have more
market power than bottlers, so they should not vertically integrate. (3) “Integration would create or exploit
market power by raising barriers to entry or allowing price discrimination across customer segments.” In fact,
CPs already have market power through efficient barriers to entry, and effectively price discriminate through
various retail channels. (4) “The market is young and the company must forward integrate to develop a
market, or the market is declining and independents are pulling out of adjacent stages.” The market is neither
young nor declining.
Having determined that a vertical integration strategy fails all four of Stuckey and White’s tests, CPs
should not pursue vertical integration into bottling.
6
7. Exhibit 1 - Industry Profitability Analysis
1986
Concentrate Producer Bottler Total
Dollars per Percent of Dollars per Percent of Dollars per Percent of
Case Total Case Total Case Total
Net Sales 0.55 100% 3.80 100% 4.35 100%
Cost of sales 0.15 27% 2.30 60% 2.45 56%
Gross profit 0.40 73% 1.50 40% 1.90 44%
Selling and delivery 0.01 2% 0.95 25% 0.96 22%
Advertising and marketing 0.24 42% 0.10 3% 0.34 8%
General and administrative 0.05 11% 0.12 3% 0.17 4%
Pretax profit 0.10 18% 0.35 9% 0.45 10%
1993
Concentrate Producer Bottler Total
Dollars per Percent of Dollars per Percent of Dollars per Percent of
Case Total Case Total Case Total
Net Sales 0.66 100% 2.99 100% 3.65 100%
Cost of sales 0.11 17% 1.69 57% 1.80 49%
Gross profit 0.55 83% 1.30 43% 1.85 51%
Selling and delivery 0.01 2% 0.85 28% 0.86 24%
Advertising and marketing 0.26 39% 0.05 2% 0.31 8%
General and administrative 0.05 13% 0.13 4% 0.18 5%
Pretax profit 0.23 29% 0.27 9% 0.50 14%
Change from 1986 to 1993
Concentrate Producer Bottler Total
Change in Change in % Change in Change in Change in % Change in Change in Change in % Change in
Dollars per percent of dollars per dollars per percent of dollars per dollars per percent of dollars per
Case total case case total case case total case
Net Sales 0.11 n/a 20% -0.81 n/a -21% -0.70 n/a -16%
Cost of sales -0.04 -10% -27% -0.61 -3% -27% -0.65 -7% -27%
Gross profit 0.15 10% 38% -0.20 3% -13% -0.05 7% -3%
Selling and delivery 0.00 0% 0% -0.10 3% -11% -0.10 1% -10%
Advertising and marketing 0.02 -3% 8% -0.05 -1% -50% -0.03 1% -9%
General and administrative 0.00 2% 0% 0.01 1% 8% 0.01 1% 6%
Pretax profit 0.13 11% 130% -0.08 0% -23% 0.05 4% 11%
Green Text indicates a change for the better
Red Text indicates a change for the worse
Black Text indicates no change
7
8. Exhibit 2 - Soft Drink Market Growth Tapered in late 1980s and early 1990s
Data drawn from 1994 case quot;Cola Wars Continue…quot;, Exhibit 1.
Compound Annual
Cases Gallons/ Compound Annual Growth Growth Rate (Per Capita
Year Period (millions) Capita Rate (Case Volume) Consumption)
1970 3090 22.7
1975 1970-1975 3780 26.6 .1% 3.2%
1981 1975-1981 5180 34.5 .4% 4.4%
1985 1981-1985 6500 40.8 .8% 4.3%
1989 1985-1989 7680 46.6 .3% 3.4%
1993 1989-1993 8395 48.9 .3% 1.2%
8