Downloaded 412 times

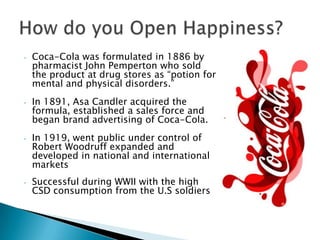

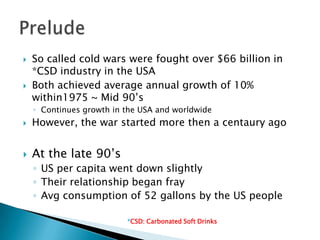


The document summarizes the history and competition between Coca-Cola and Pepsi from 1886 to 2006. It discusses how each company was founded and grew initially. In the late 20th century, both experienced ups and downs as consumption levels fluctuated and they launched new products and diversified. Pepsi became more aggressive in adapting to trends like the rise of non-carbonated drinks, while Coke struggled with execution issues. By 2004, Pepsi had grown its portfolio beyond cola drinks and achieved higher market shares across categories through proactive strategies.