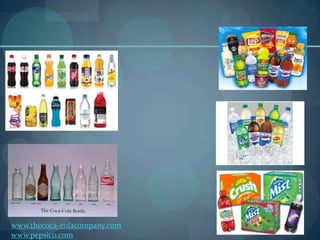
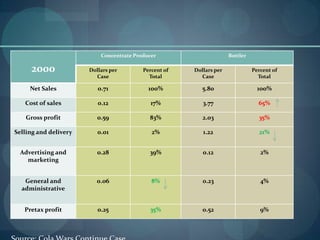
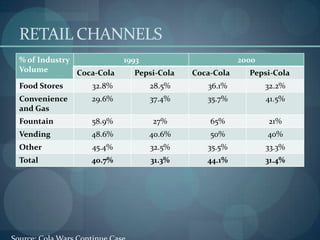
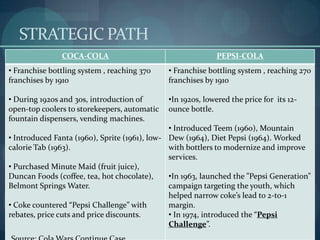
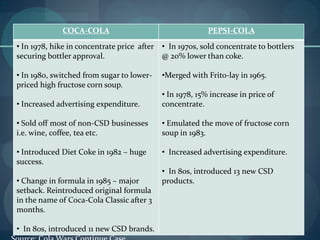
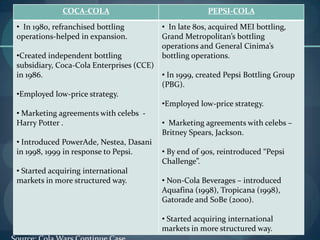
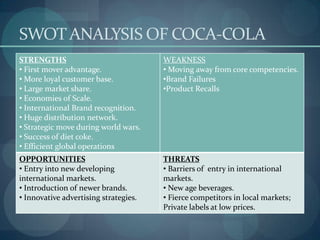
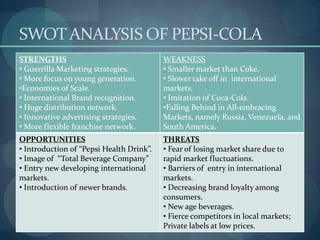
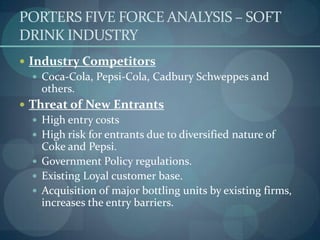
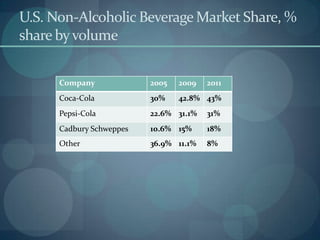
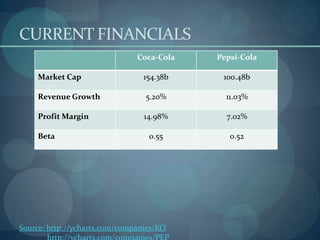
COLA WARS CONTINUE: COKE AND PEPSI
IN THE TWENTY-FIRST CENTURY
By,
Group 6
G. VAIBHAV KUMAR REDDY (P111012)
P. PRAVEEN (P111033)
PRAGYA JAISWAL (P111037)
RAKESH NAVAL (P111039)

GREAT LAKES INSTITUTE OF ENERGY MANAGEMENT AND RESEARCH, GURGOAN
www.thecoca-colacompany.com
www.pepsico.com
CONCENTRATE PRODUCER AND
BOTTLERS
Concentrate Producer

1993
Net Sales

Dollars per
Case

Bottler

Percent of
Total

Dollars per
Case

Percent of
Total

0.66

100%

2.99

100%

Cost of sales

0.11

17%

1.69

57%

Gross profit

0.55

83%

1.30

43%

Selling and
delivery

0.01

2%

0.85

28%

Advertising and
marketing

0.26

39%

0.05

2%

General and
administrative

0.05

13%

0.13

4%

Pretax profit

0.23

29%

0.27

9%
Concentrate Producer

2000

Bottler

Dollars per
Case

Percent of
Total

Dollars per
Case

Percent of
Total

Net Sales

0.71

100%

5.80

100%

Cost of sales

0.12

17%

3.77

65%

Gross profit

0.59

83%

2.03

35%

Selling and delivery

0.01

2%

1.22

21%

Advertising and
marketing

0.28

39%

0.12

2%

General and
administrative

0.06

8%

0.23

4%

Pretax profit

0.25

35%

0.52

9%
RETAIL CHANNELS
% of Industry
Volume
Coca-Cola

1993

2000

Pepsi-Cola

Coca-Cola

Pepsi-Cola

Food Stores

32.8%

28.5%

36.1%

32.2%

Convenience
and Gas

29.6%

37.4%

35.7%

41.5%

Fountain

58.9%

27%

65%

21%

Vending

48.6%

40.6%

50%

40%

Other

45.4%

32.5%

35.5%

33.3%

Total

40.7%

31.3%

44.1%

31.4%
STRATEGIC PATH
COCA-COLA

PEPSI-COLA

• Franchise bottling system , reaching 370
franchises by 1910

• Franchise bottling system , reaching 270
franchises by 1910

• During 1920s and 30s, introduction of
open-top coolers to storekeepers, automatic
fountain dispensers, vending machines.

•In 1920s, lowered the price for its 12ounce bottle.

• Introduced Teem (1960), Mountain
• Introduced Fanta (1960), Sprite (1961), low- Dew (1964), Diet Pepsi (1964). Worked
calorie Tab (1963).
with bottlers to modernize and improve
services.
• Purchased Minute Maid (fruit juice),
Duncan Foods (coffee, tea, hot chocolate),
•In 1963, launched the ”Pepsi Generation”
Belmont Springs Water.
campaign targeting the youth, which
helped narrow coke’s lead to 2-to-1
• Coke countered “Pepsi Challenge” with
margin.
rebates, price cuts and price discounts.
• In 1974, introduced the “Pepsi
Challenge”.
COCA-COLA

PEPSI-COLA

• In 1978, hike in concentrate price after
securing bottler approval.

• In 1970s, sold concentrate to bottlers
@ 20% lower than coke.

• In 1980, switched from sugar to lowerpriced high fructose corn soup.

•Merged with Frito-lay in 1965.

• Increased advertising expenditure.

• In 1978, 15% increase in price of
concentrate.

• Sold off most of non-CSD businesses
i.e. wine, coffee, tea etc.

• Emulated the move of fructose corn
soup in 1983.

• Introduced Diet Coke in 1982 – huge
success.

• Increased advertising expenditure.

• Change in formula in 1985 – major
setback. Reintroduced original formula
in the name of Coca-Cola Classic after 3
months.
• In 80s, introduced 11 new CSD brands.

• In 80s, introduced 13 new CSD
products.
COCA-COLA
• In 1980, refranchised bottling
operations-helped in expansion.

PEPSI-COLA
• In late 80s, acquired MEI bottling,
Grand Metropolitan’s bottling
operations and General Cinima’s
bottling operations.

•Created independent bottling
subsidiary, Coca-Cola Enterprises (CCE)
in 1986.
• In 1999, created Pepsi Bottling Group
(PBG).
•Employed low-price strategy.
• Marketing agreements with celebs Harry Potter .
• Marketing agreements with celebs –
Britney Spears, Jackson.
• Introduced PowerAde, Nestea, Dasani
in 1998, 1999 in response to Pepsi.
• By end of 90s, reintroduced “Pepsi
Challenge”.
• Started acquiring international
markets in more structured way.
• Non-Cola Beverages – introduced
Aquafina (1998), Tropicana (1998),
Gatorade and SoBe (2000).
• Started acquiring international
markets in more structured way.
SWOT ANALYSIS OF COCA-COLA
STRENGTHS
• First mover advantage.
• More loyal customer base.
• Large market share.
• Economies of Scale.
• International Brand recognition.
• Huge distribution network.
• Strategic move during world wars.
• Success of diet coke.
• Efficient global operations

WEAKNESS
• Moving away from core competencies.
•Brand Failures
•Product Recalls

OPPORTUNITIES
• Entry into new developing
international markets.
• Introduction of newer brands.
• Innovative advertising strategies.

THREATS
• Barriers of entry in international
markets.
• New age beverages.
• Fierce competitors in local markets;
Private labels at low prices.
SWOT ANALYSIS OF PEPSI-COLA
STRENGTHS
• Guerrilla Marketing strategies.
• More focus on young generation.
•Economies of Scale.
• International Brand recognition.
• Huge distribution network.
• Innovative advertising strategies.
• More flexible franchise network.

WEAKNESS
• Smaller market than Coke.
• Slower take off in international
markets.
• Imitation of Coca-Cola.
•Falling Behind in All-embracing
Markets, namely Russia, Venezuela, and
South America.

OPPORTUNITIES
• Introduction of “Pepsi Health Drink”.
• Image of “Total Beverage Company”
• Entry new developing international
markets.
• Introduction of newer brands.

THREATS
• Fear of losing market share due to
rapid market fluctuations.
• Barriers of entry in international
markets.
• Decreasing brand loyalty among
consumers.
• New age beverages.
• Fierce competitors in local markets;
Private labels at low prices.
PORTERS FIVE FORCE ANALYSIS – SOFT
DRINK INDUSTRY
 Industry Competitors
 Coca-Cola, Pepsi-Cola, Cadbury Schweppes and

others.
 Threat of New Entrants
 High entry costs
 High risk for entrants due to diversified nature of

Coke and Pepsi.
 Government Policy regulations.
 Existing Loyal customer base.
 Acquisition of major bottling units by existing firms,
increases the entry barriers.
 Threat of substitutes
 Non-CSD drinks like milk, alcoholic beverages, juices, sports
drinks, tea-based, dairy-based drinks
 Threat of saturation of consumption in US market thereby leading to
increase in the consumption of on-Cola beverages.
 Bargaining power of suppliers
 Low switching costs.
 Huge number of suppliers.
 Maintaining the quality and flexibility of supply chain through
backward integration i.e. acquiring bottling plants.
 Bargaining power of buyers.
 Higher buying power – large grocers, discount stores and restaurants
buy large volumes demanding a lower price.
 Choice of customers is high due to competition and variety in the
market.
U.S. Non-Alcoholic Beverage Market Share, %
share by volume
Company

2005

2009

2011

Coca-Cola

30%

42.8% 43%

Pepsi-Cola

22.6% 31.1%

31%

Cadbury Schweppes

10.6% 15%

18%

Other

36.9% 11.1%

8%
CURRENT FINANCIALS
Coca-Cola

Pepsi-Cola

Market Cap

154.38b

100.48b

Revenue Growth

5.20%

11.03%

Profit Margin

14.98%

7.02%

0.55

0.52

Beta

Source: http://ycharts.com/companies/KO
Coke VS Pepsi Share price
ISSUES TO PONDER for Pepsi
 Hard to differentiate products in terms of taste as

product variety is very much limited within cola
beverages.
 Coca-Cola has much stronger loyal customer base.
 Consumer market moving from carbonated drinks
towards functional soft drinks.
 In US, Cadbury Schweppes competing
aggressively.
RECOMMENDATIONS
 For Pepsi to grab the major pie,
 It needs to follow the “Cost Leadership” and

“Product Differentiation” Strategies.
 i.e. it needs to create a unique customer perception
and differentiate one product from another.
 Rather than being a price follower, it must face the
market by a leading strategy of Price Setter, which can
be made possible by improving the production
efficiencies and reducing the bottlenecks.
 It also needs to focus on strengthening its core
competency.
THANK YOU


Smcolawarscontinue group-6-130110121158-phpapp01

  • 1.
    COLA WARS CONTINUE:COKE AND PEPSI IN THE TWENTY-FIRST CENTURY By, Group 6 G. VAIBHAV KUMAR REDDY (P111012) P. PRAVEEN (P111033) PRAGYA JAISWAL (P111037) RAKESH NAVAL (P111039) GREAT LAKES INSTITUTE OF ENERGY MANAGEMENT AND RESEARCH, GURGOAN
  • 2.
  • 3.
    CONCENTRATE PRODUCER AND BOTTLERS ConcentrateProducer 1993 Net Sales Dollars per Case Bottler Percent of Total Dollars per Case Percent of Total 0.66 100% 2.99 100% Cost of sales 0.11 17% 1.69 57% Gross profit 0.55 83% 1.30 43% Selling and delivery 0.01 2% 0.85 28% Advertising and marketing 0.26 39% 0.05 2% General and administrative 0.05 13% 0.13 4% Pretax profit 0.23 29% 0.27 9%
  • 4.
    Concentrate Producer 2000 Bottler Dollars per Case Percentof Total Dollars per Case Percent of Total Net Sales 0.71 100% 5.80 100% Cost of sales 0.12 17% 3.77 65% Gross profit 0.59 83% 2.03 35% Selling and delivery 0.01 2% 1.22 21% Advertising and marketing 0.28 39% 0.12 2% General and administrative 0.06 8% 0.23 4% Pretax profit 0.25 35% 0.52 9%
  • 5.
    RETAIL CHANNELS % ofIndustry Volume Coca-Cola 1993 2000 Pepsi-Cola Coca-Cola Pepsi-Cola Food Stores 32.8% 28.5% 36.1% 32.2% Convenience and Gas 29.6% 37.4% 35.7% 41.5% Fountain 58.9% 27% 65% 21% Vending 48.6% 40.6% 50% 40% Other 45.4% 32.5% 35.5% 33.3% Total 40.7% 31.3% 44.1% 31.4%
  • 6.
    STRATEGIC PATH COCA-COLA PEPSI-COLA • Franchisebottling system , reaching 370 franchises by 1910 • Franchise bottling system , reaching 270 franchises by 1910 • During 1920s and 30s, introduction of open-top coolers to storekeepers, automatic fountain dispensers, vending machines. •In 1920s, lowered the price for its 12ounce bottle. • Introduced Teem (1960), Mountain • Introduced Fanta (1960), Sprite (1961), low- Dew (1964), Diet Pepsi (1964). Worked calorie Tab (1963). with bottlers to modernize and improve services. • Purchased Minute Maid (fruit juice), Duncan Foods (coffee, tea, hot chocolate), •In 1963, launched the ”Pepsi Generation” Belmont Springs Water. campaign targeting the youth, which helped narrow coke’s lead to 2-to-1 • Coke countered “Pepsi Challenge” with margin. rebates, price cuts and price discounts. • In 1974, introduced the “Pepsi Challenge”.
  • 7.
    COCA-COLA PEPSI-COLA • In 1978,hike in concentrate price after securing bottler approval. • In 1970s, sold concentrate to bottlers @ 20% lower than coke. • In 1980, switched from sugar to lowerpriced high fructose corn soup. •Merged with Frito-lay in 1965. • Increased advertising expenditure. • In 1978, 15% increase in price of concentrate. • Sold off most of non-CSD businesses i.e. wine, coffee, tea etc. • Emulated the move of fructose corn soup in 1983. • Introduced Diet Coke in 1982 – huge success. • Increased advertising expenditure. • Change in formula in 1985 – major setback. Reintroduced original formula in the name of Coca-Cola Classic after 3 months. • In 80s, introduced 11 new CSD brands. • In 80s, introduced 13 new CSD products.
  • 8.
    COCA-COLA • In 1980,refranchised bottling operations-helped in expansion. PEPSI-COLA • In late 80s, acquired MEI bottling, Grand Metropolitan’s bottling operations and General Cinima’s bottling operations. •Created independent bottling subsidiary, Coca-Cola Enterprises (CCE) in 1986. • In 1999, created Pepsi Bottling Group (PBG). •Employed low-price strategy. •Employed low-price strategy. • Marketing agreements with celebs Harry Potter . • Marketing agreements with celebs – Britney Spears, Jackson. • Introduced PowerAde, Nestea, Dasani in 1998, 1999 in response to Pepsi. • By end of 90s, reintroduced “Pepsi Challenge”. • Started acquiring international markets in more structured way. • Non-Cola Beverages – introduced Aquafina (1998), Tropicana (1998), Gatorade and SoBe (2000). • Started acquiring international markets in more structured way.
  • 9.
    SWOT ANALYSIS OFCOCA-COLA STRENGTHS • First mover advantage. • More loyal customer base. • Large market share. • Economies of Scale. • International Brand recognition. • Huge distribution network. • Strategic move during world wars. • Success of diet coke. • Efficient global operations WEAKNESS • Moving away from core competencies. •Brand Failures •Product Recalls OPPORTUNITIES • Entry into new developing international markets. • Introduction of newer brands. • Innovative advertising strategies. THREATS • Barriers of entry in international markets. • New age beverages. • Fierce competitors in local markets; Private labels at low prices.
  • 10.
    SWOT ANALYSIS OFPEPSI-COLA STRENGTHS • Guerrilla Marketing strategies. • More focus on young generation. •Economies of Scale. • International Brand recognition. • Huge distribution network. • Innovative advertising strategies. • More flexible franchise network. WEAKNESS • Smaller market than Coke. • Slower take off in international markets. • Imitation of Coca-Cola. •Falling Behind in All-embracing Markets, namely Russia, Venezuela, and South America. OPPORTUNITIES • Introduction of “Pepsi Health Drink”. • Image of “Total Beverage Company” • Entry new developing international markets. • Introduction of newer brands. THREATS • Fear of losing market share due to rapid market fluctuations. • Barriers of entry in international markets. • Decreasing brand loyalty among consumers. • New age beverages. • Fierce competitors in local markets; Private labels at low prices.
  • 11.
    PORTERS FIVE FORCEANALYSIS – SOFT DRINK INDUSTRY  Industry Competitors  Coca-Cola, Pepsi-Cola, Cadbury Schweppes and others.  Threat of New Entrants  High entry costs  High risk for entrants due to diversified nature of Coke and Pepsi.  Government Policy regulations.  Existing Loyal customer base.  Acquisition of major bottling units by existing firms, increases the entry barriers.
  • 12.
     Threat ofsubstitutes  Non-CSD drinks like milk, alcoholic beverages, juices, sports drinks, tea-based, dairy-based drinks  Threat of saturation of consumption in US market thereby leading to increase in the consumption of on-Cola beverages.  Bargaining power of suppliers  Low switching costs.  Huge number of suppliers.  Maintaining the quality and flexibility of supply chain through backward integration i.e. acquiring bottling plants.  Bargaining power of buyers.  Higher buying power – large grocers, discount stores and restaurants buy large volumes demanding a lower price.  Choice of customers is high due to competition and variety in the market.
  • 13.
    U.S. Non-Alcoholic BeverageMarket Share, % share by volume Company 2005 2009 2011 Coca-Cola 30% 42.8% 43% Pepsi-Cola 22.6% 31.1% 31% Cadbury Schweppes 10.6% 15% 18% Other 36.9% 11.1% 8%
  • 14.
    CURRENT FINANCIALS Coca-Cola Pepsi-Cola Market Cap 154.38b 100.48b RevenueGrowth 5.20% 11.03% Profit Margin 14.98% 7.02% 0.55 0.52 Beta Source: http://ycharts.com/companies/KO
  • 15.
    Coke VS PepsiShare price
  • 16.
    ISSUES TO PONDERfor Pepsi  Hard to differentiate products in terms of taste as product variety is very much limited within cola beverages.  Coca-Cola has much stronger loyal customer base.  Consumer market moving from carbonated drinks towards functional soft drinks.  In US, Cadbury Schweppes competing aggressively.
  • 17.
    RECOMMENDATIONS  For Pepsito grab the major pie,  It needs to follow the “Cost Leadership” and “Product Differentiation” Strategies.  i.e. it needs to create a unique customer perception and differentiate one product from another.  Rather than being a price follower, it must face the market by a leading strategy of Price Setter, which can be made possible by improving the production efficiencies and reducing the bottlenecks.  It also needs to focus on strengthening its core competency.
  • 18.

Editor's Notes

  • #9 During 60s, Coke wrongly believed that US market has saturated at 22.7 gallons per capita, which paved way for Pepsi to double its share.