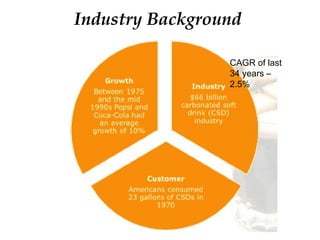
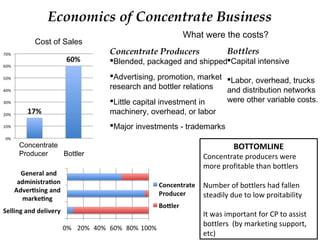
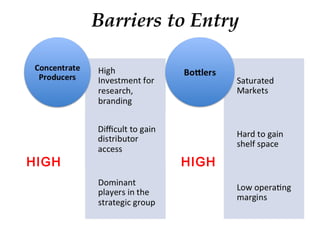
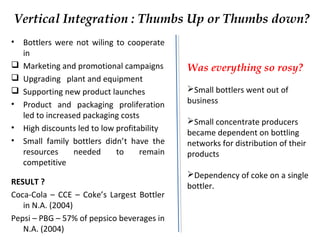
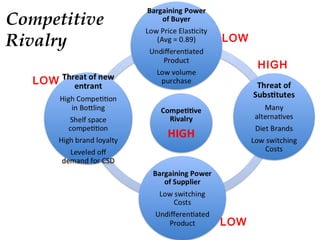
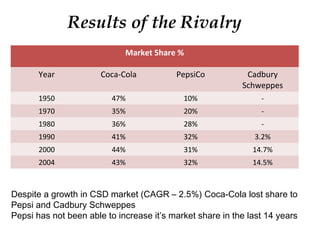
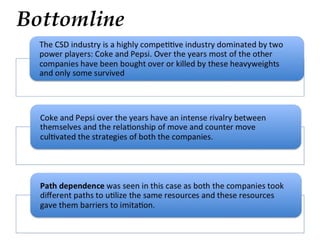
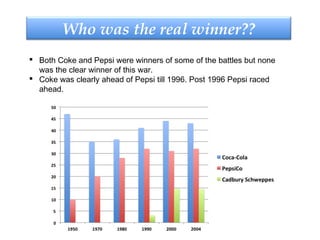
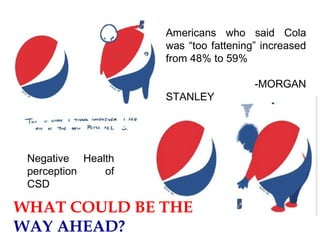
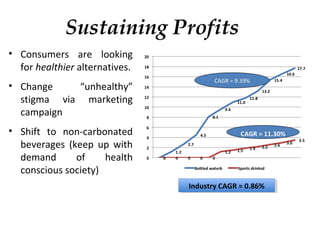
Cola Wars Continue:
Coke and Pepsi in 2006
Presented by:
Group 1
January 22, 2015
Industry Background
CAGR of last
34 years –
2.5%
Economics of Concentrate Business
Cost of Sales
Concentrate
Producer Bottler
Concentrate Producers
Blended, packaged and shipped
Advertising, promotion, market
research and bottler relations
Little capital investment in
machinery, overhead, or labor
Major investments - trademarks
Bottlers
Capital intensive
Labor, overhead, trucks
and distribution networks
were other variable costs.
What were the costs?
BOTTOMLINE
Concentrate producers were
more profitable than bottlers
Number of bottlers had fallen
steadily due to low proitability
It was important for CP to assist
bottlers (by marketing support,
etc)
HIGH HIGH
Barriers to Entry
Vertical Integration : Thumbs Up or Thumbs down?
• Bottlers were not wiling to cooperate
in
 Marketing and promotional campaigns
 Upgrading plant and equipment
 Supporting new product launches
• Product and packaging proliferation
led to increased packaging costs
• High discounts led to low profitability
• Small family bottlers didn’t have the
resources needed to remain
competitive
RESULT ?
Coca-Cola – CCE – Coke’s Largest Bottler
in N.A. (2004)
Pepsi – PBG – 57% of pepsico beverages in
N.A. (2004)
Was everything so rosy?
Small bottlers went out of
business
Small concentrate producers
became dependent on bottling
networks for distribution of their
products
Dependency of coke on a single
bottler.
Competitive
Rivalry
LOW
HIGH
LOW
LOW
Market Share %
Year Coca-Cola PepsiCo Cadbury
Schweppes
1950 47% 10% -
1970 35% 20% -
1980 36% 28% -
1990 41% 32% 3.2%
2000 44% 31% 14.7%
2004 43% 32% 14.5%
Results of the Rivalry
Despite a growth in CSD market (CAGR – 2.5%) Coca-Cola lost share to
Pepsi and Cadbury Schweppes
Pepsi has not been able to increase it’s market share in the last 14 years
Bottomline
Marketing Mix
PRODUCT
Coke introduced 11 and pepsi 13 products to meet the rapidly
changing consumer preferences.
Both Coke and Pepsi introduced new cola and non cola flavours
such as Fanta, Sprite, Mountain Dew, etc.
They also ventured into non-CSD such as fruit juices and
mineral water to capture the health aware consumers.
Coke introduced Diet coke and Coca Cola Zero while Pepsi
launched Diet Pepsi as a low calorie variant of their CSDs. They
launched energy drinks also.
Product packaging also varied ranging from small cans meant
for single use to large PET bottles meant for family usage.
PRICE
 Both Coke and Pepsi discounted their retail prices to be in
competition.
 Bottlers followed low cost strategy to retain customer relations.
 Special discounts to mass merchandisers.
 Initially Coke followed a fixed price model but later they
established a maximum price and adjusted price quarterly
according to changes in sweetener pricing.
 In 2003 they switched to Incidence Pricing which varied
concentrated prices based on different channels & packages.
 Pepsi followed Concentrate pricing based on consumer price
index.
Marketing Mix
Pepsi Focused on sales
through retail stores while Coke
aced in fountain sales.
Both the companies expanded
their distribution network by
expending in restaurant
business. Pepsi acquired Pizza
Hut, Taco Bell and KFC whereas
Coke tied up with Burger King
and McDonalds.
Marketing Mix
PLACE
PROMOTION
The general promotional strategy used by both Pepsi and Coke
were retail price cuts and advertisements.
Pepsi launched two very successful campaign callled Pepsi
Generation and Pepsi challenge.
Cokes advertisements indirectly recognised competitors with
taglines such as Americans Preferred taste and No wonder coke
refreshes best.
Marketing Mix
Who was the real winner??
 Both Coke and Pepsi were winners of some of the battles but none
was the clear winner of this war.
 Coke was clearly ahead of Pepsi till 1996. Post 1996 Pepsi raced
ahead.
Americans who said Cola
was “too fattening” increased
from 48% to 59%
-MORGAN
STANLEY
Negative Health
perception of
CSD
WHAT COULD BE THE
WAY AHEAD?
Sustaining Profits
• Consumers are looking
for healthier alternatives.
• Change “unhealthy”
stigma via marketing
campaign
• Shift to non-carbonated
beverages (keep up with
demand of health
conscious society)
Industry CAGR = 0.86%Industry CAGR = 0.86%
Cola Wars Continues - 2006

Cola Wars Continues - 2006

  • 1.
    Cola Wars Continue: Cokeand Pepsi in 2006 Presented by: Group 1 January 22, 2015
  • 2.
    Industry Background CAGR oflast 34 years – 2.5%
  • 3.
    Economics of ConcentrateBusiness Cost of Sales Concentrate Producer Bottler Concentrate Producers Blended, packaged and shipped Advertising, promotion, market research and bottler relations Little capital investment in machinery, overhead, or labor Major investments - trademarks Bottlers Capital intensive Labor, overhead, trucks and distribution networks were other variable costs. What were the costs? BOTTOMLINE Concentrate producers were more profitable than bottlers Number of bottlers had fallen steadily due to low proitability It was important for CP to assist bottlers (by marketing support, etc)
  • 4.
  • 5.
    Vertical Integration :Thumbs Up or Thumbs down? • Bottlers were not wiling to cooperate in  Marketing and promotional campaigns  Upgrading plant and equipment  Supporting new product launches • Product and packaging proliferation led to increased packaging costs • High discounts led to low profitability • Small family bottlers didn’t have the resources needed to remain competitive RESULT ? Coca-Cola – CCE – Coke’s Largest Bottler in N.A. (2004) Pepsi – PBG – 57% of pepsico beverages in N.A. (2004) Was everything so rosy? Small bottlers went out of business Small concentrate producers became dependent on bottling networks for distribution of their products Dependency of coke on a single bottler.
  • 6.
  • 7.
    Market Share % YearCoca-Cola PepsiCo Cadbury Schweppes 1950 47% 10% - 1970 35% 20% - 1980 36% 28% - 1990 41% 32% 3.2% 2000 44% 31% 14.7% 2004 43% 32% 14.5% Results of the Rivalry Despite a growth in CSD market (CAGR – 2.5%) Coca-Cola lost share to Pepsi and Cadbury Schweppes Pepsi has not been able to increase it’s market share in the last 14 years
  • 8.
  • 9.
    Marketing Mix PRODUCT Coke introduced11 and pepsi 13 products to meet the rapidly changing consumer preferences. Both Coke and Pepsi introduced new cola and non cola flavours such as Fanta, Sprite, Mountain Dew, etc. They also ventured into non-CSD such as fruit juices and mineral water to capture the health aware consumers. Coke introduced Diet coke and Coca Cola Zero while Pepsi launched Diet Pepsi as a low calorie variant of their CSDs. They launched energy drinks also. Product packaging also varied ranging from small cans meant for single use to large PET bottles meant for family usage.
  • 10.
    PRICE  Both Cokeand Pepsi discounted their retail prices to be in competition.  Bottlers followed low cost strategy to retain customer relations.  Special discounts to mass merchandisers.  Initially Coke followed a fixed price model but later they established a maximum price and adjusted price quarterly according to changes in sweetener pricing.  In 2003 they switched to Incidence Pricing which varied concentrated prices based on different channels & packages.  Pepsi followed Concentrate pricing based on consumer price index. Marketing Mix
  • 11.
    Pepsi Focused onsales through retail stores while Coke aced in fountain sales. Both the companies expanded their distribution network by expending in restaurant business. Pepsi acquired Pizza Hut, Taco Bell and KFC whereas Coke tied up with Burger King and McDonalds. Marketing Mix PLACE
  • 12.
    PROMOTION The general promotionalstrategy used by both Pepsi and Coke were retail price cuts and advertisements. Pepsi launched two very successful campaign callled Pepsi Generation and Pepsi challenge. Cokes advertisements indirectly recognised competitors with taglines such as Americans Preferred taste and No wonder coke refreshes best. Marketing Mix
  • 13.
    Who was thereal winner??  Both Coke and Pepsi were winners of some of the battles but none was the clear winner of this war.  Coke was clearly ahead of Pepsi till 1996. Post 1996 Pepsi raced ahead.
  • 14.
    Americans who saidCola was “too fattening” increased from 48% to 59% -MORGAN STANLEY Negative Health perception of CSD WHAT COULD BE THE WAY AHEAD?
  • 15.
    Sustaining Profits • Consumersare looking for healthier alternatives. • Change “unhealthy” stigma via marketing campaign • Shift to non-carbonated beverages (keep up with demand of health conscious society) Industry CAGR = 0.86%Industry CAGR = 0.86%