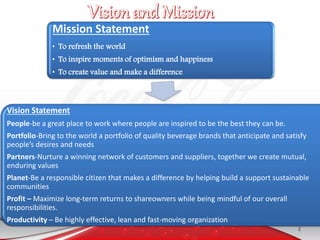
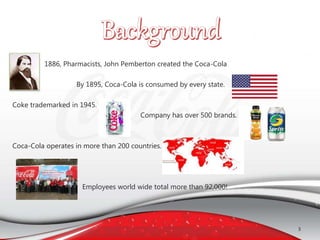
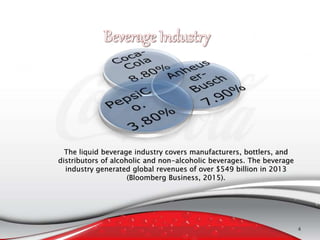
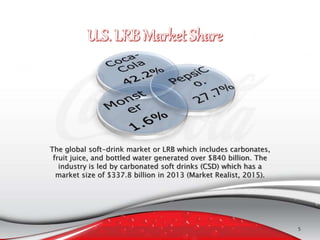
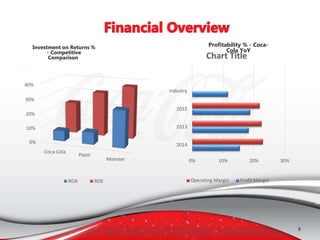
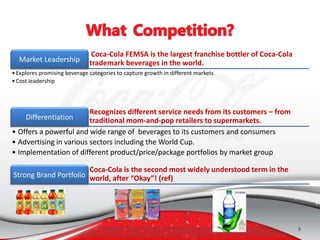
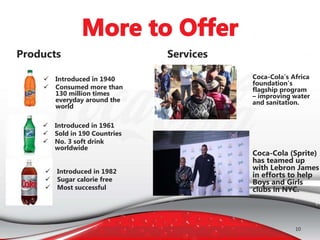
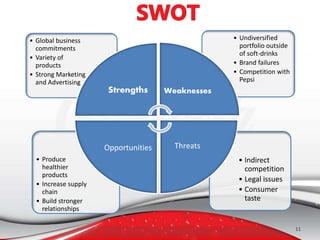
Presentation Presented by:
Dynamic Inc.
Mackler, Janice
Shaffer, Matthew
Turner, William
Wade, Christy
Wells, Tanisha
Whitney, Melissa
1
Mission Statement
• To refresh the world
• To inspire moments of optimism and happiness
• To create value and make a difference
Vision Statement
People-be a great place to work where people are inspired to be the best they can be.
Portfolio-Bring to the world a portfolio of quality beverage brands that anticipate and satisfy
people’s desires and needs
Partners-Nurture a winning network of customers and suppliers, together we create mutual,
enduring values
Planet-Be a responsible citizen that makes a difference by helping build a support sustainable
communities
Profit – Maximize long-term returns to shareowners while being mindful of our overall
responsibilities.
Productivity – Be highly effective, lean and fast-moving organization
2
1886, Pharmacists, John Pemberton created the Coca-Cola
By 1895, Coca-Cola is consumed by every state.
Coke trademarked in 1945.
Company has over 500 brands.
Coca-Cola operates in more than 200 countries.
Employees world wide total more than 92,000!
3
The liquid beverage industry covers manufacturers, bottlers, and
distributors of alcoholic and non-alcoholic beverages. The beverage
industry generated global revenues of over $549 billion in 2013
(Bloomberg Business, 2015).
4
The global soft-drink market or LRB which includes carbonates,
fruit juice, and bottled water generated over $840 billion. The
industry is led by carbonated soft drinks (CSD) which has a
market size of $337.8 billion in 2013 (Market Realist, 2015).
5
Carbonate Soft Drinks
• Regular Soft Drinks –
68.6%
• Diet Soft Drinks – 26.3%
Functional Beverages
• Energy Drinks – 14.3%
• Sports Drinks – 2.3%
Juice and Water
• Juice drinks – 1.3%
• Water
6
7
Low Entry Barriers
Low Capital
Requirement
Lower Pricing
Supermarkets
Convenience
stores
Fountain
Vending
Water
Energy Drinks
Juice
Tea
Commodity
Ingredients
Suppliers and
Bottlers
Weak Industry
Suppliers
Independent
Bottlers
Pepsi
Monster
Investment on Returns %
- Competitive
Comparison
Profitability % - Coca-
Cola YoY
0% 10% 20% 30%
2014
2013
2012
Industry
Chart Title
Operating Margin Profit Margin
0%
10%
20%
30%
40%
Coca-Cola
Pepsi
Monster
ROA ROE
8
9
Coca-Cola FEMSA is the largest franchise bottler of Coca-Cola
trademark beverages in the world.Market Leadership
•Explores promising beverage categories to capture growth in different markets
•Cost leadership
Recognizes different service needs from its customers – from
traditional mom-and-pop retailers to supermarkets.Differentiation
• Offers a powerful and wide range of beverages to its customers and consumers
• Advertising in various sectors including the World Cup.
• Implementation of different product/price/package portfolios by market group
Coca-Cola is the second most widely understood term in the
world, after “Okay”! (ref)Strong Brand Portfolio
Products Services
10
 Introduced in 1940
 Consumed more than
130 million times
everyday around the
world
 Introduced in 1961
 Sold in 190 Countries
 No. 3 soft drink
worldwide
 Introduced in 1982
 Sugar calorie free
 Most successful
Coca-Cola’s Africa
foundation’s
flagship program
– improving water
and sanitation.
Coca-Cola (Sprite)
has teamed up
with Lebron James
in efforts to help
Boys and Girls
clubs in NYC.
• Indirect
competition
• Legal issues
• Consumer
taste
• Produce
healthier
products
• Increase supply
chain
• Build stronger
relationships
• Undiversified
portfolio outside
of soft-drinks
• Brand failures
• Competition with
Pepsi
• Global business
commitments
• Variety of
products
• Strong Marketing
and Advertising
Strengths Weaknesses
ThreatsOpportunities
11
Coca Cola
Dasani
Powerade
NOS
-6%
-4%
-2%
0%
2%
4%
6%
8%
10%
0%10%20%30%40%50%60%70%80%90%
MarketGrowth
Relative Market Share
12
Coca Cola is their market
leader in the Cola market
with a astounding 42%
market share but in a
declining market
• Coca Cola is considered a
Cash Cow
NOS is in the largest
growing beverage
segment but it has the
lowest market share of
Coca Cola brands
• NOS in a growing
market but with such
low market share they
remain a Question Mark
Dasani brand bottled water
controls 18% of the market
but is not the leader in
market share
• Dasani with large market
share in a growing market
is close to becoming a
STAR but remain a
Question Mark
Powerade brand sports
drink has a considerable
lower market share from
segment leader Gatorade
but is in a growing market
• Powerade is a Question
Mark but coming close to
a Dog
13
• Promoting
products using
professional
athletes.
• Targeting the
millennials and
teens.
• Alliance with
Monster Beverage
and Keurig Green
Mountain, Inc.
14
Partnerships
Influence
Market
Advertising
New Market Entry
Penetrate Existing
Market
Produce Healthier
Products
• Snacks
• Alcohol
• Joint ventures (Fairlife)
• Increase global
advertising
• Distribute existing
products
• Low Calorie/Less Sugar
• Tea/Water
15
16
• To be completed
17

Coca-Cola_PowerPoint_Presentation

  • 1.
    Presentation Presented by: DynamicInc. Mackler, Janice Shaffer, Matthew Turner, William Wade, Christy Wells, Tanisha Whitney, Melissa 1
  • 2.
    Mission Statement • Torefresh the world • To inspire moments of optimism and happiness • To create value and make a difference Vision Statement People-be a great place to work where people are inspired to be the best they can be. Portfolio-Bring to the world a portfolio of quality beverage brands that anticipate and satisfy people’s desires and needs Partners-Nurture a winning network of customers and suppliers, together we create mutual, enduring values Planet-Be a responsible citizen that makes a difference by helping build a support sustainable communities Profit – Maximize long-term returns to shareowners while being mindful of our overall responsibilities. Productivity – Be highly effective, lean and fast-moving organization 2
  • 3.
    1886, Pharmacists, JohnPemberton created the Coca-Cola By 1895, Coca-Cola is consumed by every state. Coke trademarked in 1945. Company has over 500 brands. Coca-Cola operates in more than 200 countries. Employees world wide total more than 92,000! 3
  • 4.
    The liquid beverageindustry covers manufacturers, bottlers, and distributors of alcoholic and non-alcoholic beverages. The beverage industry generated global revenues of over $549 billion in 2013 (Bloomberg Business, 2015). 4
  • 5.
    The global soft-drinkmarket or LRB which includes carbonates, fruit juice, and bottled water generated over $840 billion. The industry is led by carbonated soft drinks (CSD) which has a market size of $337.8 billion in 2013 (Market Realist, 2015). 5
  • 6.
    Carbonate Soft Drinks •Regular Soft Drinks – 68.6% • Diet Soft Drinks – 26.3% Functional Beverages • Energy Drinks – 14.3% • Sports Drinks – 2.3% Juice and Water • Juice drinks – 1.3% • Water 6
  • 7.
    7 Low Entry Barriers LowCapital Requirement Lower Pricing Supermarkets Convenience stores Fountain Vending Water Energy Drinks Juice Tea Commodity Ingredients Suppliers and Bottlers Weak Industry Suppliers Independent Bottlers Pepsi Monster
  • 8.
    Investment on Returns% - Competitive Comparison Profitability % - Coca- Cola YoY 0% 10% 20% 30% 2014 2013 2012 Industry Chart Title Operating Margin Profit Margin 0% 10% 20% 30% 40% Coca-Cola Pepsi Monster ROA ROE 8
  • 9.
    9 Coca-Cola FEMSA isthe largest franchise bottler of Coca-Cola trademark beverages in the world.Market Leadership •Explores promising beverage categories to capture growth in different markets •Cost leadership Recognizes different service needs from its customers – from traditional mom-and-pop retailers to supermarkets.Differentiation • Offers a powerful and wide range of beverages to its customers and consumers • Advertising in various sectors including the World Cup. • Implementation of different product/price/package portfolios by market group Coca-Cola is the second most widely understood term in the world, after “Okay”! (ref)Strong Brand Portfolio
  • 10.
    Products Services 10  Introducedin 1940  Consumed more than 130 million times everyday around the world  Introduced in 1961  Sold in 190 Countries  No. 3 soft drink worldwide  Introduced in 1982  Sugar calorie free  Most successful Coca-Cola’s Africa foundation’s flagship program – improving water and sanitation. Coca-Cola (Sprite) has teamed up with Lebron James in efforts to help Boys and Girls clubs in NYC.
  • 11.
    • Indirect competition • Legalissues • Consumer taste • Produce healthier products • Increase supply chain • Build stronger relationships • Undiversified portfolio outside of soft-drinks • Brand failures • Competition with Pepsi • Global business commitments • Variety of products • Strong Marketing and Advertising Strengths Weaknesses ThreatsOpportunities 11
  • 12.
  • 13.
    Coca Cola istheir market leader in the Cola market with a astounding 42% market share but in a declining market • Coca Cola is considered a Cash Cow NOS is in the largest growing beverage segment but it has the lowest market share of Coca Cola brands • NOS in a growing market but with such low market share they remain a Question Mark Dasani brand bottled water controls 18% of the market but is not the leader in market share • Dasani with large market share in a growing market is close to becoming a STAR but remain a Question Mark Powerade brand sports drink has a considerable lower market share from segment leader Gatorade but is in a growing market • Powerade is a Question Mark but coming close to a Dog 13
  • 14.
    • Promoting products using professional athletes. •Targeting the millennials and teens. • Alliance with Monster Beverage and Keurig Green Mountain, Inc. 14 Partnerships Influence Market Advertising
  • 15.
    New Market Entry PenetrateExisting Market Produce Healthier Products • Snacks • Alcohol • Joint ventures (Fairlife) • Increase global advertising • Distribute existing products • Low Calorie/Less Sugar • Tea/Water 15
  • 16.
  • 17.
    • To becompleted 17

Editor's Notes

  • #3 To be revised/updated
  • #4 To be completed
  • #8 Reference to be applied
  • #9 Reference to be applied
  • #10 http://www.coca-colafemsa.com/femsa/web/conteudo_en.asp?idioma=1&tipo=27617&conta=44&id=73211#2
  • #11 References *The Coca-Cola Foundation. (n.d.). Retrieved February 6, 2015, from http://www.coca-colacompany.com/our-company/the-coca-cola-foundation *Brands: The Coca-Cola Company. (n.d.). Retrieved February 6, 2015, from http://www.coca-colacompany.com/brands/the-coca-cola-company *Berry, S. (2010, December 19). How Coca-Cola's distribution system works. Retrieved February 6, 2015, from http://www.colalife.org/2010/12/19/how-coca-colas-distribution-system-works/ www.coca-colacompany.com/rain-the-replenish-africa-initiative
  • #12 References *The Coca-Cola Company Reports. (n.d.). Retrieved February 6, 2015, from http://www.coca-colacompany.com/our-company/company-reports *Coca-Cola FEMSA. (n.d.). Retrieved February 6, 2015, from http://www.coca-colafemsa.com/femsa/web/conteudo_en.asp?idioma=1&conta=44&tipo=27617
  • #13 Debating format
  • #14 To be revised
  • #15 http://finance.yahoo.com/news/coca-cola-joint-ventures-set-190549969.html
  • #16 http://finance.yahoo.com/news/coca-cola-joint-ventures-set-190549969.html