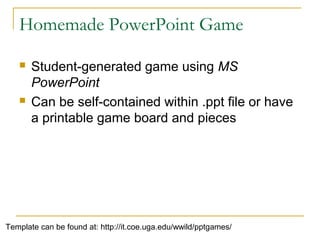
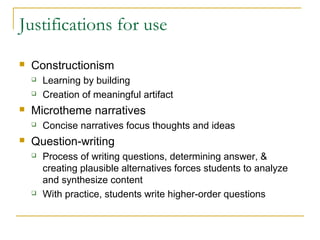
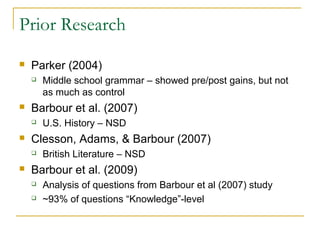
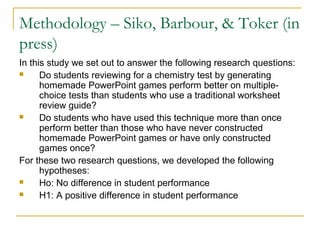
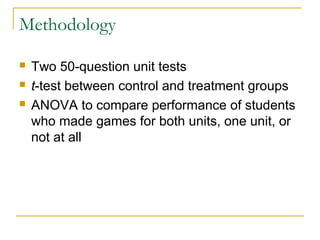
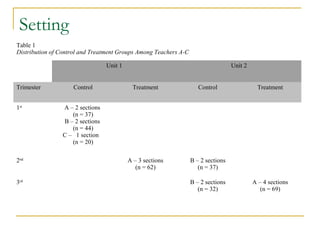
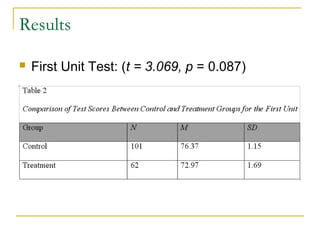
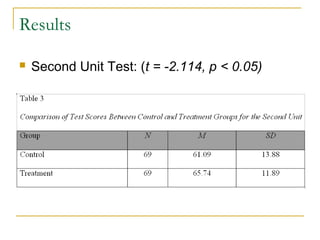
Using PowerPoint as a Game
Design Tool for Science Education


    Jason Siko
    Wayne State University
Homemade PowerPoint Game

      Student-generated game using MS
       PowerPoint
      Can be self-contained within .ppt file or have
       a printable game board and pieces


Template can be found at: http://it.coe.uga.edu/wwild/pptgames/
Justifications for use
   Constructionism
       Learning by building
       Creation of meaningful artifact
   Microtheme narratives
       Concise narratives focus thoughts and ideas
   Question-writing
       Process of writing questions, determining answer, &
        creating plausible alternatives forces students to analyze
        and synthesize content
       With practice, students write higher-order questions
Prior Research
   Parker (2004)
       Middle school grammar – showed pre/post gains, but not
        as much as control
   Barbour et al. (2007)
       U.S. History – NSD
   Clesson, Adams, & Barbour (2007)
       British Literature – NSD
   Barbour et al. (2009)
       Analysis of questions from Barbour et al (2007) study
       ~93% of questions “Knowledge”-level
Methodology – Siko, Barbour, & Toker (in
press)
In this study we set out to answer the following research questions:
     Do students reviewing for a chemistry test by generating
      homemade PowerPoint games perform better on multiple-
      choice tests than students who use a traditional worksheet
      review guide?
     Do students who have used this technique more than once
      perform better than those who have never constructed
      homemade PowerPoint games or have only constructed
      games once?
For these two research questions, we developed the following
      hypotheses:
     Ho: No difference in student performance
     H1: A positive difference in student performance
Methodology

   Two 50-question unit tests
   t-test between control and treatment groups
   ANOVA to compare performance of students
    who made games for both units, one unit, or
    not at all
Setting

   Large Midwestern suburban high school
   Environmental Chemistry course (ACS
    ChemCom curriculum)
       Elective science to meet state requirements
   Trimester system
   3 Teachers
Setting
Table 1
Distribution of Control and Treatment Groups Among Teachers A-C

                                 Unit 1                                            Unit 2


Trimester           Control                Treatment                 Control                 Treatment


1st             A – 2 sections
                   (n = 37)
                B – 2 sections
                   (n = 44)
                C – 1 section
                   (n = 20)

2nd                                       A – 3 sections          B – 2 sections
                                             (n = 62)                (n = 37)

3rd                                                               B – 2 sections            A – 4 sections
                                                                     (n = 32)                  (n = 69)
Results

   Do students reviewing for a chemistry test
    by generating homemade PowerPoint
    games perform better on multiple-choice
    tests than students who use a traditional
    worksheet review guide?
Results

   First Unit Test: (t = 3.069, p = 0.087)
Results

   Second Unit Test: (t = -2.114, p < 0.05)
Results

   Do students who have used this technique
    more than once perform better than those
    who have never constructed homemade
    PowerPoint games or have only constructed
    games once?
Results

   Results of ANOVA (F = 2.286, p = 0.106)
Discussion

   First statistically significant result with
    homemade PowerPoint games
   Largest sample size to date
   More higher-order questions
       Barbour et al. (2009) – 94% Knowledge-level
       Siko (in progress) – 63% Knowledge-level
Second Iteration

   Ongoing throughout 2010-2011
       Same course and content
       Two vs. Three teachers
       Same instrument
       Same research questions
           Plus 1 more…
Alterations to protocol
   No longer a review; throughout unit
       Revisions; increased completion
       Siko et al. (in press)
   Fewer days in the computer lab
       Fatigue and distractions
       Siko et al.; Kafai & Ching (2001)
Alterations to protocol
   More structure
       Due dates for drafts
       Minimum number of higher-order questions
        (~10/5/5)
       Kirschner, Sweller, & Clark (2006); Mayer (2004)
   Drafts and Revisions
       More time to complete, revise, provide feedback
       Lotherington & Ronda (2010)
Second Iteration - Results so far
   First Unit – not as structured
       Same results (Control slightly better, NSD)
   Examined other factors that might influence
    performance
       Quasi-experimental design (placement into control
        or treatment group)
       Prior performance in math and science influence
        chemistry performance
       Tai et al. (2006); Barthel (2001); Andrews &
        Andrews (1979)
Second Iteration - Results so far

   Multiple Regression examining factors
    predicting score on instrument
       Overall GPA, Algebra GPA, Biology GPA, prior
        test performance in class
       Performance on prior tests only statistically
        significant predictors
   Second Unit – more structure
       In progress
Implications

   For practitioners:
       More time than traditional review
       Boundaries on file size, narratives
       Spend more time on questions; less in lab
   Further research:
       Continued analysis of questions
       Project grade vs. Test grade
       Motivational tool (compare low performers)
       Test other justifications
Questions?
Contact Information

   Jason Siko – sikojp@gmail.com
   Michael Barbour – mkbarbour@gmail.com

Using PowerPoint as a game design tool in science education.

  • 1.
    Using PowerPoint asa Game Design Tool for Science Education Jason Siko Wayne State University
  • 2.
    Homemade PowerPoint Game  Student-generated game using MS PowerPoint  Can be self-contained within .ppt file or have a printable game board and pieces Template can be found at: http://it.coe.uga.edu/wwild/pptgames/
  • 3.
    Justifications for use  Constructionism  Learning by building  Creation of meaningful artifact  Microtheme narratives  Concise narratives focus thoughts and ideas  Question-writing  Process of writing questions, determining answer, & creating plausible alternatives forces students to analyze and synthesize content  With practice, students write higher-order questions
  • 4.
    Prior Research  Parker (2004)  Middle school grammar – showed pre/post gains, but not as much as control  Barbour et al. (2007)  U.S. History – NSD  Clesson, Adams, & Barbour (2007)  British Literature – NSD  Barbour et al. (2009)  Analysis of questions from Barbour et al (2007) study  ~93% of questions “Knowledge”-level
  • 5.
    Methodology – Siko,Barbour, & Toker (in press) In this study we set out to answer the following research questions:  Do students reviewing for a chemistry test by generating homemade PowerPoint games perform better on multiple- choice tests than students who use a traditional worksheet review guide?  Do students who have used this technique more than once perform better than those who have never constructed homemade PowerPoint games or have only constructed games once? For these two research questions, we developed the following hypotheses:  Ho: No difference in student performance  H1: A positive difference in student performance
  • 6.
    Methodology  Two 50-question unit tests  t-test between control and treatment groups  ANOVA to compare performance of students who made games for both units, one unit, or not at all
  • 7.
    Setting  Large Midwestern suburban high school  Environmental Chemistry course (ACS ChemCom curriculum)  Elective science to meet state requirements  Trimester system  3 Teachers
  • 8.
    Setting Table 1 Distribution ofControl and Treatment Groups Among Teachers A-C Unit 1 Unit 2 Trimester Control Treatment Control Treatment 1st A – 2 sections (n = 37) B – 2 sections (n = 44) C – 1 section (n = 20) 2nd A – 3 sections B – 2 sections (n = 62) (n = 37) 3rd B – 2 sections A – 4 sections (n = 32) (n = 69)
  • 9.
    Results  Do students reviewing for a chemistry test by generating homemade PowerPoint games perform better on multiple-choice tests than students who use a traditional worksheet review guide?
  • 10.
    Results  First Unit Test: (t = 3.069, p = 0.087)
  • 11.
    Results  Second Unit Test: (t = -2.114, p < 0.05)
  • 12.
    Results  Do students who have used this technique more than once perform better than those who have never constructed homemade PowerPoint games or have only constructed games once?
  • 13.
    Results  Results of ANOVA (F = 2.286, p = 0.106)
  • 14.
    Discussion  First statistically significant result with homemade PowerPoint games  Largest sample size to date  More higher-order questions  Barbour et al. (2009) – 94% Knowledge-level  Siko (in progress) – 63% Knowledge-level
  • 15.
    Second Iteration  Ongoing throughout 2010-2011  Same course and content  Two vs. Three teachers  Same instrument  Same research questions  Plus 1 more…
  • 16.
    Alterations to protocol  No longer a review; throughout unit  Revisions; increased completion  Siko et al. (in press)  Fewer days in the computer lab  Fatigue and distractions  Siko et al.; Kafai & Ching (2001)
  • 17.
    Alterations to protocol  More structure  Due dates for drafts  Minimum number of higher-order questions (~10/5/5)  Kirschner, Sweller, & Clark (2006); Mayer (2004)  Drafts and Revisions  More time to complete, revise, provide feedback  Lotherington & Ronda (2010)
  • 18.
    Second Iteration -Results so far  First Unit – not as structured  Same results (Control slightly better, NSD)  Examined other factors that might influence performance  Quasi-experimental design (placement into control or treatment group)  Prior performance in math and science influence chemistry performance  Tai et al. (2006); Barthel (2001); Andrews & Andrews (1979)
  • 19.
    Second Iteration -Results so far  Multiple Regression examining factors predicting score on instrument  Overall GPA, Algebra GPA, Biology GPA, prior test performance in class  Performance on prior tests only statistically significant predictors  Second Unit – more structure  In progress
  • 20.
    Implications  For practitioners:  More time than traditional review  Boundaries on file size, narratives  Spend more time on questions; less in lab  Further research:  Continued analysis of questions  Project grade vs. Test grade  Motivational tool (compare low performers)  Test other justifications
  • 21.
  • 22.
    Contact Information  Jason Siko – sikojp@gmail.com  Michael Barbour – mkbarbour@gmail.com