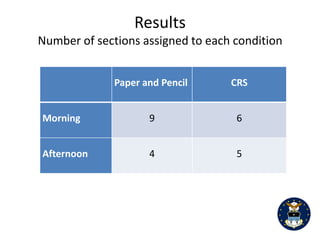
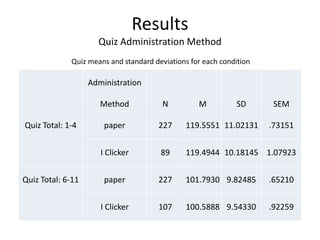
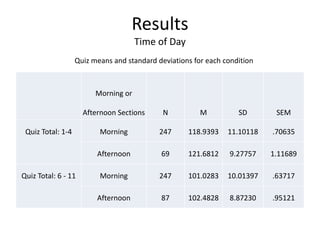
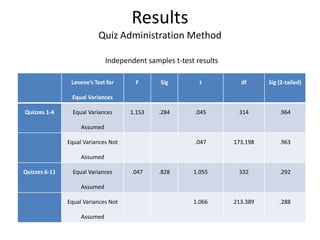
The Effect of Problem-Solving Instructional Strategies on Studentsā Learning ...iosrjce
Ā
This study investigated the use of problems-solving and its effect on student achievement in the mole
concept. Ninety six (96) senior secondary II students were randomly selected form Demonstration Secondary
School, College of Education Azare. The instrument for data collection was 30-item chemistry achievement test
(CAT). The instrument was validated and its reliability determined to be 0.81. Two research questions and two
hypotheses guided the study. The data collected were analyzed using mean and standard deviation to answer the
research questions, while t-test statistics was used to answer the hypotheses at 0.05 level of significance. The
results revealed that student taught using problem-solving performed significantly better than those taught
through lecture method. From the findings chemistry teachers are encouraged to attend seminars/workshops on
problem -solving in order to facilitate the teaching and learning of chemistry in schools.
EFFECTIVENESS OF CO-OPERATIVE LEARNING METHOD IN LEARNING OF MATHEMATICS AMON...Thiyagu K
Ā
Co-operative learning is defined as students working together to āattain groups goals that cannot be obtained by working alone or competitivelyā. The main purpose of co-operative learning is to actively involve students in the learning process, a level of student empowerment which is not possible in a lecture format. The present study found out the effectiveness of co-operative learning in mathematics learning among the eighth standard students of Tirunelveli district. Two equivalent group experimental-designs are employed for this study. The investigator has selected 40 students studying VIII standard in High School, Tirunelveli Educational District. According to the scoring of pre-test, 20 students were chosen as control group and 20 students were chosen as experimental group in a cluster sampling techniques. Finally the investigator concludes that; (a) There was significant difference between control and experimental group students in their gain scores. That is the experimental group student is better than control group students in their gain scores. (b)There was significant difference between control and experimental group students in their gain scores for attainment of the knowledge, understanding, and application objectives.
Effectiveness of Using Circle Geometry (CG-Board) Strategy in Learning Circle...AJHSSR Journal
Ā
ABSTRACT: The study aims to determine the effectiveness of Circle Geometry Board (CG-Board) strategy in learning Circle Geometry towards Form Four studentsā performance. The Nonequivalent Control Group Pretest-Posttest Quasi Experimental design was used. Fifty-two students from two classes were selected using the cluster probability sampling and were divided equally to control and experimental group. A three-week intervention was conducted using prior knowledge test, pre-test and post-test. The independent t-test was used to describe the studentsā performance and the differences between the teaching strategies used. From the analysis, the treatment group studentsā performance gained significantly higher than the control group. The study shows that the CG-Board strategy can improve the effectiveness of teaching and facilitating of Circle Geometry among students.
Human Patient Simulator Network 2012 Presentation: Large Class Simulation in a day
How to successfully design a schedule and perform 2 simulations and debriefings for 120+ senior nursing students with 4 faculty and 4 simulators in a nine hour day.
Effects of Strategic Intervention Material on the Academic Achievements in Ch...neoyen
Ā
Chosen as the Best Thesis for Masters Degree batch 2012
Thesis on Effects of Strategic Intervention Material on the Academic Achievements in Chemistry of Public High School
THE IMPLEMENTATION OF COOPERATIVE LEARNING BY GIVING INITIAL KNOWLEDGE IN COL...susilosudarman42
Ā
Penelitian tentang pemberian pengetahuan awal terhadap proses belajar mengajar melalui model pembelajaran cooperative learning pada materi koloid kimia SMA
Considering the increased learner variance and the failure of the āone-size-fits-allā delivery system, technology differentiated instruction seems to be an ideal solution. This teaching philosophy enables educators to modify curricula, resources, learning tasks and products so as to meet studentsā needs and abilities. In addition, the integration of technology in the foreign language classroom is considered beneficial for the development of studentsā receptive skills; listening and reading comprehension. This study aims at presenting a systematic research conducted in a foreign language school in northern Greece. 100 students, aged 9-11, participated in the research, half of whom received differentiated instruction assisted with technology and constituted the experimental group and the other half, called control group, received traditional, nonādifferentiated instruction without integrating technology. The level of the students was A1-A2 according to the Common European Framework of Reference for Languages (CEFR). Data were collected through a needs analysis questionnaire, an interest inventory, a learning style inventory, a pre-, while-, and post- test. Studentsā performance was determined through the tests. In addition, experimental studentsā performance on listening and reading comprehension was also compared to their age and gender. Findings of the study showed that the experimental group outperformed the control group in terms of their reading and listening scores.
Ash edu 645 week 6 final paper curriculum based summative assessment design (...chrishjennies
Ā
edu 645 week 6 dq 1 standardized testing,edu 645 week 6 dq 2 summary,edu 645 week 6 final paper assessment plans ash edu 645 week 6,ash edu 645 week 6,ash edu 645,ash edu 645 week 6 tutorial,ash edu 645 week 6 assignment,ash edu 645 week 6 help
Performance and duration differences between onlineand paper.docxherbertwilson5999
Ā
Performance and duration differences between online
and paperāpencil tests
Alper Bayazit ā¢ Petek AsĢ§kar
Received: 10 September 2009 / Revised: 2 August 2011 / Accepted: 16 September 2011 / Published online: 9 October 2011
ļæ½ Education Research Institute, Seoul National University, Seoul, Korea 2011
Abstract Digital technologies have been used for mea-
surement purposes and whether the test medium influences
the user is an important issue. The aim of this study is to
investigate studentsā performances and duration differences
between online and paperāpencil tests. An online testing tool
was developed and administered in order to determine the
differences between the traditional paperāpencil tests and
online tests concerning studentsā performances and the
duration on tests. This tool enables to add questions that
utilize an online database and which are in the form of
multiple choice (with 5 or 4 options), trueāfalse, matching,
filling in the blanks, with multiple answers, with short
answers, with long answers, and it also enables to prepare
tests and to turn them into paperāpencil test mode. Perfor-
mance test was applied with both online and paperāpencil
modes on junior students at one of the universities in Turkey.
Besides, the online testing tool developed within the context
of the study was evaluated by instructors with respect to
usability, relevance to the purpose and design. Instructor and
student questionnaires are developed to determine the
opinions on the online testing tool and online tests. Results
showed that there was no significant differences between the
performances on online and paperāpencil tests. On the other
hand, the time they spent on the online test has been longer
than the time they spent on paperāpencil test. Students found
the online testing tool easy to use and stated that online test
medium is more comfortable than paperāpencil tests.
However, they complained about external noises, tiredness,
and focusing problems regarding the online examination
mediums. Generally, instructors have also appreciated the
online testing toolās design and they agree on the fact that it
serves for its purposes.
Keywords Paperāpencil tests ļæ½ Online tests ļæ½
Performance and duration differences
Introduction
It is crucial that evaluation reflect a studentās performance.
However, there might be mistakes with the measurement
within the process of evaluation. These mistakes may
source from the measurement tool. Thus, the media in
which the measurement tool is applied is also important.
Digital technologies have been used not only for learning
but also for measurement purposes. However, it has been a
matter of question to what extend this digital environment
will affect a studentās performance.
In the literature of the online tests, it is possible to see
examples of various studies making comparisons between
different types of tests (paperāpencil tests and online tests),
duration, and the decisi.
Project Opera (Operation Rational): A Tool In Bridging The Learning GAPS In F...AJHSSR Journal
Ā
ABSTRACT : The study was conducted to determine the Mathematical performance of the students. The
study aimed to evaluate the effect of project opera in the mathematical performance of the students during pretest and post-test performance in fractions. The study employed the quasi -experimental one group-pre-test-posttest research design. The paired t-test was employed to establish the existence of significant difference between
pre-and post-test scores in fractions.
How iclicker technology facilitates addiction recovery sessionsclickers2012
Ā
IClickers were used in an addiction recovery program at a homeless shelter. Data indicates that the use of iclickers facilitated the recovery process by promoting self honesty.
1. Is it the same? Using paper & pencil versus a classroom response system for quiz administration
T. Gayle Yamazaki, Gary Packard, Randall Gibb, Edie Edmondson,Douglas Lindsay, Joseph
Sanders, Heidi Schwenn, Scott Walchli,Steve Jones,Lorne Gibson, Kathleen OāDonnell, and
Andrew Katayama
United States Air Force Academy, CO
2. 2
Abstract
Although the perception of taking a quiz via paper-and-pencil vs. taking a quiz via a classroom
response system (CRS) may vary substantially, performance on such quizzes may be less
substantiated than originally perceived. In this experiment, we set out to gather data to
investigate if such perceptions are true regarding quiz-taking methods. We also were interested
in seeing if the time of day (morning vs afternoon quizzes) had any effect on performance. To
evaluate the differences between quiz taking methods and time of day factors, randomly
assigned students to sections were created by the registrarās office. A total of 404 college
freshman enrolled in an introductory psychology class took part in this study. Results indicate
that there is no difference in student quiz performance between traditional paper-and-pencil
method and taking the quiz with CRS. Additionally, there were no differences between morning
and afternoon sections. In conclusion, there appear to be no differences between quiz taking
methods or time of day.
3. 3
Over the past decade, Classroom Response Systems (CRS) have become increasingly
popular in educational settings (Bjorn et al, 2011; Hoekstra, 2008; MacArthur & Jones, 2008;
Zhu, 2007) as well as in medical training settings (Thomas, Monturo, & Conroy, 2011). Not only
are CRS being used for demonstrating concepts (Shaffer & Collura, 2009), they are also being
used for student assessment of course content (Mezeske & Mezeske, 2007; Yourstone, Kraye, &
Albaum, 2008) andfacilitating critical thinking in class (Mollborn & Hoekstra, 2010). The use of
the CRS as an assessment device has prompted some faculty and students to be concerned that
there may be advantages to taking a multiple-choice quiz using paper-and-pencil administration
as compared to using a CRS (Epstein,Klinkenberg & Wiley, 2001). One of the perceived
advantages to using paper-and-pencil administration is that students would be able to refer
back to previously answered questions and be able to change their answers to improve their
overall score. While there have been some studies to support this notion on basic knowledge
and comprehension items on multiple-choice tests (see Geiger, 1997 for a review), the same
was not found on more conceptually based or higher-order items. Further, other studies have
found that two mediating factors that correspond to improved performance may be attributed
to 1) metacognitive factors (e.g., signal detection and discrimination) and 2) timed-responses
(the method used in the present study) more than changing answers with respect to the
proportion of correct responses (Hanna, 2010; Higham & Gerrard, 2005).On the other hand,
some researchers contend that this perception can be mediated by allowing students to change
their responses on the clicker device within the prescribed time limit set by the instructor
(Caldwell, 2007; Croupch, Fagen, Callan, & Mazur, 2004). From a historical perspective, Mueller
and Wasser (1977) report that changing responses on objective tests generally lowered
4. 4
studentsā scores. The purpose of our study was to examine whether or not there is a difference
in average student quiz scores when comparing paper-and-pencil administration with CRS
administration of course quizzes. It was expected that there would not be a significant
differences between the administration methods, time of day, and that there would not be an
interaction between the two variables studied.
Method
This was a quasi-experimental study in which all students are assigned by the registrarās
office to each of the 25 course sections of Introductory Psychology. Based on student
extracurricular activities, validation of courses, and placement examinations the registrarās
office place students into sections on a random basis. In other words, students are not allowed
to choose instructors or sections. All participants (N=404) were freshman in college (age range:
17 to 23 years; female=61 and male=343; Ethnic heritage ā European-American=301,
Hispanic/Latino(a)=25 African-American=17, Asian/Pacific Islander=37, Native American, not
specified=20).
Each of the 25 sections of introduction to psychology were divided into the two
administration groups using the following criteria: a) morning versus afternoon course
offerings, b) instructor preference for quiz administration method, and c) balance between the
types of quiz administration.
Number of sections per condition
Eleven Quizzes were administeredthroughout the semester. Each quiz consisted of ten
multiple-choice questions with four answer choices, each question was worth two points for a
total of 20 points per quiz. All students were given the same quiz questions, only the
6. 6
first four quizzes for the CRS and the paper-and-pencil administration groups to assess whether
or not there were any preexisting differences between the groups (baseline measures). As a
result, no significant differences were found t(259)=-1.64, p = 0.102. Leveneās test for equality
of variance met criteria for equal variances.
An Independent samplest-test was used to compare the means for the first four quizzes
for the CRS and the paper-and-pencil administration groups to assess whether or not there was
a difference between mean scores. Table 2 presents the means and standard deviations for the
groups. We found no significant difference between administration methods t(314)=0.45, p =
0.842. An Independent samplest-test was also used to compare the means for quizzes 5-11
between the quiz administration types (CRS vs paper-and-pencil). Again, we found no
significant difference between administration methods t(332) = 1.05, p = 0.292. Table 3
presents the t-table results for group comparisons.
An Independent samples t-test was used to compare the means for the first four quizzes
for the time of day (morning vs. afternoon sections). Table 4 presents the t-test results. We
found no significant difference between time of day for quizzing t(314) = -1.87, p = 0.620. An
Independent sample t-test was used to compare the means for quizzes 5-11 between the times
of day (morning vs. afternoon). Again, we found no significant difference between time of day
the quiz was administered t(332) = -1.19, p = 0.231.
A one way analysis of variance (ANOVA) was conducted to investigate if there was an
interaction between quiz administration group (CRS vs. paper-and pencil) and quiz time of day
(morning vs. afternoon). Results of the ANOVA found no significant interaction, MSE = 94.869, F
(1, 330) = .116, p = .733. Further, a partial eta squared = .002 suggests that the administration
7. 7
type and time of day had a very small interactive effect on the outcome. Table 5 presents the
interaction results.
Conclusion
Although some of our faculty and students believed there was a substantial advantage
to taking quizzes using the paper-and-pencil administration method, the findings of this study
suggest that students score equally well using either method of quiz administration.
In an ever-changing technological environment, it is essential that instructors have some
understanding of the role/impact the introduction of technology may have on student
performance. The findings of this study, suggest that the administration method used to deliver
a quiz (paper-and-pencil or CRS) did not impact the overall student average quiz scores across a
semester. What this suggests is that in cases in which course-wide consistency is an important
factor in course delivery, presentation and administration, the method by which quizzes are
administered can be left to instructor discretion. Instructors who choose to more fully
incorporate the advantages of using a CRS throughout their course will not adversely impact
student performance on quizzes across an academic term. Instructors who prefer to use the
more traditional method of paper-and-pencil can do so as well.
Since there was no differences detected between average scores of student who were
able to change answers (paper-and-pencil) and students who were not allowed to change
answers (CRS), it may be that students are changing just as many answers from incorrect to
correct as they are correct to incorrect. Therefore, it appears that there may be a
misperception among faculty and students that the ability to change answers during a quiz
leads to improved scores. This should be examined further in future studies.
8. 8
Since we allowed instructors to use their own preferred method of quiz delivery, it is unclear
what impact, if any, instructor preference might have on student performance. Although not a
focus of this study, student attitudes toward the CRS closely aligned with known instructor
feelings toward the system. Instructors were explicitly asked to not discuss or indicate to
students their own attitudes about the CRS and they felt they had appropriately withheld their
attitudes and opinions from their students. This observation might suggest that further study
should be done to investigate whether or not instructor attitudes, particularly negative views,
might adversely impact student performance. This line of research would provide needed
insight to those departments and institutions who are examining the additional use of
technology throughout their course offerings.
There were several lessons learned during the administration of this study. First,
Students stated that they would use a later question to help answer earlier questions on the
quiz. If quiz questions are carefully developed to avoid having the answer to one quiz question
embedded within another question this objection to the CRS is negated. Secondly, to the
surprise of some of our faculty, we found that students were very adept at determining the
attitude of the instructor with respect to use of the CRS for quiz administration. Students of
faculty who had unfavorable opinions with regard to the CRS had more negative student
opinions related to CRS use for quizzing. In response, we allowed instructors to select which
administration method they preferred. And finally, having a non-graded practice quiz using the
CRS, as well as various concept demonstrations using the CRS increased student comfort and
confidence in the CRS.
9. 9
References
Bjorn, H. K., Wolter, M. A., Lundeberg, H. K, & Herreid, C. F. (2011). Studentsā perceptions of
using personal response systems (āClickersā) with cases in science. Journal of College
Science Teaching, 40 (4), 14-19.
Caldwell, J. E. (2007). Clickers in the large classroom. CBE-Life Sciences Education 6, 9-20.
Crouch, C. H., Fagan, A. P., Callan, J. P., & Mazur, E. (2004) Classroom demonstrations: Learning
tools or entertainment? American Association of Physics Teachers 72 (6), 835-838.
Duncan, D. (2006). Clickers: A New Teaching Aid with Exceptional Promise. The Astronomy
Education Review, 5 (1), 5-19.
Epstein, J., Klinkenberg, W. D., & Wiley, D. (2001). Insuring sample equivalence across internet
and paper-and-pencil assessments. Computers in Human Behavior, 17, 339-346.
Geiger, M. A. (1997). An examination of the relationship between answer changing,
testwiseness, and exam performance. Journal of Experimental Education, 66 (1), 49-60.
Hanna, G. S. (2010). To change answers or not to change answers: That is the question. The
Clearing House: A Journal of Educational Strategies, Issues, & Ideas, 62 (9), 414-416.
Higham, P. A. & Gerrard, C. (2005). Not all errors are created equal: Metacognition and
changing answers on multiple-choice tests. Canadian Journal of Experimental Psychology,
59 (1), 28-34.
Hoekstra, A. (2008). Vibrant student voices: Exploring effects of the use of clickers in college
courses. Learning, Media, and Technology, 33 (4), 329-341.
MacArthur, J. R., & Jones, L. L. (2008). A review of literature reports of clickers applicable to
college chemistry classrooms. Chemistry Education Research and Practice, 9, 187-195.
10. 10
Mezeske, R. J., & Mezeske, B. A. (Eds). (2007). Beyond tests and quizzes: Creative assessments in
the college classroom. San Francisco: Josey-Bass.
Mollborn, S. A. & Hoekstra, A. (2010). A meeting of minds: Using clickers for critical thinking and
discussion in large sociology classes. Teaching Sociology, 38 (1), 18-27.
Mueller, D. J., & Wasser, V. (1977). Implications of changing answers on objective test items.
Journal of Educational Measurement, 14, 9-13.
Preszler, R. W., Dawe, A., Shuster, CB, & Shuster, M. (2007). Assessment of the effects of
student response systems on student learning and attitudes over a broad range of biology
courses. CBE-Life Sciences Education, 6, 29-41.
Shaffer, D. M., & Collura, M. J. (2009). Evaluating the effectiveness of a personal response
system in the classroom. Teaching of Psychology, 36, 273-277.
Thomas, C. M., Monturao, C., & Conroy, K. M. (2011). Experiences of faculty and students using
an audience response system in the classroom. Computers, Informatics & Nursing, 29 (7),
396-400.
Yourstone, H. S., Kraye, G. A. (2008). Classroom questioning with immediate electronic
response: Do clickers improve learning? Journal of Innovative Education: Decision Sciences,
6 (1), 75-88.
Zhu, E. (2007). Teaching with clickers. Center for Research on Learning and Teaching Occasional
Papers Series, 22, 1-7.
11. 11
Table 1
Number of sections assigned to each condition
Paper and Pencil CRS
Morning 9 6
Afternoon 4 5
12. 12
Table 2
Quiz means and standard deviations for each condition
Quiz Administration Method
Administration Method N M SD SEM
Quiz Total: 1-4 paper 227 119.5551 11.02131 .73151
I Clicker 89 119.4944 10.18145 1.07923
Quiz Total: 6-11 paper 227 101.7930 9.82485 .65210
I Clicker 107 100.5888 9.54330 .92259
Time of Day
Morning or Afternoon
Sections N M SD SEM
Quiz Total: 1-4 Morning 247 118.9393 11.10118 .70635
Afternoon 69 121.6812 9.27757 1.11689
Quiz Total: 6 - 11 Morning 247 101.0283 10.01397 .63717
Afternoon 87 102.4828 8.87230 .95121
13. 13
Table 3
Independent Samples t-test results
Quiz Administration Method
Leveneās Test for F Sig t df Sig (2-tailed)
Equal Variances
Quizzes 1-4 Equal Variances 1.153 .284 .045 314 .964
Assumed
Equal Variances Not .047 173.198 .963
Assumed
Quizzes 6-11 Equal Variances .047 .828 1.055 332 .292
Assumed
Equal Variances Not 1.066 213.389 .288
Assumed
14. 14
Table 4
Independent Samples t-test results
Time of Day
Leveneās Test for F Sig t df Sig (2-tailed)
Equal Variances
Quizzes 1-4 Equal Variances 3.424 .065 -1.876 314 .062
Assumed
Equal Variances Not -2.075 127.630 .040
Assumed
Quizzes 6-11 Equal Variances 1.930 .166 -1.199 332 .231
Assumed
Equal Variances Not -1.270 168.624 .206
Assumed
15. 15
Table 5
ANOVA Table
Quiz Administration Method x Time of Day Interaction
Tests of Between-Subjects Effects
Type III Sum of Partial Eta
Source Squares df Mean Square F Sig. Squared
a
Corrected Model 267.964 3 89.321 .942 .421 .008
Intercept 2406478.679 1 2406478.679 25366.424 .000 .987
AMPM 162.238 1 162.238 1.710 .192 .005
Group 70.509 1 70.509 .743 .389 .002
AMPM * Group 11.022 1 11.022 .116 .733 .002
Error 31306.658 330 94.869
Total 3466236.000 334
Corrected Total 31574.623 333
a. R Squared = .008 (Adjusted R Squared = -.001)