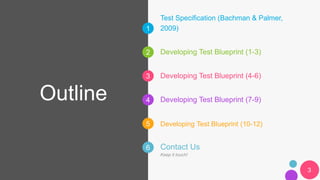
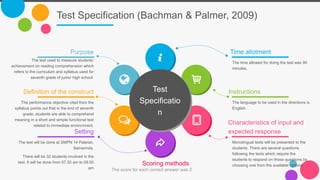
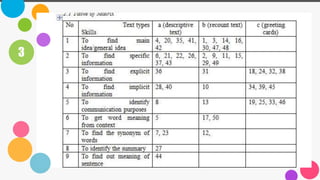
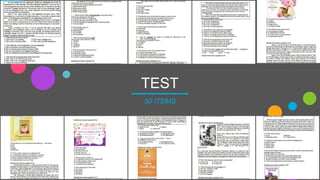
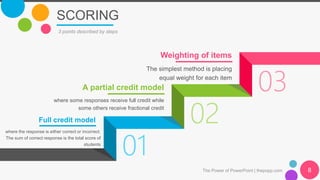
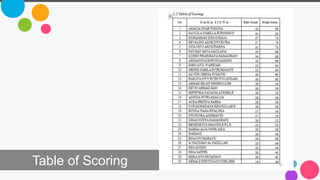
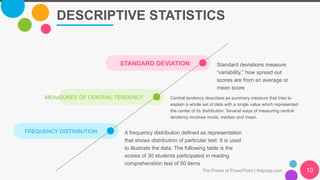
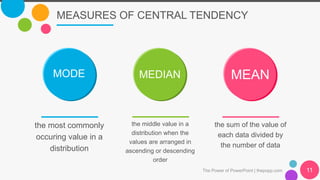
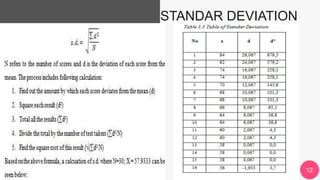
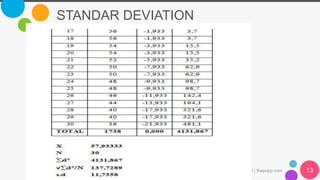
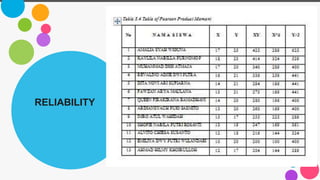
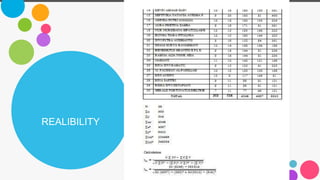
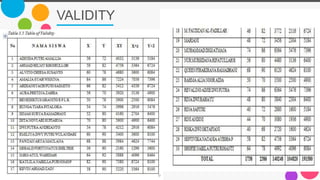
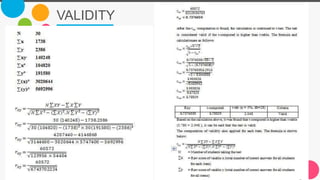
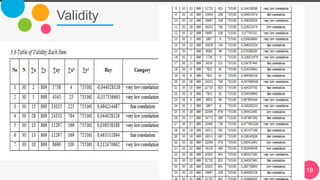
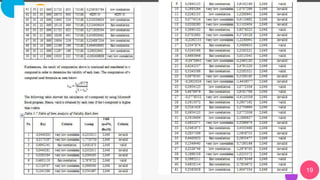
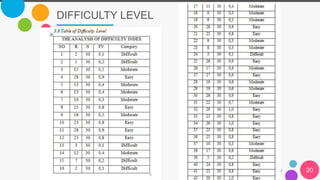
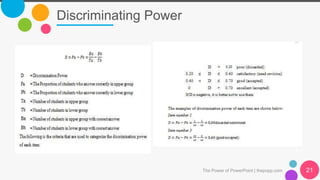
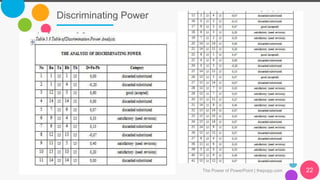
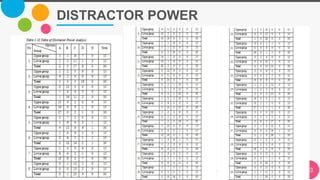
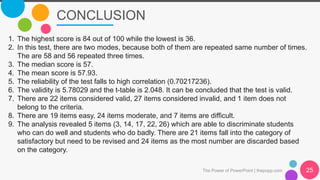
Test Specification
Seventh Grade (Even Semester)
Meet Our Crews
The Power of PowerPoint | thepopp.com
DIANA IRIANTINA YAYUK WAHYUNI
DEVELOPING TEST
BLUEPRINT 4-6
APRILIANTY W.
DEVELOPING TEST
BLUEPRINT 7-9
KARTIKA NATALIA
DEVELOPING TEST
BLUEPRINT 10-12
SN. 1705086027 SN. 1705086014 SN. 1705086025 SN. 1705086019
2
DEVELOPING TEST
BLUEPRINT 1-3
1
2
3
4
5
6
Outline
Test Specification (Bachman & Palmer,
2009)
Contact Us
Keep it touch!
Developing Test Blueprint (1-3)
Developing Test Blueprint (4-6)
Developing Test Blueprint (7-9)
Developing Test Blueprint (10-12)
3
Test Specification (Bachman & Palmer, 2009)
Scoring methods
The score for each correct answer was 2
Time allotment
The time allowed for doing the test was 90
minutes.
Instructions
The language to be used in the directions is
English.
Characteristics of input and
expected response
Monolingual texts will be presented to the
students. There are several questions
following the texts which require the
students to respond on those questions by
choosing one from the available options.
Purpose
The test used to measure students’
achievement on reading comprehension which
refers to the curriculum and syllabus used for
seventh grade of junior high school.
Definition of the construct
The performance objective cited from the
syllabus points out that in the end of seventh
grade, students are able to comprehend
meaning in a short and simple functional text
related to immediate environment.
Setting
The test will be done at SMPN 14 Palaran,
Samarinda.
There will be 32 students involved in the
test. It will be done from 07.30 am to 09.00
am
Test
Specificatio
n
THE CONSTRUCTED TEST
The Power of PowerPoint | thepopp.com 5
1 image and description
Question on the test defines as item in
this paper from which development is
able to proceed when objective is clearly
seen. Item should measure what it
intended to be measured.
it has to measure only a single
objective
3
TEST
50 ITEMS
01
02
03
SCORING
The Power of PowerPoint | thepopp.com 8
3 points described by steps
Full credit model
where the response is either correct or incorrect.
The sum of correct response is the total score of
students
A partial credit model
where some responses receive full credit while
some others receive fractional credit
Weighting of items
The simplest method is placing
equal weight for each item
Table of Scoring
MEAaSURES OF CENTRAL TENDENCY Central tendency describes as summary measure that tries to
explain a whole set of data with a single value which represented
the center of its distribution. Several ways of measuring central
tendency involves mode, median and mean.
DESCRIPTIVE STATISTICS
The Power of PowerPoint | thepopp.com 10
FREQUENCY DISTRIBUTION A frequency distribution defined as representation
that shows distribution of particular test. It is used
to illustrate the data. The following table is the
scores of 30 students participated in reading
comprehenstion test of 50 items
STANDARD DEVIATION Standard deviations measure
“variability,” how spread out
scores are from an average or
mean score
MEASURES OF CENTRAL TENDENCY
The Power of PowerPoint | thepopp.com 11
the most commonly
occuring value in a
distribution
the middle value in a
distribution when the
values are arranged in
ascending or descending
order
the sum of the value of
each data divided by
the number of data
MODE MEDIAN MEAN
The Power of PowerPoint | thepopp.com 12
STANDAR DEVIATION
STANDAR DEVIATION
The Power of PowerPoint | thepopp.com 13
RELIABILITY
REALIBILITY
VALIDITY
VALIDITY
Validity
The Power of PowerPoint | thepopp.com 18
The Power of PowerPoint | thepopp.com 19
DIFFICULTY LEVEL
The Power of PowerPoint | thepopp.com 20
Discriminating Power
The Power of PowerPoint | thepopp.com 21
Discriminating Power
The Power of PowerPoint | thepopp.com 22
DISTRACTOR POWER
The Power of PowerPoint | thepopp.com 23
REVISION OF SAMPLE ITEM
The Power of PowerPoint | thepopp.com 24
Factors in the test
itself:
1 Factors in test
administration and
scoring
3 Nature of the group
and the criterion
5
Functioning content
and teaching
procedures
2
Factors in pupil’s
response
4
CONCLUSION
The Power of PowerPoint | thepopp.com 25
1. The highest score is 84 out of 100 while the lowest is 36.
2. In this test, there are two modes, because both of them are repeated same number of times.
The are 58 and 56 repeated three times.
3. The median score is 57.
4. The mean score is 57.93.
5. The reliability of the test falls to high correlation (0.70217236).
6. The validity is 5.78029 and the t-table is 2.048. It can be concluded that the test is valid.
7. There are 22 items considered valid, 27 items considered invalid, and 1 item does not
belong to the criteria.
8. There are 19 items easy, 24 items moderate, and 7 items are difficult.
9. The analysis revealed 5 items (3, 14, 17, 22, 26) which are able to discriminate students
who can do well and students who do badly. There are 21 items fall into the category of
satisfactory but need to be revised and 24 items as the most number are discarded based
on the category.
Thank You
Any Questions?

Test specification

  • 1.
  • 2.
    Meet Our Crews ThePower of PowerPoint | thepopp.com DIANA IRIANTINA YAYUK WAHYUNI DEVELOPING TEST BLUEPRINT 4-6 APRILIANTY W. DEVELOPING TEST BLUEPRINT 7-9 KARTIKA NATALIA DEVELOPING TEST BLUEPRINT 10-12 SN. 1705086027 SN. 1705086014 SN. 1705086025 SN. 1705086019 2 DEVELOPING TEST BLUEPRINT 1-3
  • 3.
    1 2 3 4 5 6 Outline Test Specification (Bachman& Palmer, 2009) Contact Us Keep it touch! Developing Test Blueprint (1-3) Developing Test Blueprint (4-6) Developing Test Blueprint (7-9) Developing Test Blueprint (10-12) 3
  • 4.
    Test Specification (Bachman& Palmer, 2009) Scoring methods The score for each correct answer was 2 Time allotment The time allowed for doing the test was 90 minutes. Instructions The language to be used in the directions is English. Characteristics of input and expected response Monolingual texts will be presented to the students. There are several questions following the texts which require the students to respond on those questions by choosing one from the available options. Purpose The test used to measure students’ achievement on reading comprehension which refers to the curriculum and syllabus used for seventh grade of junior high school. Definition of the construct The performance objective cited from the syllabus points out that in the end of seventh grade, students are able to comprehend meaning in a short and simple functional text related to immediate environment. Setting The test will be done at SMPN 14 Palaran, Samarinda. There will be 32 students involved in the test. It will be done from 07.30 am to 09.00 am Test Specificatio n
  • 5.
    THE CONSTRUCTED TEST ThePower of PowerPoint | thepopp.com 5 1 image and description Question on the test defines as item in this paper from which development is able to proceed when objective is clearly seen. Item should measure what it intended to be measured. it has to measure only a single objective
  • 6.
  • 7.
  • 8.
    01 02 03 SCORING The Power ofPowerPoint | thepopp.com 8 3 points described by steps Full credit model where the response is either correct or incorrect. The sum of correct response is the total score of students A partial credit model where some responses receive full credit while some others receive fractional credit Weighting of items The simplest method is placing equal weight for each item
  • 9.
  • 10.
    MEAaSURES OF CENTRALTENDENCY Central tendency describes as summary measure that tries to explain a whole set of data with a single value which represented the center of its distribution. Several ways of measuring central tendency involves mode, median and mean. DESCRIPTIVE STATISTICS The Power of PowerPoint | thepopp.com 10 FREQUENCY DISTRIBUTION A frequency distribution defined as representation that shows distribution of particular test. It is used to illustrate the data. The following table is the scores of 30 students participated in reading comprehenstion test of 50 items STANDARD DEVIATION Standard deviations measure “variability,” how spread out scores are from an average or mean score
  • 11.
    MEASURES OF CENTRALTENDENCY The Power of PowerPoint | thepopp.com 11 the most commonly occuring value in a distribution the middle value in a distribution when the values are arranged in ascending or descending order the sum of the value of each data divided by the number of data MODE MEDIAN MEAN
  • 12.
    The Power ofPowerPoint | thepopp.com 12 STANDAR DEVIATION
  • 13.
    STANDAR DEVIATION The Powerof PowerPoint | thepopp.com 13
  • 14.
  • 15.
  • 16.
  • 17.
  • 18.
    Validity The Power ofPowerPoint | thepopp.com 18
  • 19.
    The Power ofPowerPoint | thepopp.com 19
  • 20.
    DIFFICULTY LEVEL The Powerof PowerPoint | thepopp.com 20
  • 21.
    Discriminating Power The Powerof PowerPoint | thepopp.com 21
  • 22.
    Discriminating Power The Powerof PowerPoint | thepopp.com 22
  • 23.
    DISTRACTOR POWER The Powerof PowerPoint | thepopp.com 23
  • 24.
    REVISION OF SAMPLEITEM The Power of PowerPoint | thepopp.com 24 Factors in the test itself: 1 Factors in test administration and scoring 3 Nature of the group and the criterion 5 Functioning content and teaching procedures 2 Factors in pupil’s response 4
  • 25.
    CONCLUSION The Power ofPowerPoint | thepopp.com 25 1. The highest score is 84 out of 100 while the lowest is 36. 2. In this test, there are two modes, because both of them are repeated same number of times. The are 58 and 56 repeated three times. 3. The median score is 57. 4. The mean score is 57.93. 5. The reliability of the test falls to high correlation (0.70217236). 6. The validity is 5.78029 and the t-table is 2.048. It can be concluded that the test is valid. 7. There are 22 items considered valid, 27 items considered invalid, and 1 item does not belong to the criteria. 8. There are 19 items easy, 24 items moderate, and 7 items are difficult. 9. The analysis revealed 5 items (3, 14, 17, 22, 26) which are able to discriminate students who can do well and students who do badly. There are 21 items fall into the category of satisfactory but need to be revised and 24 items as the most number are discarded based on the category.
  • 26.