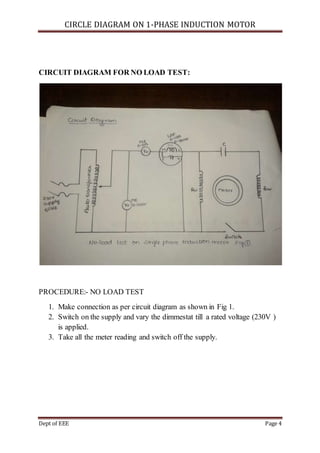
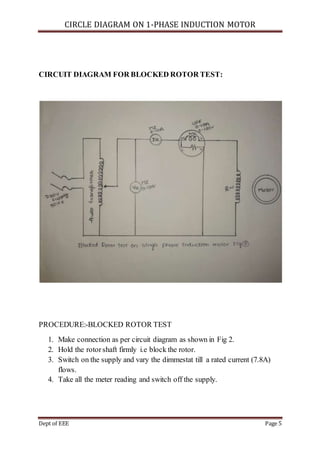
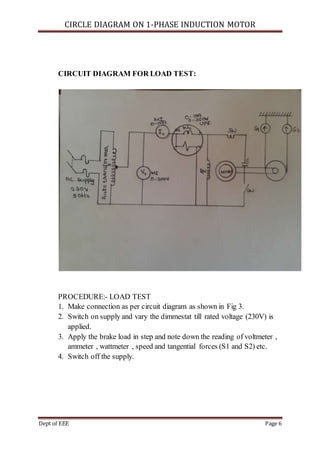
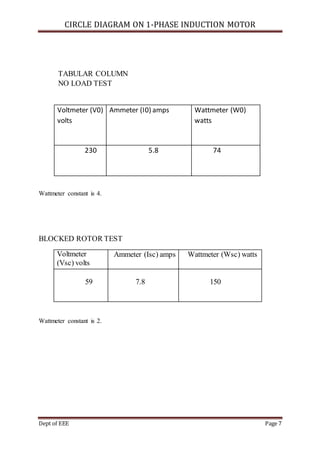
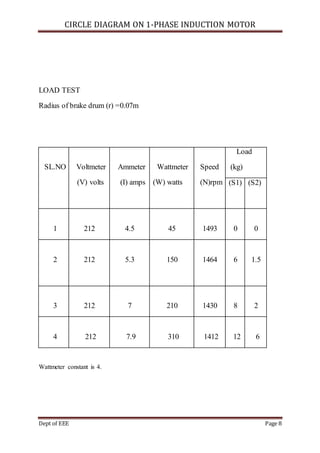
1) The document describes procedures for conducting no-load, blocked rotor, and load tests on a single-phase induction motor to generate a circle diagram. Readings are taken of voltage, current, power, speed, and torque at different test conditions.
2) Calculations are shown to determine values like slip, efficiency, power factor from the circle diagram. However, the conclusion states that the efficiency calculated from the circle diagram does not match that calculated from the load test.
3) It is concluded that circle diagrams are not typically used for single-phase induction motors because the torque values differ between the diagram and actual load testing.

![CIRCLE DIAGRAM ON 1-PHASE INDUCTION MOTOR
Dept of EEE Page 9
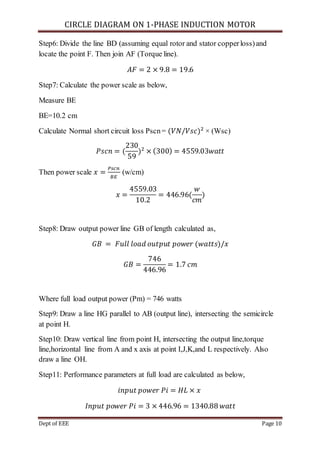
CALCULATION:- (No Load and Block RotorTest)
The circle diagram is drawn by following the below given procedure.
Step1:calculate the No load power factor angle by equation.
𝜃𝑜 = cos−1
[
𝑊𝑜
𝑉𝑜 × 𝐼𝑜
]
𝜃𝑜 = cos−1
[
296
230× 5.8
] = 77.17°
And draw a no load current line OA (Choosecurrent scale) at angle𝜃𝑜
measured from vertical axis.
Step2: Calculate the short circuit power factor angle by equation.
𝜃𝑠𝑐 = cos−1
[
𝑊𝑠𝑐
𝑉𝑠𝑐 × 𝐼𝑠𝑐
]
𝜃𝑠𝑐 = cos−1
[
300
59 × 7.8
] = 49.31°
Calculate normal short circuit current by equation
𝐼𝑠𝑐𝑛 = (
𝑉𝑁
𝑉𝑠𝑐
) × 𝐼𝑠𝑐
𝐼𝑠𝑐 = (
230
59
) × 7.8 = 30.40𝐴
Where, VN = 230V
And draw a normal short circuit line OB at an angle 𝜃𝑠𝑐 measured from the
vertical axis.
Step3: Join A and B called as output line and divide the line and locate point C.
Step4: With C as center point and AC as radius draw a semicircle (point B also
lies on the semicircle).
Step5: Draw a vertical line from point B and locate the point D and E.](https://image.slidesharecdn.com/crcledgrm-180202071618/85/CIRCLE-DIAGRAM-ON-1-PHASE-INDUCTION-MOTOR-9-320.jpg)