Download as PDF, PPTX
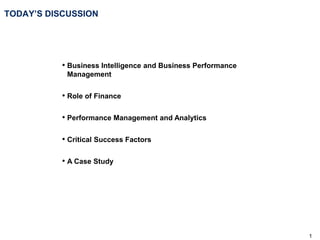
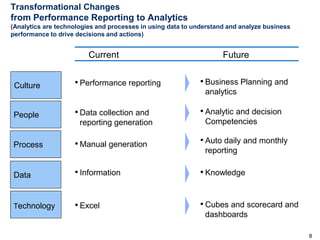
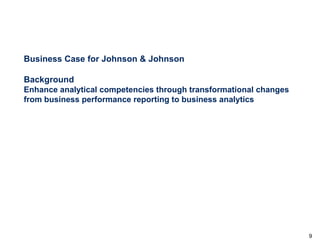
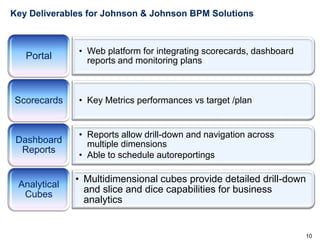
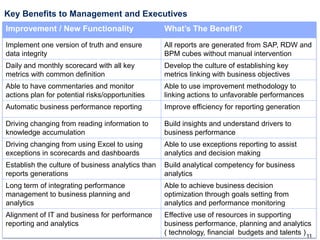
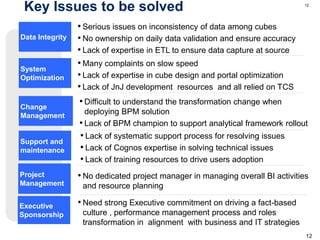
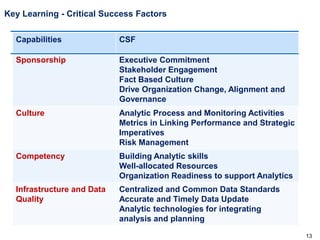

The document discusses a business performance management project at Johnson & Johnson Medical to build an integrated information solution to enhance business performance, planning, and analytics. It outlines key topics like the role of finance, performance management, and critical success factors. It also provides details of the proposed solution like scorecards, dashboard reports, and analytical cubes to provide benefits like improved decision making, monitoring, and building an analytical culture. Key issues to address include data integrity, change management, and executive sponsorship.