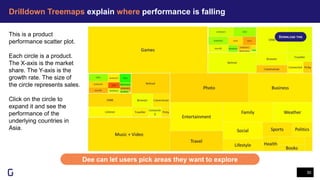
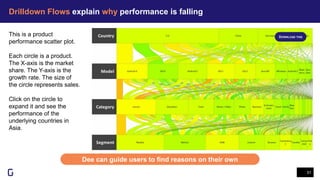
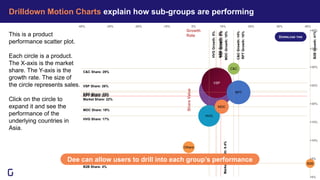
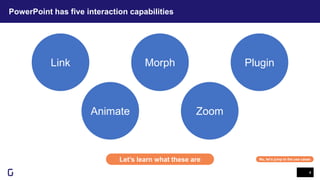
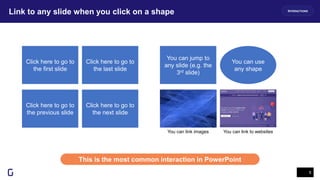
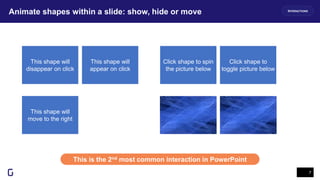
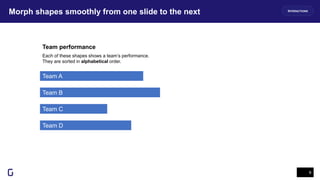
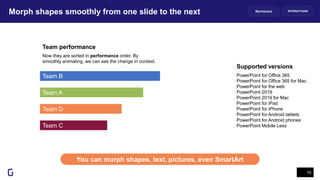
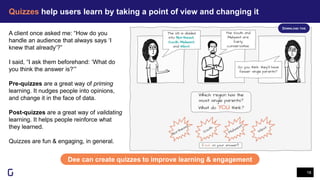
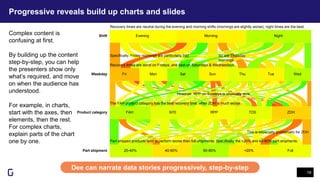
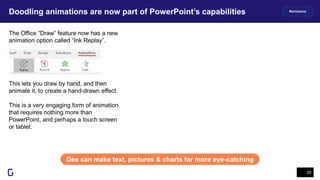
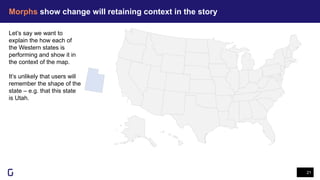
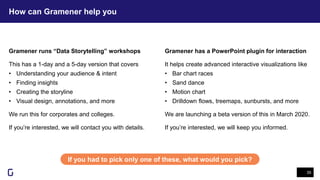
SlideShare a Scribd company logo
Engaging your
audience with
Interactive
PowerPoint decks
Manage your operations with data-
driven slides
In an era of Business Intelligence, why are we talking about PowerPoint?
2
PowerPoint is actually the #1 data visualization platform in the world
Self-
service
Part of
workflow
Offline
access
Better
design
Despite “self-service BI”, creating a
dashboard in Tableau, Power BI, Qlik,
Spotfire, Microstrategy, etc requires
specialized expertise.
But your secretary can create a
PowerPoint presentation.
Today, the standard process today is to
take screenshots from Excel, BI
dashboards, etc, stitch them into a
story, and share them with users.
This is the most common workflow in
the world to share insights from data.
Users can access the content offline,
store it anywhere, forward it to
anyone – even people who don’t have
access to BI dashboards.
The very things that IT departments
fear – but users find convenient.
For the author, it’s easier to design the
story flow and visualization. Using
shapes, images, and past slides,
authors can quickly design content.
Just as Excel was never replaced,
PowerPoint won’t be replaced either.
Today is not about WHAT story to tell. It’s about HOW to tell it engagingly
3
Listen on. You may discover something new.
We won’t cover this
Creating effective PowerPoint presentations and
narrating interesting data stories are great topics.
That’s not what this session is about. It’s not about
storytelling, slide design, picking colors, picking
charts, visualizations, maps, or presentation skills.
(Gramener runs a data storytelling workshop that
covers these. I’ll mention that at the end.)
We will cover this
Today is about one specific technique in PowerPoint:
Interactive data-driven presentations.
We’ll focus more on examples that people on
operations (sales, marketing, manufacturing, finance,
HR, IT – any kind of operations) will find useful.
We’ll start with techniques. We’ll move on to use
cases. I’ll share 3 simple tips to learn more.
PowerPoint has five interaction capabilities
4
Let’s learn what these are
Link Morph Plugin
Animate Zoom
No, let’s jump to the use cases
Link to any slide when you click on a shape
5
This is the most common interaction in PowerPoint
INTERACTIONS
Click here to go to
the first slide
Click here to go to
the last slide
Click here to go to
the previous slide
Click here to go to
the next slide
You can jump to
any slide (e.g. the
3rd slide)
You can use
any shape
You can link images You can link to websites
Practice
Let’s create a link
6
Link the blue circle to the 3rd slide,
and the orange circle to Gramener.com
3rd slide Gramener
Animate shapes within a slide: show, hide or move
7
This is the 2nd most common interaction in PowerPoint
INTERACTIONS
This shape will
disappear on click
This shape will
appear on click
This shape will
move to the right
Click shape to spin
the picture below
Click shape to
toggle picture below
Practice
Let’s animate
8
Create an animation that moves this rectangle
down when the circle is clicked.
Morph shapes smoothly from one slide to the next
9
INTERACTIONS
Team A
Team B
Team C
Team D
Team performance
Each of these shapes shows a team’s performance.
They are sorted in alphabetical order.
Team B
Morph shapes smoothly from one slide to the next
10
You can morph shapes, text, pictures, even SmartArt
INTERACTIONS
Team A
Team D
Team C
Now they are sorted in performance order. By
smoothly animating, we can see the change in context.
PowerPoint for Office 365
PowerPoint for Office 365 for Mac
PowerPoint for the web
PowerPoint 2019
PowerPoint 2019 for Mac
PowerPoint for iPad
PowerPoint for iPhone
PowerPoint for Android tablets
PowerPoint for Android phones
PowerPoint Mobile Less
Supported versions
Team performance
REFERENCE
Practice
Let’s morph
11
Create a copy of this slide. Smoothly move
these shapes below to different positions.
Zoom into any slide when you click on a shape
12
Zoom is available in Office 365 & PowerPoint 2019
INTERACTIONSREFERENCE
Section Zoom
You can zoom into one or more
sections. These icons are live
summaries of those slides.
Slide Zoom
You can zoom into any slide, just like
links. These icons are live summaries
of those slides.
Go to Insert > Zoom.
Select one of the Zoom options.
Instructions
Practice
Let’s add a zoom
13
Add 2 Slide Zooms into any 2 slides
Plugins can add more interaction capabilities
14
INTERACTIONS
What can Dee, an
Operations Manager, use
these for?
We’ll explore actual uses of
interactive presentations
15Time check: 15 minutes
Table of Contents lets users jump to relevant sections
16
Dee can visually show the document structure using links
CONSULTING
ABOUT PRODUCTS
CASE STUDIES
FINANCIAL SERVICES MEDIA PUBLIC SECTOR RETAIL & CONSUMER
SPORTS EDUCATION SOCIETY JUST FUN
HEALTHCARE MANUFACTURING TELECOMAGRICULTURE
FINANCE HR IT & SM MARKETING
DATA EXPLORER
GRAMENER INTRODUCTION GRAMEX ANALYTICS
NARRATIVES
AUTOLYSIS DESIGN
CLUSTER
OFFERINGS
This is a consolidation of all final Gramener slides. View in slideshow mode. Click on any link in slide-show mode to open the page. (Ctrl-Click in normal mode.)
VISUALIZATION
CLEANSING
ADMINISTRATION
▼
▼
▼
▼ ▼ ▼
▼
PARTNERSHIPS ▼
SMART ALERTS AI / ML ▼
Gramener uses Links to
create a table of contents
for its 720-slide library of
slides.
This first page shows the
document structure.
Each box links to the
relevant section.
Some sections have case
studies marked using a ▼
symbol. Clicking on the
symbol directly jumps to
the case study.
Note: The actual links on this slide were deleted when
anonymizing. The design was preserved.
Maps & Layouts can be used as a way of navigation
17
Dee can use layouts to visually drill down into the deck
The document or section
structure doesn’t need to
be textual. It can be a map
or a layout.
Click on a colored state
for more details about that
state. Colors add
information (e.g. how the
state is performing).
Layouts of plants, offices,
stores, data centers, etc
can be used as layouts.
Note: PowerPoint can import SVG files and ungroup
them into native PowerPoint shapes.
Quizzes help users learn by taking a point of view and changing it
18
Dee can create quizzes to improve learning & engagement
A client once asked me: “How do you
handle an audience that always says ‘I
knew that already’?”
I said, “I ask them beforehand: ‘What do
you think the answer is?’”
Pre-quizzes are a great way of priming
learning. It nudges people into opinions,
and change it in the face of data.
Post-quizzes are a great way of validating
learning. It helps people reinforce what
they learned.
Quizzes are fun & engaging, in general.
DOWNLOAD THIS
Progressive reveals build up charts and slides
19
Dee can narrate data stories progressively, step-by-step
Shift Evening Morning Night
Weekday Fri Mon Sat Sun Thu Tue Wed
Product category FAH N70 RPP TDS ZDH
Part shipment 20-40% 40-60% 60-80% <20% Full
Recovery times are neutral during the evening and morning shifts (mornings are slightly worse), night times are the best.
Recovery times are worst on Fridays, and best on Saturdays & Wednesdays.
Specifically, Friday mornings are particularly bad. So are Thursday
mornings.
The FAH product category has the best recovery time, while ZDH is much worse.
However, RPP on Sundays is unusually slow.
Part shipped products tend to perform worse than full-shipments. Specifically the <20% and 40-60% part-shipments.
This is especially problematic for ZDH
Complex content is
confusing at first.
By building up the content
step-by-step, you can help
the presenters show only
what’s required, and move
on when the audience has
understood.
For example, in charts,
start with the axes, then
elements, then the rest.
For complex charts,
explain parts of the chart
one by one.
Doodling animations are now part of PowerPoint’s capabilities
20
Dee can make text, pictures & charts far more eye-catching
The Office “Draw” feature now has a new
animation option called “Ink Replay”.
This lets you draw by hand, and then
animate it, to create a hand-drawn effect.
This is a very engaging form of animation
that requires nothing more than
PowerPoint, and perhaps a touch screen
or tablet.
REFERENCE
Morphs show change will retaining context in the story
21
Let’s say we want to
explain the how each of
the Western states is
performing and show it in
the context of the map.
It’s unlikely that users will
remember the shape of the
state – e.g. that this state
is Utah.
Morphs show change will retaining context in the story
22
Dee can help users see change while retaining context
Let’s say we want to
explain the how each of
the Western states is
performing and show it in
the context of the map.
It’s unlikely that users will
remember the shape of the
state – e.g. that this state
is Utah.
But if we smoothly morph
the shapes, retaining the
context, this becomes
much easier.
Morphs can even rotate 3D objects
23
This airline maker wants to
explain to their client what
the impact of heavy
particle damage on the left
wing of this aircraft.
Typically, these are
represented as images
with annotations.
Left wing faced heavy particle
damage during the flight
Morphs can even rotate 3D objects
24
This increased the erosion
under the left wing, leading to
higher resistance.
This airline maker wants to
explain to their client what
the impact of heavy
particle damage on the left
wing of this aircraft.
Typically, these are
represented as images
with annotations.
But with the emergence of
3D models and
PowerPoint’s ability to
morph them, we can retain
context and explain with
more clarity.
Dee can explain events from multiple perspectives
Bar chart races show how things have improved or worsened with time
25
Dee can show who’s knocking whom out in the top 10 race
Bar chart races are a recent, very popular,
and highly engaging form of animated
visuals.
This can be used to show the top
performing customers, regions, plants,
business units, or any other entity – and
their performance across time.
Who is beating whom, who’s entered the
league tables, and who’s been bested by
who – these are questions a bar chart race
answers very clearly.
These can be created with PowerPoint
morph transitions.
DOWNLOAD THIS
Sand dance shows how people, clients & resources are distributed
26
Dee can use sand dance to explain data distribution
Geographic
Distribution
Offering
Type
Industry Business
Unit
Deal Stages
AustraliaUnited
States
60 36 8
China
11
India
Sand dances are another recent,
popular, and engaging animated
visual form.
Each icon represents one unit –
person, client, project, equipment,
etc. They are grouped together in a
certain way but can be re-grouped in
other ways.
As they are re-grouped, each unit
moves into the new group. Audience
sees what’s going where visually.
These can be created with
PowerPoint morph transitions.
Sand dance shows how people, clients & resources are distributed
27
Dee can use sand dance to explain data distribution
Offering
Type
Industry Business
Unit
Deal Stages
Routing
ELA Site Survey Network Security Staffing Solution
Vendor Technical
Services Resale
Switching Performance Optimization
Geographic
Distribution
Sand dances are another recent,
popular, and engaging animated
visual form.
Each icon represents one unit –
person, client, project, equipment,
etc. They are grouped together in a
certain way but can be re-grouped in
other ways.
As they are re-grouped, each unit
moves into the new group. Audience
sees what’s going where visually.
These can be created with
PowerPoint morph transitions.
Sand dance shows how people, clients & resources are distributed
28
Dee can use sand dance to explain data distribution
Automotive Financial Services Manufacturing Retail & Wholesale
Geographic
Distribution
Offering
Type
Industry Business
Unit
Deal Stages
Sand dances are another recent,
popular, and engaging animated
visual form.
Each icon represents one unit –
person, client, project, equipment,
etc. They are grouped together in a
certain way but can be re-grouped in
other ways.
As they are re-grouped, each unit
moves into the new group. Audience
sees what’s going where visually.
These can be created with
PowerPoint morph transitions.
Drilldown Sunbursts compare performance across segments
29
Dee can allow presenters to chart their own path
The Sales Operations team of a consumer
goods company needed an interactive
presentation to run their board discussion.
The Head of Sales usually presented the
performance across channels. But the
discussion rarely went in the way it was
scripted.
To allow the audience to participate in the
discussion, this interactive drilldown lets
the presenter pick the path they want to go
along.
DOWNLOAD THIS
Drilldown Treemaps explain where performance is falling
30
Dee can let users pick areas they want to explore
This is a product
performance scatter plot.
Each circle is a product.
The X-axis is the market
share. The Y-axis is the
growth rate. The size of
the circle represents sales.
Click on the circle to
expand it and see the
performance of the
underlying countries in
Asia.
DOWNLOAD THIS
Drilldown Flows explain why performance is falling
31
Dee can guide users to find reasons on their own
This is a product
performance scatter plot.
Each circle is a product.
The X-axis is the market
share. The Y-axis is the
growth rate. The size of
the circle represents sales.
Click on the circle to
expand it and see the
performance of the
underlying countries in
Asia.
DOWNLOAD THIS
Growth
Rate
ShareValue
Market Share: 22%
MarketGrowth:9.4%
-40% -30% -20% -10% 0% 10% 20% 30% 40%
+0%
+5%
+10%
+15%
+20%
+25%
+30%
+35%
+40%
KRD Share: 23%
KRDGrowth:8%
KRD
VSP Share: 26%
VSPGrowth:8%
VSP
RPT Share: 23%
RPTGrowth:16%
RPT
HVG Share: 17%
HVGGrowth:5%
HVG
MDC Share: 19%
MDCGrowth:10%
MDC
C&C Share: 29%
C&CGrowth:14%
C&C
Others
B2B Share: 4%
B2BGrowth:41%
B2B
Drilldown Motion Charts explain how sub-groups are performing
Dee can allow users to drill into each group’s performance
This is a product
performance scatter plot.
Each circle is a product.
The X-axis is the market
share. The Y-axis is the
growth rate. The size of
the circle represents sales.
Click on the circle to
expand it and see the
performance of the
underlying countries in
Asia.
DOWNLOAD THIS
What can you do
next?
33Time check: 35 minutes
What can you do next
34
LEARN PRACTICE TEACH
We learn the most when
we teach.
Share what you learn with
your friends & teams.
Organize sessions, show
your work, see their work,
and learn together.
We learn by doing, not by
reading or listening.
Try the practices in this
deck. Try the new features
you learn about.
Revise your last PPT and
practice it on your next
one.
PowerPoint has many new
features.
Go through every item in
the PowerPoint ribbon.
You’ll find something you
didn’t know about before –
every time. (I do.)
How can Gramener help you
35
If you had to pick only one of these, what would you pick?
Gramener runs “Data Storytelling” workshops
This has a 1-day and a 5-day version that covers
• Understanding your audience & intent
• Finding insights
• Creating the storyline
• Visual design, annotations, and more
We run this for corporates and colleges.
If you’re interested, we will contact you with details.
Gramener has a PowerPoint plugin for interaction
It helps create advanced interactive visualizations like
• Bar chart races
• Sand dance
• Motion chart
• Drilldown flows, treemaps, sunbursts, and more
We are launching a beta version of this in March 2020.
If you’re interested, we will keep you informed.
Would you like me to reach out to you for either of these?
36
THANK
YOU
Your feedback will help!
Q&A

More Related Content

What's hot

The what, why, and how of master data management
The what, why, and how of master data managementThe what, why, and how of master data management
The what, why, and how of master data managementMohammad Yousri
 
Building Digital Strategy Roadmap For Digital Transformation Complete Deck
Building Digital Strategy Roadmap For Digital Transformation Complete DeckBuilding Digital Strategy Roadmap For Digital Transformation Complete Deck
Building Digital Strategy Roadmap For Digital Transformation Complete DeckSlideTeam
 
Revenue Projection PowerPoint Presentation Slides
Revenue Projection PowerPoint Presentation SlidesRevenue Projection PowerPoint Presentation Slides
Revenue Projection PowerPoint Presentation SlidesSlideTeam
 
DAS Slides: Building a Data Strategy - Practical Steps for Aligning with Busi...
DAS Slides: Building a Data Strategy - Practical Steps for Aligning with Busi...DAS Slides: Building a Data Strategy - Practical Steps for Aligning with Busi...
DAS Slides: Building a Data Strategy - Practical Steps for Aligning with Busi...DATAVERSITY
 
Building a Data Strategy – Practical Steps for Aligning with Business Goals
Building a Data Strategy – Practical Steps for Aligning with Business GoalsBuilding a Data Strategy – Practical Steps for Aligning with Business Goals
Building a Data Strategy – Practical Steps for Aligning with Business GoalsDATAVERSITY
 
Seven building blocks for MDM
Seven building blocks for MDMSeven building blocks for MDM
Seven building blocks for MDMKousik Mukherjee
 
Data Modeling & Data Integration
Data Modeling & Data IntegrationData Modeling & Data Integration
Data Modeling & Data IntegrationDATAVERSITY
 
Real-World Data Governance: Data Governance Expectations
Real-World Data Governance: Data Governance ExpectationsReal-World Data Governance: Data Governance Expectations
Real-World Data Governance: Data Governance ExpectationsDATAVERSITY
 
DAS Slides: Data Governance - Combining Data Management with Organizational ...
DAS Slides: Data Governance -  Combining Data Management with Organizational ...DAS Slides: Data Governance -  Combining Data Management with Organizational ...
DAS Slides: Data Governance - Combining Data Management with Organizational ...DATAVERSITY
 
Master Data Management - Gartner Presentation
Master Data Management - Gartner PresentationMaster Data Management - Gartner Presentation
Master Data Management - Gartner Presentation303Computing
 
Reference master data management
Reference master data managementReference master data management
Reference master data managementDr. Hamdan Al-Sabri
 
Getting Started with Databricks SQL Analytics
Getting Started with Databricks SQL AnalyticsGetting Started with Databricks SQL Analytics
Getting Started with Databricks SQL AnalyticsDatabricks
 
Data Architecture, Solution Architecture, Platform Architecture — What’s the ...
Data Architecture, Solution Architecture, Platform Architecture — What’s the ...Data Architecture, Solution Architecture, Platform Architecture — What’s the ...
Data Architecture, Solution Architecture, Platform Architecture — What’s the ...DATAVERSITY
 
Enabling a Data Mesh Architecture with Data Virtualization
Enabling a Data Mesh Architecture with Data VirtualizationEnabling a Data Mesh Architecture with Data Virtualization
Enabling a Data Mesh Architecture with Data VirtualizationDenodo
 
Apache Kafka With Spark Structured Streaming With Emma Liu, Nitin Saksena, Ra...
Apache Kafka With Spark Structured Streaming With Emma Liu, Nitin Saksena, Ra...Apache Kafka With Spark Structured Streaming With Emma Liu, Nitin Saksena, Ra...
Apache Kafka With Spark Structured Streaming With Emma Liu, Nitin Saksena, Ra...HostedbyConfluent
 
Current State Future State PowerPoint Presentation Slides
Current State Future State PowerPoint Presentation SlidesCurrent State Future State PowerPoint Presentation Slides
Current State Future State PowerPoint Presentation SlidesSlideTeam
 
Achieving a Single View of Business – Critical Data with Master Data Management
Achieving a Single View of Business – Critical Data with Master Data ManagementAchieving a Single View of Business – Critical Data with Master Data Management
Achieving a Single View of Business – Critical Data with Master Data ManagementDATAVERSITY
 
10 Principles for Data Storytelling
10 Principles for Data Storytelling10 Principles for Data Storytelling
10 Principles for Data StorytellingDamian Radcliffe
 
Owning Your Own (Data) Lake House
Owning Your Own (Data) Lake HouseOwning Your Own (Data) Lake House
Owning Your Own (Data) Lake HouseData Con LA
 

What's hot (20)

The what, why, and how of master data management
The what, why, and how of master data managementThe what, why, and how of master data management
The what, why, and how of master data management
 
Building Digital Strategy Roadmap For Digital Transformation Complete Deck
Building Digital Strategy Roadmap For Digital Transformation Complete DeckBuilding Digital Strategy Roadmap For Digital Transformation Complete Deck
Building Digital Strategy Roadmap For Digital Transformation Complete Deck
 
Revenue Projection PowerPoint Presentation Slides
Revenue Projection PowerPoint Presentation SlidesRevenue Projection PowerPoint Presentation Slides
Revenue Projection PowerPoint Presentation Slides
 
DAS Slides: Building a Data Strategy - Practical Steps for Aligning with Busi...
DAS Slides: Building a Data Strategy - Practical Steps for Aligning with Busi...DAS Slides: Building a Data Strategy - Practical Steps for Aligning with Busi...
DAS Slides: Building a Data Strategy - Practical Steps for Aligning with Busi...
 
Building a Data Strategy – Practical Steps for Aligning with Business Goals
Building a Data Strategy – Practical Steps for Aligning with Business GoalsBuilding a Data Strategy – Practical Steps for Aligning with Business Goals
Building a Data Strategy – Practical Steps for Aligning with Business Goals
 
Data Storytelling
Data StorytellingData Storytelling
Data Storytelling
 
Seven building blocks for MDM
Seven building blocks for MDMSeven building blocks for MDM
Seven building blocks for MDM
 
Data Modeling & Data Integration
Data Modeling & Data IntegrationData Modeling & Data Integration
Data Modeling & Data Integration
 
Real-World Data Governance: Data Governance Expectations
Real-World Data Governance: Data Governance ExpectationsReal-World Data Governance: Data Governance Expectations
Real-World Data Governance: Data Governance Expectations
 
DAS Slides: Data Governance - Combining Data Management with Organizational ...
DAS Slides: Data Governance -  Combining Data Management with Organizational ...DAS Slides: Data Governance -  Combining Data Management with Organizational ...
DAS Slides: Data Governance - Combining Data Management with Organizational ...
 
Master Data Management - Gartner Presentation
Master Data Management - Gartner PresentationMaster Data Management - Gartner Presentation
Master Data Management - Gartner Presentation
 
Reference master data management
Reference master data managementReference master data management
Reference master data management
 
Getting Started with Databricks SQL Analytics
Getting Started with Databricks SQL AnalyticsGetting Started with Databricks SQL Analytics
Getting Started with Databricks SQL Analytics
 
Data Architecture, Solution Architecture, Platform Architecture — What’s the ...
Data Architecture, Solution Architecture, Platform Architecture — What’s the ...Data Architecture, Solution Architecture, Platform Architecture — What’s the ...
Data Architecture, Solution Architecture, Platform Architecture — What’s the ...
 
Enabling a Data Mesh Architecture with Data Virtualization
Enabling a Data Mesh Architecture with Data VirtualizationEnabling a Data Mesh Architecture with Data Virtualization
Enabling a Data Mesh Architecture with Data Virtualization
 
Apache Kafka With Spark Structured Streaming With Emma Liu, Nitin Saksena, Ra...
Apache Kafka With Spark Structured Streaming With Emma Liu, Nitin Saksena, Ra...Apache Kafka With Spark Structured Streaming With Emma Liu, Nitin Saksena, Ra...
Apache Kafka With Spark Structured Streaming With Emma Liu, Nitin Saksena, Ra...
 
Current State Future State PowerPoint Presentation Slides
Current State Future State PowerPoint Presentation SlidesCurrent State Future State PowerPoint Presentation Slides
Current State Future State PowerPoint Presentation Slides
 
Achieving a Single View of Business – Critical Data with Master Data Management
Achieving a Single View of Business – Critical Data with Master Data ManagementAchieving a Single View of Business – Critical Data with Master Data Management
Achieving a Single View of Business – Critical Data with Master Data Management
 
10 Principles for Data Storytelling
10 Principles for Data Storytelling10 Principles for Data Storytelling
10 Principles for Data Storytelling
 
Owning Your Own (Data) Lake House
Owning Your Own (Data) Lake HouseOwning Your Own (Data) Lake House
Owning Your Own (Data) Lake House
 

Similar to How to make data-driven interactive PowerPoint presentations for operations

3d Interactive presentation software
3d Interactive presentation software3d Interactive presentation software
3d Interactive presentation softwareAurora3D Software
 
Ethical Trade Consulting Meningkatkan etika pada profesi.pptx
Ethical Trade Consulting Meningkatkan etika pada profesi.pptxEthical Trade Consulting Meningkatkan etika pada profesi.pptx
Ethical Trade Consulting Meningkatkan etika pada profesi.pptxIntanwahyuni38
 
Collaborative Design: Lessons & Observations
Collaborative Design: Lessons & ObservationsCollaborative Design: Lessons & Observations
Collaborative Design: Lessons & ObservationsAdam Connor
 
How to select and create an effective visual for your business presentation
How to select and create an effective visual for your business presentationHow to select and create an effective visual for your business presentation
How to select and create an effective visual for your business presentationDave Paradi
 
Training Plan.pptx
Training Plan.pptxTraining Plan.pptx
Training Plan.pptxJingFongEwe1
 
Owning the Interaction in Dynamic Environments
Owning the Interaction in Dynamic EnvironmentsOwning the Interaction in Dynamic Environments
Owning the Interaction in Dynamic EnvironmentsFergus Roche
 
Owning the Interaction in Dynamic Environments
Owning the Interaction in Dynamic EnvironmentsOwning the Interaction in Dynamic Environments
Owning the Interaction in Dynamic Environmentsguestf4f7a4b38
 
Website Design Consulting by Slidesgo.pptx
Website Design Consulting by Slidesgo.pptxWebsite Design Consulting by Slidesgo.pptx
Website Design Consulting by Slidesgo.pptxYusufAlfian4
 
Website Design Consulting by Slidesgo.pptx
Website Design Consulting by Slidesgo.pptxWebsite Design Consulting by Slidesgo.pptx
Website Design Consulting by Slidesgo.pptxAmmarOdeh4
 
Data in Statistics Marketing Theme by Slidesgo.pptx
Data in Statistics Marketing Theme by Slidesgo.pptxData in Statistics Marketing Theme by Slidesgo.pptx
Data in Statistics Marketing Theme by Slidesgo.pptxMariaLizethYoverache
 
oral presentations and report
oral presentations and reportoral presentations and report
oral presentations and reportDilip Raj
 
VIEWED.pptx DETERMINING RELEVANCE IN THE MATERIAL VIEWED
VIEWED.pptx DETERMINING RELEVANCE IN THE MATERIAL VIEWEDVIEWED.pptx DETERMINING RELEVANCE IN THE MATERIAL VIEWED
VIEWED.pptx DETERMINING RELEVANCE IN THE MATERIAL VIEWEDElysaMicu
 
Agile Prototyping Best Practices
Agile Prototyping Best PracticesAgile Prototyping Best Practices
Agile Prototyping Best Practicesuxpin
 
How to make presentations appealing to audiences
How to make presentations appealing to audiencesHow to make presentations appealing to audiences
How to make presentations appealing to audiencesAashish Singh
 
Power point activity 1 of gly
Power point activity 1 of glyPower point activity 1 of gly
Power point activity 1 of glyglyceryl
 
Data in Statistics Marketing Theme by Slidesgo.pptx
Data in Statistics Marketing Theme by Slidesgo.pptxData in Statistics Marketing Theme by Slidesgo.pptx
Data in Statistics Marketing Theme by Slidesgo.pptxLuis Ramiro Mamani Cabral
 

Similar to How to make data-driven interactive PowerPoint presentations for operations (20)

3d Interactive presentation software
3d Interactive presentation software3d Interactive presentation software
3d Interactive presentation software
 
Ethical Trade Consulting Meningkatkan etika pada profesi.pptx
Ethical Trade Consulting Meningkatkan etika pada profesi.pptxEthical Trade Consulting Meningkatkan etika pada profesi.pptx
Ethical Trade Consulting Meningkatkan etika pada profesi.pptx
 
carbon-consult.pptx
carbon-consult.pptxcarbon-consult.pptx
carbon-consult.pptx
 
Tp200910
Tp200910Tp200910
Tp200910
 
elipse
elipseelipse
elipse
 
chat-gpt.pptx
chat-gpt.pptxchat-gpt.pptx
chat-gpt.pptx
 
Collaborative Design: Lessons & Observations
Collaborative Design: Lessons & ObservationsCollaborative Design: Lessons & Observations
Collaborative Design: Lessons & Observations
 
How to select and create an effective visual for your business presentation
How to select and create an effective visual for your business presentationHow to select and create an effective visual for your business presentation
How to select and create an effective visual for your business presentation
 
Training Plan.pptx
Training Plan.pptxTraining Plan.pptx
Training Plan.pptx
 
Owning the Interaction in Dynamic Environments
Owning the Interaction in Dynamic EnvironmentsOwning the Interaction in Dynamic Environments
Owning the Interaction in Dynamic Environments
 
Owning the Interaction in Dynamic Environments
Owning the Interaction in Dynamic EnvironmentsOwning the Interaction in Dynamic Environments
Owning the Interaction in Dynamic Environments
 
Website Design Consulting by Slidesgo.pptx
Website Design Consulting by Slidesgo.pptxWebsite Design Consulting by Slidesgo.pptx
Website Design Consulting by Slidesgo.pptx
 
Website Design Consulting by Slidesgo.pptx
Website Design Consulting by Slidesgo.pptxWebsite Design Consulting by Slidesgo.pptx
Website Design Consulting by Slidesgo.pptx
 
Data in Statistics Marketing Theme by Slidesgo.pptx
Data in Statistics Marketing Theme by Slidesgo.pptxData in Statistics Marketing Theme by Slidesgo.pptx
Data in Statistics Marketing Theme by Slidesgo.pptx
 
oral presentations and report
oral presentations and reportoral presentations and report
oral presentations and report
 
VIEWED.pptx DETERMINING RELEVANCE IN THE MATERIAL VIEWED
VIEWED.pptx DETERMINING RELEVANCE IN THE MATERIAL VIEWEDVIEWED.pptx DETERMINING RELEVANCE IN THE MATERIAL VIEWED
VIEWED.pptx DETERMINING RELEVANCE IN THE MATERIAL VIEWED
 
Agile Prototyping Best Practices
Agile Prototyping Best PracticesAgile Prototyping Best Practices
Agile Prototyping Best Practices
 
How to make presentations appealing to audiences
How to make presentations appealing to audiencesHow to make presentations appealing to audiences
How to make presentations appealing to audiences
 
Power point activity 1 of gly
Power point activity 1 of glyPower point activity 1 of gly
Power point activity 1 of gly
 
Data in Statistics Marketing Theme by Slidesgo.pptx
Data in Statistics Marketing Theme by Slidesgo.pptxData in Statistics Marketing Theme by Slidesgo.pptx
Data in Statistics Marketing Theme by Slidesgo.pptx
 

More from Gramener

6 Methods to Improve Your Manufacturing Process with Computer Vision
6 Methods to Improve Your Manufacturing Process with Computer Vision6 Methods to Improve Your Manufacturing Process with Computer Vision
6 Methods to Improve Your Manufacturing Process with Computer VisionGramener
 
Detecting Manufacturing Defects with Computer Vision
Detecting Manufacturing Defects with Computer VisionDetecting Manufacturing Defects with Computer Vision
Detecting Manufacturing Defects with Computer VisionGramener
 
How to Identify the Right Key Opinion Leaders (KOLs) in Pharma & Healthcare
How to Identify the Right Key Opinion Leaders (KOLs) in Pharma  & HealthcareHow to Identify the Right Key Opinion Leaders (KOLs) in Pharma  & Healthcare
How to Identify the Right Key Opinion Leaders (KOLs) in Pharma & HealthcareGramener
 
Automated Barcode Generation System in Manufacturing
Automated Barcode Generation System in ManufacturingAutomated Barcode Generation System in Manufacturing
Automated Barcode Generation System in ManufacturingGramener
 
The Role of Technology to Save Biodiversity
The Role of Technology to Save BiodiversityThe Role of Technology to Save Biodiversity
The Role of Technology to Save BiodiversityGramener
 
Enable Storytelling with Power BI & Comicgen Plugin
Enable Storytelling with Power BI  & Comicgen PluginEnable Storytelling with Power BI  & Comicgen Plugin
Enable Storytelling with Power BI & Comicgen PluginGramener
 
The Most Effective Method For Selecting Data Science Projects
The Most Effective Method For Selecting Data Science ProjectsThe Most Effective Method For Selecting Data Science Projects
The Most Effective Method For Selecting Data Science ProjectsGramener
 
Low Code Platform To Build Data & AI Products
Low Code Platform To Build Data & AI ProductsLow Code Platform To Build Data & AI Products
Low Code Platform To Build Data & AI ProductsGramener
 
5 Key Foundations To Build An Effective CX Program
5 Key Foundations To Build An Effective CX Program5 Key Foundations To Build An Effective CX Program
5 Key Foundations To Build An Effective CX ProgramGramener
 
Using Power BI To Improve Media Buying & Ad Performance
Using Power BI To Improve Media Buying & Ad PerformanceUsing Power BI To Improve Media Buying & Ad Performance
Using Power BI To Improve Media Buying & Ad PerformanceGramener
 
Recession Proofing With Data : Webinar
Recession Proofing With Data : WebinarRecession Proofing With Data : Webinar
Recession Proofing With Data : WebinarGramener
 
Engage Your Audience With PowerPoint Decks: Webinar
Engage Your Audience With PowerPoint Decks: WebinarEngage Your Audience With PowerPoint Decks: Webinar
Engage Your Audience With PowerPoint Decks: WebinarGramener
 
Structure Your Data Science Teams For Best Outcomes
Structure Your Data Science Teams For Best OutcomesStructure Your Data Science Teams For Best Outcomes
Structure Your Data Science Teams For Best OutcomesGramener
 
Dawn Of Geospatial AI - Webinar
Dawn Of Geospatial AI - WebinarDawn Of Geospatial AI - Webinar
Dawn Of Geospatial AI - WebinarGramener
 
5 Steps To Become A Data-Driven Organization : Webinar
5 Steps To Become A Data-Driven Organization : Webinar5 Steps To Become A Data-Driven Organization : Webinar
5 Steps To Become A Data-Driven Organization : WebinarGramener
 
5 Steps To Measure ROI On Your Data Science Initiatives - Webinar
 5 Steps To Measure ROI On Your Data Science Initiatives - Webinar 5 Steps To Measure ROI On Your Data Science Initiatives - Webinar
5 Steps To Measure ROI On Your Data Science Initiatives - WebinarGramener
 
Saving Lives with Geospatial AI - Pycon Indonesia 2020
Saving Lives with Geospatial AI - Pycon Indonesia 2020Saving Lives with Geospatial AI - Pycon Indonesia 2020
Saving Lives with Geospatial AI - Pycon Indonesia 2020Gramener
 
Driving Transformation in Industries with Artificial Intelligence (AI)
Driving Transformation in Industries with Artificial Intelligence (AI)Driving Transformation in Industries with Artificial Intelligence (AI)
Driving Transformation in Industries with Artificial Intelligence (AI)Gramener
 
The Art of Storytelling Using Data Science
The Art of Storytelling Using Data ScienceThe Art of Storytelling Using Data Science
The Art of Storytelling Using Data ScienceGramener
 
Storyfying your Data: How to go from Data to Insights to Stories
Storyfying your Data: How to go from Data to Insights to StoriesStoryfying your Data: How to go from Data to Insights to Stories
Storyfying your Data: How to go from Data to Insights to StoriesGramener
 

More from Gramener (20)

6 Methods to Improve Your Manufacturing Process with Computer Vision
6 Methods to Improve Your Manufacturing Process with Computer Vision6 Methods to Improve Your Manufacturing Process with Computer Vision
6 Methods to Improve Your Manufacturing Process with Computer Vision
 
Detecting Manufacturing Defects with Computer Vision
Detecting Manufacturing Defects with Computer VisionDetecting Manufacturing Defects with Computer Vision
Detecting Manufacturing Defects with Computer Vision
 
How to Identify the Right Key Opinion Leaders (KOLs) in Pharma & Healthcare
How to Identify the Right Key Opinion Leaders (KOLs) in Pharma  & HealthcareHow to Identify the Right Key Opinion Leaders (KOLs) in Pharma  & Healthcare
How to Identify the Right Key Opinion Leaders (KOLs) in Pharma & Healthcare
 
Automated Barcode Generation System in Manufacturing
Automated Barcode Generation System in ManufacturingAutomated Barcode Generation System in Manufacturing
Automated Barcode Generation System in Manufacturing
 
The Role of Technology to Save Biodiversity
The Role of Technology to Save BiodiversityThe Role of Technology to Save Biodiversity
The Role of Technology to Save Biodiversity
 
Enable Storytelling with Power BI & Comicgen Plugin
Enable Storytelling with Power BI  & Comicgen PluginEnable Storytelling with Power BI  & Comicgen Plugin
Enable Storytelling with Power BI & Comicgen Plugin
 
The Most Effective Method For Selecting Data Science Projects
The Most Effective Method For Selecting Data Science ProjectsThe Most Effective Method For Selecting Data Science Projects
The Most Effective Method For Selecting Data Science Projects
 
Low Code Platform To Build Data & AI Products
Low Code Platform To Build Data & AI ProductsLow Code Platform To Build Data & AI Products
Low Code Platform To Build Data & AI Products
 
5 Key Foundations To Build An Effective CX Program
5 Key Foundations To Build An Effective CX Program5 Key Foundations To Build An Effective CX Program
5 Key Foundations To Build An Effective CX Program
 
Using Power BI To Improve Media Buying & Ad Performance
Using Power BI To Improve Media Buying & Ad PerformanceUsing Power BI To Improve Media Buying & Ad Performance
Using Power BI To Improve Media Buying & Ad Performance
 
Recession Proofing With Data : Webinar
Recession Proofing With Data : WebinarRecession Proofing With Data : Webinar
Recession Proofing With Data : Webinar
 
Engage Your Audience With PowerPoint Decks: Webinar
Engage Your Audience With PowerPoint Decks: WebinarEngage Your Audience With PowerPoint Decks: Webinar
Engage Your Audience With PowerPoint Decks: Webinar
 
Structure Your Data Science Teams For Best Outcomes
Structure Your Data Science Teams For Best OutcomesStructure Your Data Science Teams For Best Outcomes
Structure Your Data Science Teams For Best Outcomes
 
Dawn Of Geospatial AI - Webinar
Dawn Of Geospatial AI - WebinarDawn Of Geospatial AI - Webinar
Dawn Of Geospatial AI - Webinar
 
5 Steps To Become A Data-Driven Organization : Webinar
5 Steps To Become A Data-Driven Organization : Webinar5 Steps To Become A Data-Driven Organization : Webinar
5 Steps To Become A Data-Driven Organization : Webinar
 
5 Steps To Measure ROI On Your Data Science Initiatives - Webinar
 5 Steps To Measure ROI On Your Data Science Initiatives - Webinar 5 Steps To Measure ROI On Your Data Science Initiatives - Webinar
5 Steps To Measure ROI On Your Data Science Initiatives - Webinar
 
Saving Lives with Geospatial AI - Pycon Indonesia 2020
Saving Lives with Geospatial AI - Pycon Indonesia 2020Saving Lives with Geospatial AI - Pycon Indonesia 2020
Saving Lives with Geospatial AI - Pycon Indonesia 2020
 
Driving Transformation in Industries with Artificial Intelligence (AI)
Driving Transformation in Industries with Artificial Intelligence (AI)Driving Transformation in Industries with Artificial Intelligence (AI)
Driving Transformation in Industries with Artificial Intelligence (AI)
 
The Art of Storytelling Using Data Science
The Art of Storytelling Using Data ScienceThe Art of Storytelling Using Data Science
The Art of Storytelling Using Data Science
 
Storyfying your Data: How to go from Data to Insights to Stories
Storyfying your Data: How to go from Data to Insights to StoriesStoryfying your Data: How to go from Data to Insights to Stories
Storyfying your Data: How to go from Data to Insights to Stories
 

Recently uploaded

chapter 10 - excise tax of transfer and business taxation
chapter 10 - excise tax of transfer and business taxationchapter 10 - excise tax of transfer and business taxation
chapter 10 - excise tax of transfer and business taxationAUDIJEAngelo
 
Using Generative AI for Content Marketing
Using Generative AI for Content MarketingUsing Generative AI for Content Marketing
Using Generative AI for Content MarketingChuck Aikens
 
Equinox Gold Corporate Deck May 24th 2024
Equinox Gold Corporate Deck May 24th 2024Equinox Gold Corporate Deck May 24th 2024
Equinox Gold Corporate Deck May 24th 2024Equinox Gold Corp.
 
anas about venice for grade 6f about venice
anas about venice for grade 6f about veniceanas about venice for grade 6f about venice
anas about venice for grade 6f about veniceanasabutalha2013
 
Lookback Analysis
Lookback AnalysisLookback Analysis
Lookback AnalysisSafe PaaS
 
USA classified ads posting – best classified sites in usa.pdf
USA classified ads posting – best classified sites in usa.pdfUSA classified ads posting – best classified sites in usa.pdf
USA classified ads posting – best classified sites in usa.pdfsuperbizness1227
 
Understanding UAE Labour Law: Key Points for Employers and Employees
Understanding UAE Labour Law: Key Points for Employers and EmployeesUnderstanding UAE Labour Law: Key Points for Employers and Employees
Understanding UAE Labour Law: Key Points for Employers and EmployeesDragon Dream Bar
 
RMD24 | Debunking the non-endemic revenue myth Marvin Vacquier Droop | First ...
RMD24 | Debunking the non-endemic revenue myth Marvin Vacquier Droop | First ...RMD24 | Debunking the non-endemic revenue myth Marvin Vacquier Droop | First ...
RMD24 | Debunking the non-endemic revenue myth Marvin Vacquier Droop | First ...BBPMedia1
 
falcon-invoice-discounting-a-premier-platform-for-investors-in-india
falcon-invoice-discounting-a-premier-platform-for-investors-in-indiafalcon-invoice-discounting-a-premier-platform-for-investors-in-india
falcon-invoice-discounting-a-premier-platform-for-investors-in-indiaFalcon Invoice Discounting
 
Falcon Invoice Discounting Setup for Small Businesses
Falcon Invoice Discounting Setup for Small BusinessesFalcon Invoice Discounting Setup for Small Businesses
Falcon Invoice Discounting Setup for Small BusinessesFalcon investment
 
What are the main advantages of using HR recruiter services.pdf
What are the main advantages of using HR recruiter services.pdfWhat are the main advantages of using HR recruiter services.pdf
What are the main advantages of using HR recruiter services.pdfHumanResourceDimensi1
 
Evolution and Growth of Supply chain.pdf
Evolution and Growth of Supply chain.pdfEvolution and Growth of Supply chain.pdf
Evolution and Growth of Supply chain.pdfGutaMengesha1
 
Matt Conway - Attorney - A Knowledgeable Professional - Kentucky.pdf
Matt Conway - Attorney - A Knowledgeable Professional - Kentucky.pdfMatt Conway - Attorney - A Knowledgeable Professional - Kentucky.pdf
Matt Conway - Attorney - A Knowledgeable Professional - Kentucky.pdfMatt Conway - Attorney
 
Business Valuation Principles for Entrepreneurs
Business Valuation Principles for EntrepreneursBusiness Valuation Principles for Entrepreneurs
Business Valuation Principles for EntrepreneursBen Wann
 
The Inspiring Personality To Watch In 2024.pdf
The Inspiring Personality To Watch In 2024.pdfThe Inspiring Personality To Watch In 2024.pdf
The Inspiring Personality To Watch In 2024.pdfinsightssuccess2
 
Special Purpose Vehicle (Purpose, Formation & examples)
Special Purpose Vehicle (Purpose, Formation & examples)Special Purpose Vehicle (Purpose, Formation & examples)
Special Purpose Vehicle (Purpose, Formation & examples)linciy03
 
How to Maintain Healthy Life style.pptx
How to Maintain  Healthy Life style.pptxHow to Maintain  Healthy Life style.pptx
How to Maintain Healthy Life style.pptxrdishurana
 
Did Paul Haggis Ever Win an Oscar for Best Filmmaker
Did Paul Haggis Ever Win an Oscar for Best FilmmakerDid Paul Haggis Ever Win an Oscar for Best Filmmaker
Did Paul Haggis Ever Win an Oscar for Best Filmmakerstajohn447
 
Easy Way to Download and Set Up Gen TDS Software on Your Computer
Easy Way to Download and Set Up Gen TDS Software on Your ComputerEasy Way to Download and Set Up Gen TDS Software on Your Computer
Easy Way to Download and Set Up Gen TDS Software on Your ComputerSAG Infotech
 
Pitch Deck Teardown: RAW Dating App's $3M Angel deck
Pitch Deck Teardown: RAW Dating App's $3M Angel deckPitch Deck Teardown: RAW Dating App's $3M Angel deck
Pitch Deck Teardown: RAW Dating App's $3M Angel deckHajeJanKamps
 

Recently uploaded (20)

chapter 10 - excise tax of transfer and business taxation
chapter 10 - excise tax of transfer and business taxationchapter 10 - excise tax of transfer and business taxation
chapter 10 - excise tax of transfer and business taxation
 
Using Generative AI for Content Marketing
Using Generative AI for Content MarketingUsing Generative AI for Content Marketing
Using Generative AI for Content Marketing
 
Equinox Gold Corporate Deck May 24th 2024
Equinox Gold Corporate Deck May 24th 2024Equinox Gold Corporate Deck May 24th 2024
Equinox Gold Corporate Deck May 24th 2024
 
anas about venice for grade 6f about venice
anas about venice for grade 6f about veniceanas about venice for grade 6f about venice
anas about venice for grade 6f about venice
 
Lookback Analysis
Lookback AnalysisLookback Analysis
Lookback Analysis
 
USA classified ads posting – best classified sites in usa.pdf
USA classified ads posting – best classified sites in usa.pdfUSA classified ads posting – best classified sites in usa.pdf
USA classified ads posting – best classified sites in usa.pdf
 
Understanding UAE Labour Law: Key Points for Employers and Employees
Understanding UAE Labour Law: Key Points for Employers and EmployeesUnderstanding UAE Labour Law: Key Points for Employers and Employees
Understanding UAE Labour Law: Key Points for Employers and Employees
 
RMD24 | Debunking the non-endemic revenue myth Marvin Vacquier Droop | First ...
RMD24 | Debunking the non-endemic revenue myth Marvin Vacquier Droop | First ...RMD24 | Debunking the non-endemic revenue myth Marvin Vacquier Droop | First ...
RMD24 | Debunking the non-endemic revenue myth Marvin Vacquier Droop | First ...
 
falcon-invoice-discounting-a-premier-platform-for-investors-in-india
falcon-invoice-discounting-a-premier-platform-for-investors-in-indiafalcon-invoice-discounting-a-premier-platform-for-investors-in-india
falcon-invoice-discounting-a-premier-platform-for-investors-in-india
 
Falcon Invoice Discounting Setup for Small Businesses
Falcon Invoice Discounting Setup for Small BusinessesFalcon Invoice Discounting Setup for Small Businesses
Falcon Invoice Discounting Setup for Small Businesses
 
What are the main advantages of using HR recruiter services.pdf
What are the main advantages of using HR recruiter services.pdfWhat are the main advantages of using HR recruiter services.pdf
What are the main advantages of using HR recruiter services.pdf
 
Evolution and Growth of Supply chain.pdf
Evolution and Growth of Supply chain.pdfEvolution and Growth of Supply chain.pdf
Evolution and Growth of Supply chain.pdf
 
Matt Conway - Attorney - A Knowledgeable Professional - Kentucky.pdf
Matt Conway - Attorney - A Knowledgeable Professional - Kentucky.pdfMatt Conway - Attorney - A Knowledgeable Professional - Kentucky.pdf
Matt Conway - Attorney - A Knowledgeable Professional - Kentucky.pdf
 
Business Valuation Principles for Entrepreneurs
Business Valuation Principles for EntrepreneursBusiness Valuation Principles for Entrepreneurs
Business Valuation Principles for Entrepreneurs
 
The Inspiring Personality To Watch In 2024.pdf
The Inspiring Personality To Watch In 2024.pdfThe Inspiring Personality To Watch In 2024.pdf
The Inspiring Personality To Watch In 2024.pdf
 
Special Purpose Vehicle (Purpose, Formation & examples)
Special Purpose Vehicle (Purpose, Formation & examples)Special Purpose Vehicle (Purpose, Formation & examples)
Special Purpose Vehicle (Purpose, Formation & examples)
 
How to Maintain Healthy Life style.pptx
How to Maintain  Healthy Life style.pptxHow to Maintain  Healthy Life style.pptx
How to Maintain Healthy Life style.pptx
 
Did Paul Haggis Ever Win an Oscar for Best Filmmaker
Did Paul Haggis Ever Win an Oscar for Best FilmmakerDid Paul Haggis Ever Win an Oscar for Best Filmmaker
Did Paul Haggis Ever Win an Oscar for Best Filmmaker
 
Easy Way to Download and Set Up Gen TDS Software on Your Computer
Easy Way to Download and Set Up Gen TDS Software on Your ComputerEasy Way to Download and Set Up Gen TDS Software on Your Computer
Easy Way to Download and Set Up Gen TDS Software on Your Computer
 
Pitch Deck Teardown: RAW Dating App's $3M Angel deck
Pitch Deck Teardown: RAW Dating App's $3M Angel deckPitch Deck Teardown: RAW Dating App's $3M Angel deck
Pitch Deck Teardown: RAW Dating App's $3M Angel deck
 

How to make data-driven interactive PowerPoint presentations for operations

  • 1. Engaging your audience with Interactive PowerPoint decks Manage your operations with data- driven slides
  • 2. In an era of Business Intelligence, why are we talking about PowerPoint? 2 PowerPoint is actually the #1 data visualization platform in the world Self- service Part of workflow Offline access Better design Despite “self-service BI”, creating a dashboard in Tableau, Power BI, Qlik, Spotfire, Microstrategy, etc requires specialized expertise. But your secretary can create a PowerPoint presentation. Today, the standard process today is to take screenshots from Excel, BI dashboards, etc, stitch them into a story, and share them with users. This is the most common workflow in the world to share insights from data. Users can access the content offline, store it anywhere, forward it to anyone – even people who don’t have access to BI dashboards. The very things that IT departments fear – but users find convenient. For the author, it’s easier to design the story flow and visualization. Using shapes, images, and past slides, authors can quickly design content. Just as Excel was never replaced, PowerPoint won’t be replaced either.
  • 3. Today is not about WHAT story to tell. It’s about HOW to tell it engagingly 3 Listen on. You may discover something new. We won’t cover this Creating effective PowerPoint presentations and narrating interesting data stories are great topics. That’s not what this session is about. It’s not about storytelling, slide design, picking colors, picking charts, visualizations, maps, or presentation skills. (Gramener runs a data storytelling workshop that covers these. I’ll mention that at the end.) We will cover this Today is about one specific technique in PowerPoint: Interactive data-driven presentations. We’ll focus more on examples that people on operations (sales, marketing, manufacturing, finance, HR, IT – any kind of operations) will find useful. We’ll start with techniques. We’ll move on to use cases. I’ll share 3 simple tips to learn more.
  • 4. PowerPoint has five interaction capabilities 4 Let’s learn what these are Link Morph Plugin Animate Zoom No, let’s jump to the use cases
  • 5. Link to any slide when you click on a shape 5 This is the most common interaction in PowerPoint INTERACTIONS Click here to go to the first slide Click here to go to the last slide Click here to go to the previous slide Click here to go to the next slide You can jump to any slide (e.g. the 3rd slide) You can use any shape You can link images You can link to websites
  • 6. Practice Let’s create a link 6 Link the blue circle to the 3rd slide, and the orange circle to Gramener.com 3rd slide Gramener
  • 7. Animate shapes within a slide: show, hide or move 7 This is the 2nd most common interaction in PowerPoint INTERACTIONS This shape will disappear on click This shape will appear on click This shape will move to the right Click shape to spin the picture below Click shape to toggle picture below
  • 8. Practice Let’s animate 8 Create an animation that moves this rectangle down when the circle is clicked.
  • 9. Morph shapes smoothly from one slide to the next 9 INTERACTIONS Team A Team B Team C Team D Team performance Each of these shapes shows a team’s performance. They are sorted in alphabetical order.
  • 10. Team B Morph shapes smoothly from one slide to the next 10 You can morph shapes, text, pictures, even SmartArt INTERACTIONS Team A Team D Team C Now they are sorted in performance order. By smoothly animating, we can see the change in context. PowerPoint for Office 365 PowerPoint for Office 365 for Mac PowerPoint for the web PowerPoint 2019 PowerPoint 2019 for Mac PowerPoint for iPad PowerPoint for iPhone PowerPoint for Android tablets PowerPoint for Android phones PowerPoint Mobile Less Supported versions Team performance REFERENCE
  • 11. Practice Let’s morph 11 Create a copy of this slide. Smoothly move these shapes below to different positions.
  • 12. Zoom into any slide when you click on a shape 12 Zoom is available in Office 365 & PowerPoint 2019 INTERACTIONSREFERENCE Section Zoom You can zoom into one or more sections. These icons are live summaries of those slides. Slide Zoom You can zoom into any slide, just like links. These icons are live summaries of those slides. Go to Insert > Zoom. Select one of the Zoom options. Instructions
  • 13. Practice Let’s add a zoom 13 Add 2 Slide Zooms into any 2 slides
  • 14. Plugins can add more interaction capabilities 14 INTERACTIONS
  • 15. What can Dee, an Operations Manager, use these for? We’ll explore actual uses of interactive presentations 15Time check: 15 minutes
  • 16. Table of Contents lets users jump to relevant sections 16 Dee can visually show the document structure using links CONSULTING ABOUT PRODUCTS CASE STUDIES FINANCIAL SERVICES MEDIA PUBLIC SECTOR RETAIL & CONSUMER SPORTS EDUCATION SOCIETY JUST FUN HEALTHCARE MANUFACTURING TELECOMAGRICULTURE FINANCE HR IT & SM MARKETING DATA EXPLORER GRAMENER INTRODUCTION GRAMEX ANALYTICS NARRATIVES AUTOLYSIS DESIGN CLUSTER OFFERINGS This is a consolidation of all final Gramener slides. View in slideshow mode. Click on any link in slide-show mode to open the page. (Ctrl-Click in normal mode.) VISUALIZATION CLEANSING ADMINISTRATION ▼ ▼ ▼ ▼ ▼ ▼ ▼ PARTNERSHIPS ▼ SMART ALERTS AI / ML ▼ Gramener uses Links to create a table of contents for its 720-slide library of slides. This first page shows the document structure. Each box links to the relevant section. Some sections have case studies marked using a ▼ symbol. Clicking on the symbol directly jumps to the case study. Note: The actual links on this slide were deleted when anonymizing. The design was preserved.
  • 17. Maps & Layouts can be used as a way of navigation 17 Dee can use layouts to visually drill down into the deck The document or section structure doesn’t need to be textual. It can be a map or a layout. Click on a colored state for more details about that state. Colors add information (e.g. how the state is performing). Layouts of plants, offices, stores, data centers, etc can be used as layouts. Note: PowerPoint can import SVG files and ungroup them into native PowerPoint shapes.
  • 18. Quizzes help users learn by taking a point of view and changing it 18 Dee can create quizzes to improve learning & engagement A client once asked me: “How do you handle an audience that always says ‘I knew that already’?” I said, “I ask them beforehand: ‘What do you think the answer is?’” Pre-quizzes are a great way of priming learning. It nudges people into opinions, and change it in the face of data. Post-quizzes are a great way of validating learning. It helps people reinforce what they learned. Quizzes are fun & engaging, in general. DOWNLOAD THIS
  • 19. Progressive reveals build up charts and slides 19 Dee can narrate data stories progressively, step-by-step Shift Evening Morning Night Weekday Fri Mon Sat Sun Thu Tue Wed Product category FAH N70 RPP TDS ZDH Part shipment 20-40% 40-60% 60-80% <20% Full Recovery times are neutral during the evening and morning shifts (mornings are slightly worse), night times are the best. Recovery times are worst on Fridays, and best on Saturdays & Wednesdays. Specifically, Friday mornings are particularly bad. So are Thursday mornings. The FAH product category has the best recovery time, while ZDH is much worse. However, RPP on Sundays is unusually slow. Part shipped products tend to perform worse than full-shipments. Specifically the <20% and 40-60% part-shipments. This is especially problematic for ZDH Complex content is confusing at first. By building up the content step-by-step, you can help the presenters show only what’s required, and move on when the audience has understood. For example, in charts, start with the axes, then elements, then the rest. For complex charts, explain parts of the chart one by one.
  • 20. Doodling animations are now part of PowerPoint’s capabilities 20 Dee can make text, pictures & charts far more eye-catching The Office “Draw” feature now has a new animation option called “Ink Replay”. This lets you draw by hand, and then animate it, to create a hand-drawn effect. This is a very engaging form of animation that requires nothing more than PowerPoint, and perhaps a touch screen or tablet. REFERENCE
  • 21. Morphs show change will retaining context in the story 21 Let’s say we want to explain the how each of the Western states is performing and show it in the context of the map. It’s unlikely that users will remember the shape of the state – e.g. that this state is Utah.
  • 22. Morphs show change will retaining context in the story 22 Dee can help users see change while retaining context Let’s say we want to explain the how each of the Western states is performing and show it in the context of the map. It’s unlikely that users will remember the shape of the state – e.g. that this state is Utah. But if we smoothly morph the shapes, retaining the context, this becomes much easier.
  • 23. Morphs can even rotate 3D objects 23 This airline maker wants to explain to their client what the impact of heavy particle damage on the left wing of this aircraft. Typically, these are represented as images with annotations. Left wing faced heavy particle damage during the flight
  • 24. Morphs can even rotate 3D objects 24 This increased the erosion under the left wing, leading to higher resistance. This airline maker wants to explain to their client what the impact of heavy particle damage on the left wing of this aircraft. Typically, these are represented as images with annotations. But with the emergence of 3D models and PowerPoint’s ability to morph them, we can retain context and explain with more clarity. Dee can explain events from multiple perspectives
  • 25. Bar chart races show how things have improved or worsened with time 25 Dee can show who’s knocking whom out in the top 10 race Bar chart races are a recent, very popular, and highly engaging form of animated visuals. This can be used to show the top performing customers, regions, plants, business units, or any other entity – and their performance across time. Who is beating whom, who’s entered the league tables, and who’s been bested by who – these are questions a bar chart race answers very clearly. These can be created with PowerPoint morph transitions. DOWNLOAD THIS
  • 26. Sand dance shows how people, clients & resources are distributed 26 Dee can use sand dance to explain data distribution Geographic Distribution Offering Type Industry Business Unit Deal Stages AustraliaUnited States 60 36 8 China 11 India Sand dances are another recent, popular, and engaging animated visual form. Each icon represents one unit – person, client, project, equipment, etc. They are grouped together in a certain way but can be re-grouped in other ways. As they are re-grouped, each unit moves into the new group. Audience sees what’s going where visually. These can be created with PowerPoint morph transitions.
  • 27. Sand dance shows how people, clients & resources are distributed 27 Dee can use sand dance to explain data distribution Offering Type Industry Business Unit Deal Stages Routing ELA Site Survey Network Security Staffing Solution Vendor Technical Services Resale Switching Performance Optimization Geographic Distribution Sand dances are another recent, popular, and engaging animated visual form. Each icon represents one unit – person, client, project, equipment, etc. They are grouped together in a certain way but can be re-grouped in other ways. As they are re-grouped, each unit moves into the new group. Audience sees what’s going where visually. These can be created with PowerPoint morph transitions.
  • 28. Sand dance shows how people, clients & resources are distributed 28 Dee can use sand dance to explain data distribution Automotive Financial Services Manufacturing Retail & Wholesale Geographic Distribution Offering Type Industry Business Unit Deal Stages Sand dances are another recent, popular, and engaging animated visual form. Each icon represents one unit – person, client, project, equipment, etc. They are grouped together in a certain way but can be re-grouped in other ways. As they are re-grouped, each unit moves into the new group. Audience sees what’s going where visually. These can be created with PowerPoint morph transitions.
  • 29. Drilldown Sunbursts compare performance across segments 29 Dee can allow presenters to chart their own path The Sales Operations team of a consumer goods company needed an interactive presentation to run their board discussion. The Head of Sales usually presented the performance across channels. But the discussion rarely went in the way it was scripted. To allow the audience to participate in the discussion, this interactive drilldown lets the presenter pick the path they want to go along. DOWNLOAD THIS
  • 30. Drilldown Treemaps explain where performance is falling 30 Dee can let users pick areas they want to explore This is a product performance scatter plot. Each circle is a product. The X-axis is the market share. The Y-axis is the growth rate. The size of the circle represents sales. Click on the circle to expand it and see the performance of the underlying countries in Asia. DOWNLOAD THIS
  • 31. Drilldown Flows explain why performance is falling 31 Dee can guide users to find reasons on their own This is a product performance scatter plot. Each circle is a product. The X-axis is the market share. The Y-axis is the growth rate. The size of the circle represents sales. Click on the circle to expand it and see the performance of the underlying countries in Asia. DOWNLOAD THIS
  • 32. Growth Rate ShareValue Market Share: 22% MarketGrowth:9.4% -40% -30% -20% -10% 0% 10% 20% 30% 40% +0% +5% +10% +15% +20% +25% +30% +35% +40% KRD Share: 23% KRDGrowth:8% KRD VSP Share: 26% VSPGrowth:8% VSP RPT Share: 23% RPTGrowth:16% RPT HVG Share: 17% HVGGrowth:5% HVG MDC Share: 19% MDCGrowth:10% MDC C&C Share: 29% C&CGrowth:14% C&C Others B2B Share: 4% B2BGrowth:41% B2B Drilldown Motion Charts explain how sub-groups are performing Dee can allow users to drill into each group’s performance This is a product performance scatter plot. Each circle is a product. The X-axis is the market share. The Y-axis is the growth rate. The size of the circle represents sales. Click on the circle to expand it and see the performance of the underlying countries in Asia. DOWNLOAD THIS
  • 33. What can you do next? 33Time check: 35 minutes
  • 34. What can you do next 34 LEARN PRACTICE TEACH We learn the most when we teach. Share what you learn with your friends & teams. Organize sessions, show your work, see their work, and learn together. We learn by doing, not by reading or listening. Try the practices in this deck. Try the new features you learn about. Revise your last PPT and practice it on your next one. PowerPoint has many new features. Go through every item in the PowerPoint ribbon. You’ll find something you didn’t know about before – every time. (I do.)
  • 35. How can Gramener help you 35 If you had to pick only one of these, what would you pick? Gramener runs “Data Storytelling” workshops This has a 1-day and a 5-day version that covers • Understanding your audience & intent • Finding insights • Creating the storyline • Visual design, annotations, and more We run this for corporates and colleges. If you’re interested, we will contact you with details. Gramener has a PowerPoint plugin for interaction It helps create advanced interactive visualizations like • Bar chart races • Sand dance • Motion chart • Drilldown flows, treemaps, sunbursts, and more We are launching a beta version of this in March 2020. If you’re interested, we will keep you informed.
  • 36. Would you like me to reach out to you for either of these? 36
  • 38. Q&A