The document presents a comprehensive overview of chemical kinetics, detailing factors that influence reaction rates, including concentration, temperature, and the presence of catalysts. It covers various rate laws, reaction mechanisms, and models for adsorption kinetics, providing mathematical expressions and graphical representations for understanding reaction behavior. Additionally, the introduction of pseudo order reactions and various diffusion models further illustrates the complexities of chemical kinetics in real-world applications.


![CONTINUED .......
Slide 5
Δ[A]
Δt
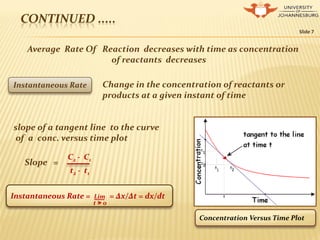
Rate = Change in concentration of A
change in time
Conc. A2 – Conc. A1
t2 - t1
= - = -
Δ[B]
Δt
Rate = Change in concentration of B
change in time
Conc. B2 – Conc. B1
t2 - t1
= =
Rate = = ................................ for simpler reactions
The ( - ve ) sign is used because the concentration of A is decreasing.
Δ[A]
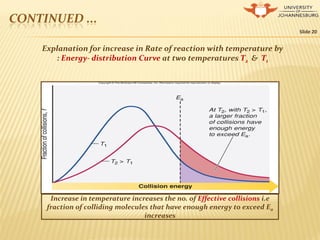
Δt
Δ[B]
Δt
Rate with respect to A
Rate with respect to B](https://image.slidesharecdn.com/chemicalkinetics-presentation-150214034801-conversion-gate02/85/Chemical-kinetics-presentation-5-320.jpg)
![CONTINUED .....
Slide 6
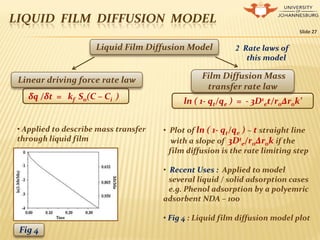
For complex Reactions
where a, b, c,.....e, f, g,.... are stoichiometric coefficients in the balanced
Chemical equation & A, B , C ,..... E, F, G, .... are Chemical Species
At const. V .....
mol L-1 s-1 for gaseous reactants & products ,
conc. is usually expressed as partial pressures ,
so R is atm s-1
1
a
∆[A]
∆ t
1
b
∆[B]
∆ t
Rate = - = -
1
e
∆[E]
∆ t
=
1
f
∆[F]
∆ t
=
aA + bB + cC + ......... eE + fF + gG + ..........
Unit Of Rate](https://image.slidesharecdn.com/chemicalkinetics-presentation-150214034801-conversion-gate02/85/Chemical-kinetics-presentation-6-320.jpg)


![CONCENTRATION & RATE
Slide
A General reaction occurring at a const T
Acc. to the Law Of Mass Action Rate Of Reaction α [ A ]a [ B ]b
: expresses the relation between rate of reaction & concentration
of reactants
k is Rate Constant & is a function of T & P ( P dependence is small & usually
ignored )
Reaction has an individual Order with respect to each reactant
Reaction order wrt A = m & wrt B = n ; Overall Order of the reaction = m + n
aA + bB cC + dD
Rate Law
Rate = k [A]m [B]n
Slide 12](https://image.slidesharecdn.com/chemicalkinetics-presentation-150214034801-conversion-gate02/85/Chemical-kinetics-presentation-12-320.jpg)
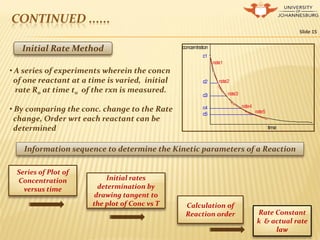
![CONTINUED ......
Slide 13
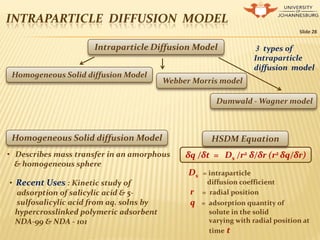
[A] versus Time plot for 0, 1st & 2nd order rxns Rate versus [A] plot for 0, 1st , 2nd order rxns
Reaction Order
“n”
Rate variation with
Conc.
Differential Rate
Law
Integrated Rate
Law
1
Rate doubles when
[A] doubles Rate = k [A]1 ln [A]t /[A]o = -kt
2
Rate quadruples
as [A] doubles Rate = k [A]2 1/[ A]t = kt + 1/[A]0
0
Rate does not
change with [A] Rate = k [A]0 [A]t - [A]0 = - kt
A Products](https://image.slidesharecdn.com/chemicalkinetics-presentation-150214034801-conversion-gate02/85/Chemical-kinetics-presentation-13-320.jpg)
![CONTINUED ......
Slide 14
2NO(g) + 2H2(g) N2(g) + 2H2O(g)
Rate Law : k[NO]2[H2] Order of reaction = 3
1st Order wrt [H2 ]
2nd Order wrt [ NO]
Stoichiometric coefficient of [H2] = 2
Order with respect to [H2] = 1
Reaction orders must be determined from experimental data and cannot be
deduced from the balanced equation
Method for determining
Order of reaction
Half Life
Method
Powell Plot
Method
Isolation
Method
Initial Rate
Method](https://image.slidesharecdn.com/chemicalkinetics-presentation-150214034801-conversion-gate02/85/Chemical-kinetics-presentation-14-320.jpg)

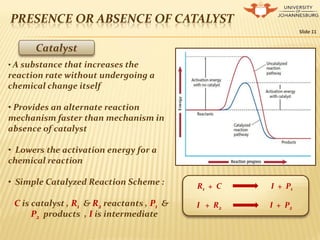
![MOLECULARITY
Slide 17
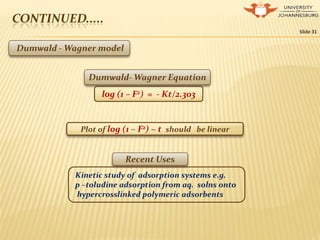
Number of colliding molecular entities that are involved in a single reaction step
Molecularity
Unimolecular TermolecularBimolecular
Molecularity ExamplesRate lawElementary Step
Unimolecular
Bimolecular
Termolecular
A Products
A + A Products
A + B Products
A + A + A Products
A + A + B Products
A + B + C Products
rate=k [A]
rate=k[A]2
rate=k [A][B]
rate=k[A][B]rate=k[A][B]
rate=k[A]3
rate=k [A]2 [B]
rate = k [A][B][C]
N2O4(g)→2NO2(g)
2NOCl→2NO(g)+CO2(g)
CO(g)+NO3(g)→NO2(g)+CO2(g)
2NO(g)+O2(g)→2NO2(g)
H+O2(g)+M→HO2(g)+M](https://image.slidesharecdn.com/chemicalkinetics-presentation-150214034801-conversion-gate02/85/Chemical-kinetics-presentation-17-320.jpg)
![CONTINUED ......
Slide 18
Molecularity
• Number of reacting species which
collide to result in reaction
• Only positive integral values e.g 1,2,3
& never –ve
• Theoretical concept & value is derived
from mechanism of reaction
• Sum of powers to which concentrations
are raised in the rate law expression
• Zero, fractional or even be -ve
• Experimental fact & derived from rate
law
Slowest step of a
chemical reaction
that determines the
speed (rate) at
which the overall
reaction proceeds
Rate
Determining
Step
Eg : A complex reaction
NO2(g)+CO(g)→NO(g)+CO2(g)
occur in two elementary steps :
NO2+NO2→NO+NO3 (slow) rate const k1
NO3+CO→NO2+CO2 (fast) rate const k2
Rate= k1 [NO2][NO2] = k1 [NO2]2
Order](https://image.slidesharecdn.com/chemicalkinetics-presentation-150214034801-conversion-gate02/85/Chemical-kinetics-presentation-18-320.jpg)


![PSEUDO ORDER REACTIONS
Slide 22
An order of a chemical reaction that appears to be less than the true order
due to experimental conditions ; when one reactant is in large excess
Pseudo Order Reactions
Pseudo Second Order
Reactions
Pseudo First Order
Reactions
2nd Order kinetics can be approximated as 1st
Order under certain experimental condition
3rd Order kinetics can be approximated as 2nd
Order under certain experimental condition
Pseudo first order kinetics
2nd order rate law = k [A] [B]
• Reduces to Pseudo first order if
either [A] or [B] is in large excess
• Pseudo first order rate law = k’ [B]
where k’ = k [A] ...... Pseudo first
order rate constant
Pseudo Second order kinetics
3rd order rate law = k [A]2 [B]
• Reduces to Pseudo first order , if [A] is
in excess Pseudo second order if [B]
is in excess
• Pseudo Second order rate law = k’ [A]2
where k’ = k [B] ...... Pseudo second
order rate constant](https://image.slidesharecdn.com/chemicalkinetics-presentation-150214034801-conversion-gate02/85/Chemical-kinetics-presentation-22-320.jpg)

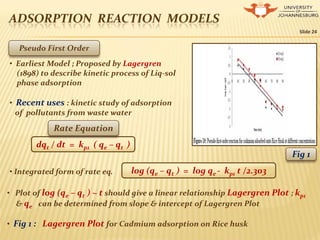
![ADSORPTION REACTION MODELS
Slide 25
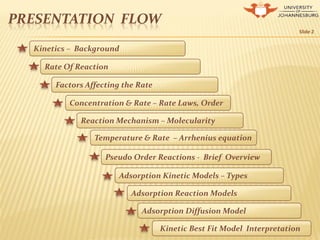
Pseudo Second Order
• Proposed by Ho (1995)
• To describe kinetic process of adsorption
of divalent metal ions on Peat
• Recent Uses : Kinetic study of adsorption
process of divalent metal ions, dyes ,
organic substances from aq. solns
d (P)t / dt = kp2 [(P)0 - (P)t]2Rate Equation
t/ qt = 1/ kp2 q2
e + 1/ qe t• Integrated form of rate eq.
• Plot of t/ qt ~ t should give a linear relationship with a slope of 1/ qe &
intercept of 1/ kp2 q2
e
• Fig 2 : Pseudo second order plot for Pb2+ ions onto NSSCAC at diff concs.
Fig 2](https://image.slidesharecdn.com/chemicalkinetics-presentation-150214034801-conversion-gate02/85/Chemical-kinetics-presentation-25-320.jpg)