Downloaded 107 times

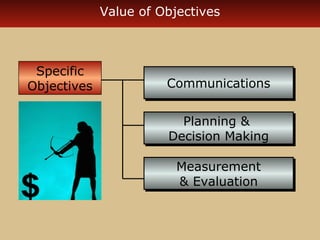
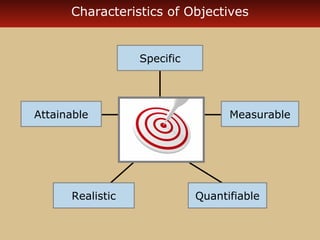

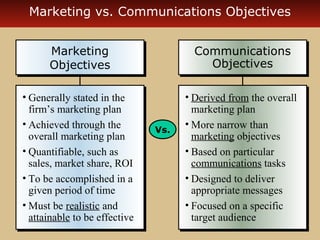
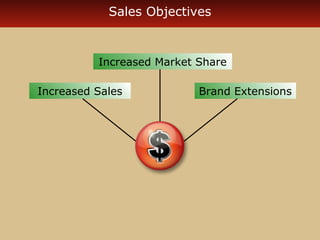
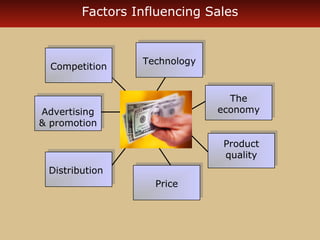

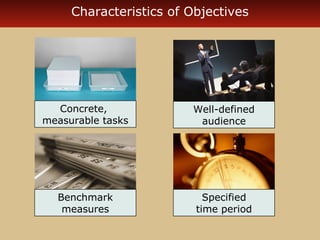


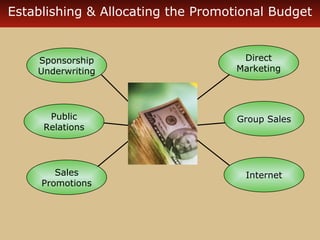
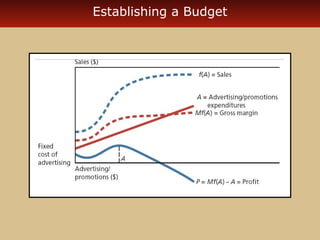
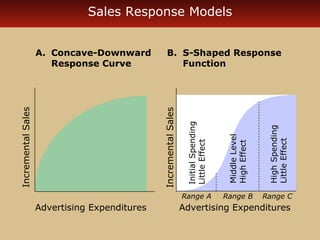
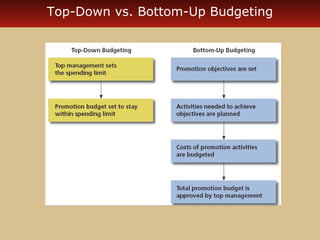
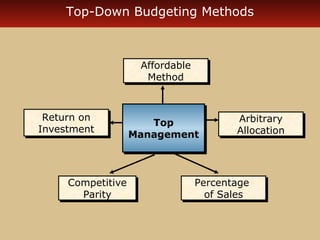
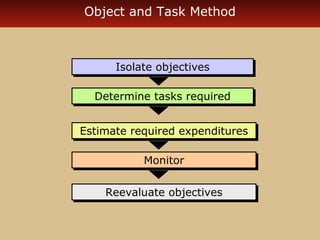


This document discusses establishing objectives and budgeting for promotional programs. It provides information on characteristics of effective objectives including being specific, measurable, attainable and realistic. It also discusses the differences between marketing, communications and sales objectives. Additionally, it covers factors to consider when establishing a promotional budget, such as sales response models and top-down versus bottom-up budgeting approaches. Methods for allocating budgets to different integrated marketing communications elements are also presented.


![ITFT Media - Advertisement ppt [read only]](https://cdn.slidesharecdn.com/ss_thumbnails/advertisementpptread-only-140426012933-phpapp02-thumbnail.jpg?width=640&height=640&fit=bounds)


