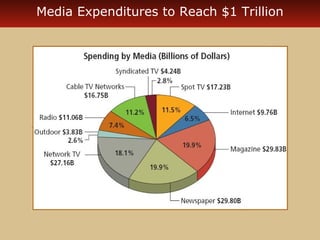
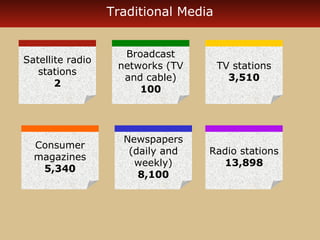
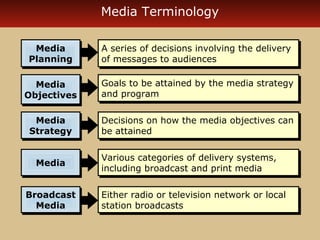
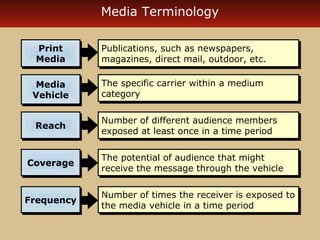
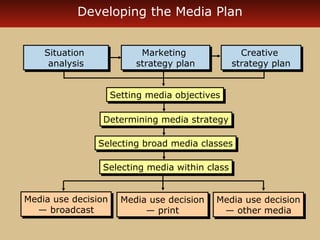
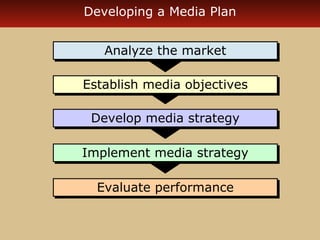
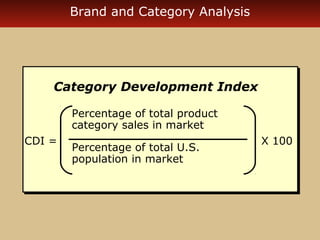
Media Planning and Strategy 
1 
0 
McGraw-Hill/Irwin Copyright Š 2009 by The McGraw-Hill Companies, Inc. All rights reserved.
Media Expenditures to Reach $1 Trillion
Traditional Media 
Satellite radio 
stations 
2 
Broadcast 
networks (TV 
and cable) 
100 
TV stations 
3,510 
Consumer 
magazines 
5,340 
Newspapers 
(daily and 
weekly) 
8,100 
Radio stations 
13,898
Media Terminology 
A series of decisions involving the delivery 
of messages to audiences 
A series of decisions involving the delivery 
of messages to audiences 
Media 
Planning 
Media 
Planning 
Goals to be attained by the media strategy 
and program 
Goals to be attained by the media strategy 
and program 
Media 
Media 
Objectives 
Objectives 
Decisions on how the media objectives can 
be attained 
Decisions on how the media objectives can 
be attained 
Media 
Strategy 
Media 
Strategy 
Various categories of delivery systems, 
including MMeeddiiaa broadcast and print media 
Various categories of delivery systems, 
including broadcast and print media 
Either radio or television network or local 
station broadcasts 
Either radio or television network or local 
station broadcasts 
Broadcast 
Media 
Broadcast 
Media
Media Terminology 
Publications, such as newspapers, 
magazines, direct mail, outdoor, etc. 
Publications, such as newspapers, 
magazines, direct mail, outdoor, etc. 
Print 
Media 
Print 
Media 
The specific carrier within a medium 
category 
The specific carrier within a medium 
category 
Media 
Vehicle 
Media 
Vehicle 
Number of different audience members 
exposed RReeaacchh at least once in a time period 
Number of different audience members 
exposed at least once in a time period 
The potential of audience that might 
receive the message through the vehicle 
CCoovveerraaggee receive the message through the vehicle 
Number of times the receiver is exposed to 
the media vehicle in a time period 
FFrreeqquueennccyy the media vehicle in a time period
Developing the Media Plan 
Marketing 
strategy plan 
SSeettttiinngg mmeeddiiaa oobbjjeeccttiivveess 
DDeetteerrmmiinniinngg mmeeddiiaa ssttrraatteeggyy 
Creative 
strategy plan 
SSeelleeccttiinngg bbrrooaadd mmeeddiiaa ccllaasssseess 
Selecting Selecting mmeeddiiaa wwiitthhiinn ccllaassss 
Media use decision 
Media use decision 
— print 
— print 
Situation 
analysis 
Media use decision 
Media use decision 
— broadcast 
— broadcast 
Media use decision 
— other media 
Media use decision 
— other media 
Marketing 
strategy plan 
Situation 
analysis 
Creative 
strategy plan
Media Planning Difficulties 
Measurement 
Measurement 
Problems 
Problems 
Lack of 
Information 
Lack of 
Information 
Inconsistent 
Inconsistent 
Terms 
Terms 
Time 
Pressure 
Time 
Pressure 
Problems 
in Media 
Planning 
Problems 
in Media 
Planning
Developing a Media Plan 
AAnnaallyyzzee tthhee mmaarrkkeett 
EEssttaabblliisshh mmeeddiiaa oobbjjeeccttiivveess 
DDeevveelloopp mmeeddiiaa ssttrraatteeggyy 
IImmpplleemmeenntt mmeeddiiaa ssttrraatteeggyy 
EEvvaalluuaattee ppeerrffoorrmmaannccee
Analyzing Market Potential 
Index Number 
Percentage of users 
in a demographic segment 
Percentage of population 
Index = X 100 
in the same segment
Brand and Category Analysis 
Brand Development Index 
Percentage of brand to total 
U.S. sales in market 
Percentage of total U.S. 
population in market 
BDI = X 100
Brand and Category Analysis 
Category Development Index 
Percentage of total product 
category sales in market 
Percentage of total U.S. 
population in market 
CDI = X 100
Test Your Knowledge 
In calculating both the brand development index 
(BDI) and the category development index (CDI), a 
media planner obtains the following results: Low BDI 
and High CDI. What do these results imply? 
A) High market share; good market potential 
B) Low market share; good market potential 
C) High market share; monitor for sales decline 
D) Low market share; poor market potential
Brand and Category Analysis 
High market share 
Good market 
potential 
High market share 
Good market 
potential 
Low CDI High CDI 
High BDI 
Low BDI 
Low market share 
Good market 
potential 
Low market share 
Good market 
potential 
High market share 
Monitor for sales 
decline 
High market share 
Monitor for sales 
decline 
Low market share 
Poor market 
potential 
Low market share 
Poor market 
potential
Brand and Category Analysis 
The market usually 
represents good sales 
potential for both the 
product and the brand. 
The market usually 
represents good sales 
potential for both the 
product and the brand. 
Low CDI High CDI 
High BDI 
Low BDI 
The product category 
shows high potential but 
the brand isn’t doing well; 
the reason should be 
determined. 
The product category 
shows high potential but 
the brand isn’t doing well; 
the reason should be 
determined. 
The category isn’t selling 
well but the brand is; 
may be a good market in 
which to advertise but 
should be monitored for 
sales decline. 
The category isn’t selling 
well but the brand is; 
may be a good market in 
which to advertise but 
should be monitored for 
sales decline. 
Both the product category 
and the brand are doing 
poorly; not likely to be a 
good place to advertise. 
Both the product category 
and the brand are doing 
poorly; not likely to be a 
good place to advertise.
Target Audience Coverage 
Population excluding target market 
Target market 
Media coverage 
Media overexposure 
Target 
Market 
Proportion 
Full 
Market 
Coverage 
Partial 
Market 
Coverage 
Coverage 
Exceeding 
Market
Geographic Coverage
Three Scheduling Methods 
Continuity 
Pulsing 
Flighting 
Jan Feb Mar Apr May Jun Jul Aug Sep Oct Nov Dec
Reach and Frequency 
A. Reach of One Program B. Reach of Two Programs 
C. Duplicated Reach of Both D. Unduplicated Reach of Both
Graph of Effective Reach
Marketing Factors Determining Frequency 
Target 
Group 
Target 
Group 
Brand 
History 
Brand 
History 
Brand 
Loyalty 
Marketing 
Factors 
Share of 
Voice 
Share of 
Voice 
Usage 
Cycle 
Purchase 
Cycles 
Purchase 
Cycles 
Brand 
Loyalty 
Brand 
Share 
Brand 
Share 
Usage 
Cycle 
Marketing 
Factors
Message Factors Determining Frequency 
MMeessssaaggee CCoommpplleexxiittyy 
MMeessssaaggee UUnniiqquueenneessss 
NNeeww VVss.. CCoonnttiinnuuiinngg CCaammppaaiiggnnss 
IImmaaggee VVeerrssuuss PPrroodduucctt SSeellll 
MMeessssaaggee VVaarriiaattiioonn 
WWeeaarroouutt 
AAddvveerrttiissiinngg UUnniittss 
Message 
or Creative 
Factors 
Message 
or Creative 
Factors
Media Factors Determining Frequency 
CClluutttteerr 
Number of 
Media Used 
Number of 
Media Used 
Repeat 
Exposure 
Repeat 
Exposure 
Editorial 
Environment 
Editorial 
Environment 
SScchheedduulliinngg 
AAtttteennttiivveenneessss 
Media 
Factors
Flexibility in Media Planning Strategies 
Market 
Market 
opportunities MMaarrkkeett tthhrreeaattss 
opportunities 
Availability of 
Availability of 
media 
media 
Changes in 
media or media 
Changes in 
media or media 
vehicle 
vehicle 
FFlleexxiibbiilliittyy
Test Your Knowledge 
Why should an effective media strategy be flexible? 
A) Due to the potential development of new 
advertising media 
B) Due to an alteration of a competitor's 
media schedule 
C) Due to the unavailability of the desired 
medium 
D) Due to a drop in the ratings of a show 
previously on the media schedule 
E) Due to all of the above
Determining Relative Cost of Print Media 
Cost per thousand (CPM) 
Cost of ad space 
(absolute cost) 
Circulation 
CPM = X 1,000
Calculating CPM Based on Target Audience
Determining Relative Cost of Broadcast Media 
Cost per rating point (CPRP) 
CPRP = 
Cost of commercial time 
Program rating
Evaluation and Follow-Up 
How well did these strategies achieve 
the media objectives? 
How well did the media plan contribute 
to attaining the overall marketing and 
communications objectives? 
Use again, or analyze flaws
Television Pros and Cons 
AAddvvaannttaaggeess 
MMaassss ccoovveerraaggee 
HHiigghh rreeaacchh 
SSiigghhtt,, ssoouunndd,, mmoottiioonn 
HHiigghh pprreessttiiggee 
LLooww ccoosstt ppeerr eexxppoossuurree 
AAtttteennttiioonn ggeettttiinngg 
FFaavvoorraabbllee iimmaaggee 
DDiissaaddvvaannttaaggeess 
LLooww sseelleeccttiivviittyy 
SShhoorrtt mmeessssaaggee lliiffee 
HHiigghh aabbssoolluuttee ccoosstt 
HHiigghh pprroodduuccttiioonn ccoosstt 
CClluutttteerr
Radio Pros and Cons 
AAddvvaannttaaggeess 
LLooccaall ccoovveerraaggee 
LLooww ccoosstt 
HHiigghh ffrreeqquueennccyy 
FFlleexxiibbllee 
LLooww pprroodduuccttiioonn ccoosstt 
WWeellll--sseeggmmeenntteedd aauuddiieennccee 
DDiissaaddvvaannttaaggeess 
AAuuddiioo oonnllyy 
CClluutttteerr 
LLooww aatttteennttiioonn ggeettttiinngg 
FFlleeeettiinngg mmeessssaaggee
Magazine Pros and Cons 
AAddvvaannttaaggeess 
SSeeggmmeennttaattiioonn ppootteennttiiaall 
QQuuaalliittyy rreepprroodduuccttiioonn 
HHiigghh iinnffoorrmmaattiioonn ccoonntteenntt 
LLoonnggeevviittyy 
MMuullttiippllee rreeaaddeerrss 
DDiissaaddvvaannttaaggeess 
Long lead time for 
Long lead time for 
ad placement 
ad placement 
VViissuuaall oonnllyy 
LLaacckk ooff fflleexxiibbiilliittyy
Newspaper Pros and Cons 
AAddvvaannttaaggeess 
HHiigghh ccoovveerraaggee 
LLooww ccoosstt 
Short lead time for 
Short lead time for 
placing ads 
placing ads 
Ads Ads can can be be placed placed in 
in 
interest interest sections 
sections 
TTiimmeellyy ((ccuurrrreenntt aaddss)) 
RReeaaddeerr ccoonnttrroollss eexxppoossuurree 
CCaann bbee uusseedd ffoorr ccoouuppoonnss 
DDiissaaddvvaannttaaggeess 
SShhoorrtt lliiffee 
CClluutttteerr 
LLooww aatttteennttiioonn ggeettttiinngg 
PPoooorr rreepprroodduuccttiioonn qquuaalliittyy 
SSeelleeccttiivvee rreeaaddeerr eexxppoossuurree
Outdoor Pros and Cons 
AAddvvaannttaaggeess 
LLooccaattiioonn ssppeecciiffiicc 
HHiigghh rreeppeettiittiioonn 
EEaassiillyy nnoottiicceedd 
DDiissaaddvvaannttaaggeess 
SShhoorrtt eexxppoossuurree ttiimmee 
SShhoorrtt aaddss 
PPoooorr iimmaaggee 
LLooccaall rreessttrriiccttiioonnss
Direct Mail Pros and Cons 
AAddvvaannttaaggeess 
HHiigghh sseelleeccttiivviittyy 
RReeaaddeerr ccoonnttrroollss eexxppoossuurree 
HHiigghh iinnffoorrmmaattiioonn ccoonntteenntt 
Repeat exposure 
opportunities 
Repeat exposure 
opportunities 
DDiissaaddvvaannttaaggeess 
HHiigghh ccoosstt ppeerr ccoonnttaacctt 
PPoooorr iimmaaggee ((jjuunnkk mmaaiill)) 
CClluutttteerr
Internet Pros and Cons 
AAddvvaannttaaggeess 
User selects product 
information 
information 
User attention and 
User attention and 
involvement 
involvement 
IInntteerraaccttiivvee rreellaattiioonnsshhiipp 
DDiirreecctt sseelllliinngg ppootteennttiiaall 
FFlleexxiibbllee mmeessssaaggee ppllaattffoorrmm 
DDiissaaddvvaannttaaggeess 
Limited creative 
Limited creative 
capability 
capability 
WWeebbssnnaarrll 
TTeecchhnnoollooggyy lliimmiittaattiioonnss 
Few measurement 
Few measurement 
techniques 
techniques 
LLiimmiitteedd rreeaacchh

Chapter10

  • 1.
    Media Planning andStrategy 1 0 McGraw-Hill/Irwin Copyright Š 2009 by The McGraw-Hill Companies, Inc. All rights reserved.
  • 2.
    Media Expenditures toReach $1 Trillion
  • 3.
    Traditional Media Satelliteradio stations 2 Broadcast networks (TV and cable) 100 TV stations 3,510 Consumer magazines 5,340 Newspapers (daily and weekly) 8,100 Radio stations 13,898
  • 4.
    Media Terminology Aseries of decisions involving the delivery of messages to audiences A series of decisions involving the delivery of messages to audiences Media Planning Media Planning Goals to be attained by the media strategy and program Goals to be attained by the media strategy and program Media Media Objectives Objectives Decisions on how the media objectives can be attained Decisions on how the media objectives can be attained Media Strategy Media Strategy Various categories of delivery systems, including MMeeddiiaa broadcast and print media Various categories of delivery systems, including broadcast and print media Either radio or television network or local station broadcasts Either radio or television network or local station broadcasts Broadcast Media Broadcast Media
  • 5.
    Media Terminology Publications,such as newspapers, magazines, direct mail, outdoor, etc. Publications, such as newspapers, magazines, direct mail, outdoor, etc. Print Media Print Media The specific carrier within a medium category The specific carrier within a medium category Media Vehicle Media Vehicle Number of different audience members exposed RReeaacchh at least once in a time period Number of different audience members exposed at least once in a time period The potential of audience that might The potential of audience that might receive the message through the vehicle CCoovveerraaggee receive the message through the vehicle Number of times the receiver is exposed to Number of times the receiver is exposed to the media vehicle in a time period FFrreeqquueennccyy the media vehicle in a time period
  • 6.
    Developing the MediaPlan Marketing strategy plan SSeettttiinngg mmeeddiiaa oobbjjeeccttiivveess DDeetteerrmmiinniinngg mmeeddiiaa ssttrraatteeggyy Creative strategy plan SSeelleeccttiinngg bbrrooaadd mmeeddiiaa ccllaasssseess Selecting Selecting mmeeddiiaa wwiitthhiinn ccllaassss Media use decision Media use decision — print — print Situation analysis Media use decision Media use decision — broadcast — broadcast Media use decision — other media Media use decision — other media Marketing strategy plan Situation analysis Creative strategy plan
  • 7.
    Media Planning Difficulties Measurement Measurement Problems Problems Lack of Information Lack of Information Inconsistent Inconsistent Terms Terms Time Pressure Time Pressure Problems in Media Planning Problems in Media Planning
  • 8.
    Developing a MediaPlan AAnnaallyyzzee tthhee mmaarrkkeett EEssttaabblliisshh mmeeddiiaa oobbjjeeccttiivveess DDeevveelloopp mmeeddiiaa ssttrraatteeggyy IImmpplleemmeenntt mmeeddiiaa ssttrraatteeggyy EEvvaalluuaattee ppeerrffoorrmmaannccee
  • 9.
    Analyzing Market Potential Index Number Percentage of users in a demographic segment Percentage of population Index = X 100 in the same segment
  • 10.
    Brand and CategoryAnalysis Brand Development Index Percentage of brand to total U.S. sales in market Percentage of total U.S. population in market BDI = X 100
  • 11.
    Brand and CategoryAnalysis Category Development Index Percentage of total product category sales in market Percentage of total U.S. population in market CDI = X 100
  • 12.
    Test Your Knowledge In calculating both the brand development index (BDI) and the category development index (CDI), a media planner obtains the following results: Low BDI and High CDI. What do these results imply? A) High market share; good market potential B) Low market share; good market potential C) High market share; monitor for sales decline D) Low market share; poor market potential
  • 13.
    Brand and CategoryAnalysis High market share Good market potential High market share Good market potential Low CDI High CDI High BDI Low BDI Low market share Good market potential Low market share Good market potential High market share Monitor for sales decline High market share Monitor for sales decline Low market share Poor market potential Low market share Poor market potential
  • 14.
    Brand and CategoryAnalysis The market usually represents good sales potential for both the product and the brand. The market usually represents good sales potential for both the product and the brand. Low CDI High CDI High BDI Low BDI The product category shows high potential but the brand isn’t doing well; the reason should be determined. The product category shows high potential but the brand isn’t doing well; the reason should be determined. The category isn’t selling well but the brand is; may be a good market in which to advertise but should be monitored for sales decline. The category isn’t selling well but the brand is; may be a good market in which to advertise but should be monitored for sales decline. Both the product category and the brand are doing poorly; not likely to be a good place to advertise. Both the product category and the brand are doing poorly; not likely to be a good place to advertise.
  • 15.
    Target Audience Coverage Population excluding target market Target market Media coverage Media overexposure Target Market Proportion Full Market Coverage Partial Market Coverage Coverage Exceeding Market
  • 16.
  • 17.
    Three Scheduling Methods Continuity Pulsing Flighting Jan Feb Mar Apr May Jun Jul Aug Sep Oct Nov Dec
  • 18.
    Reach and Frequency A. Reach of One Program B. Reach of Two Programs C. Duplicated Reach of Both D. Unduplicated Reach of Both
  • 19.
  • 20.
    Marketing Factors DeterminingFrequency Target Group Target Group Brand History Brand History Brand Loyalty Marketing Factors Share of Voice Share of Voice Usage Cycle Purchase Cycles Purchase Cycles Brand Loyalty Brand Share Brand Share Usage Cycle Marketing Factors
  • 21.
    Message Factors DeterminingFrequency MMeessssaaggee CCoommpplleexxiittyy MMeessssaaggee UUnniiqquueenneessss NNeeww VVss.. CCoonnttiinnuuiinngg CCaammppaaiiggnnss IImmaaggee VVeerrssuuss PPrroodduucctt SSeellll MMeessssaaggee VVaarriiaattiioonn WWeeaarroouutt AAddvveerrttiissiinngg UUnniittss Message or Creative Factors Message or Creative Factors
  • 22.
    Media Factors DeterminingFrequency CClluutttteerr Number of Media Used Number of Media Used Repeat Exposure Repeat Exposure Editorial Environment Editorial Environment SScchheedduulliinngg AAtttteennttiivveenneessss Media Factors
  • 23.
    Flexibility in MediaPlanning Strategies Market Market opportunities MMaarrkkeett tthhrreeaattss opportunities Availability of Availability of media media Changes in media or media Changes in media or media vehicle vehicle FFlleexxiibbiilliittyy
  • 24.
    Test Your Knowledge Why should an effective media strategy be flexible? A) Due to the potential development of new advertising media B) Due to an alteration of a competitor's media schedule C) Due to the unavailability of the desired medium D) Due to a drop in the ratings of a show previously on the media schedule E) Due to all of the above
  • 25.
    Determining Relative Costof Print Media Cost per thousand (CPM) Cost of ad space (absolute cost) Circulation CPM = X 1,000
  • 26.
    Calculating CPM Basedon Target Audience
  • 27.
    Determining Relative Costof Broadcast Media Cost per rating point (CPRP) CPRP = Cost of commercial time Program rating
  • 28.
    Evaluation and Follow-Up How well did these strategies achieve the media objectives? How well did the media plan contribute to attaining the overall marketing and communications objectives? Use again, or analyze flaws
  • 29.
    Television Pros andCons AAddvvaannttaaggeess MMaassss ccoovveerraaggee HHiigghh rreeaacchh SSiigghhtt,, ssoouunndd,, mmoottiioonn HHiigghh pprreessttiiggee LLooww ccoosstt ppeerr eexxppoossuurree AAtttteennttiioonn ggeettttiinngg FFaavvoorraabbllee iimmaaggee DDiissaaddvvaannttaaggeess LLooww sseelleeccttiivviittyy SShhoorrtt mmeessssaaggee lliiffee HHiigghh aabbssoolluuttee ccoosstt HHiigghh pprroodduuccttiioonn ccoosstt CClluutttteerr
  • 30.
    Radio Pros andCons AAddvvaannttaaggeess LLooccaall ccoovveerraaggee LLooww ccoosstt HHiigghh ffrreeqquueennccyy FFlleexxiibbllee LLooww pprroodduuccttiioonn ccoosstt WWeellll--sseeggmmeenntteedd aauuddiieennccee DDiissaaddvvaannttaaggeess AAuuddiioo oonnllyy CClluutttteerr LLooww aatttteennttiioonn ggeettttiinngg FFlleeeettiinngg mmeessssaaggee
  • 31.
    Magazine Pros andCons AAddvvaannttaaggeess SSeeggmmeennttaattiioonn ppootteennttiiaall QQuuaalliittyy rreepprroodduuccttiioonn HHiigghh iinnffoorrmmaattiioonn ccoonntteenntt LLoonnggeevviittyy MMuullttiippllee rreeaaddeerrss DDiissaaddvvaannttaaggeess Long lead time for Long lead time for ad placement ad placement VViissuuaall oonnllyy LLaacckk ooff fflleexxiibbiilliittyy
  • 32.
    Newspaper Pros andCons AAddvvaannttaaggeess HHiigghh ccoovveerraaggee LLooww ccoosstt Short lead time for Short lead time for placing ads placing ads Ads Ads can can be be placed placed in in interest interest sections sections TTiimmeellyy ((ccuurrrreenntt aaddss)) RReeaaddeerr ccoonnttrroollss eexxppoossuurree CCaann bbee uusseedd ffoorr ccoouuppoonnss DDiissaaddvvaannttaaggeess SShhoorrtt lliiffee CClluutttteerr LLooww aatttteennttiioonn ggeettttiinngg PPoooorr rreepprroodduuccttiioonn qquuaalliittyy SSeelleeccttiivvee rreeaaddeerr eexxppoossuurree
  • 33.
    Outdoor Pros andCons AAddvvaannttaaggeess LLooccaattiioonn ssppeecciiffiicc HHiigghh rreeppeettiittiioonn EEaassiillyy nnoottiicceedd DDiissaaddvvaannttaaggeess SShhoorrtt eexxppoossuurree ttiimmee SShhoorrtt aaddss PPoooorr iimmaaggee LLooccaall rreessttrriiccttiioonnss
  • 34.
    Direct Mail Prosand Cons AAddvvaannttaaggeess HHiigghh sseelleeccttiivviittyy RReeaaddeerr ccoonnttrroollss eexxppoossuurree HHiigghh iinnffoorrmmaattiioonn ccoonntteenntt Repeat exposure opportunities Repeat exposure opportunities DDiissaaddvvaannttaaggeess HHiigghh ccoosstt ppeerr ccoonnttaacctt PPoooorr iimmaaggee ((jjuunnkk mmaaiill)) CClluutttteerr
  • 35.
    Internet Pros andCons AAddvvaannttaaggeess User selects product User selects product information information User attention and User attention and involvement involvement IInntteerraaccttiivvee rreellaattiioonnsshhiipp DDiirreecctt sseelllliinngg ppootteennttiiaall FFlleexxiibbllee mmeessssaaggee ppllaattffoorrmm DDiissaaddvvaannttaaggeess Limited creative Limited creative capability capability WWeebbssnnaarrll TTeecchhnnoollooggyy lliimmiittaattiioonnss Few measurement Few measurement techniques techniques LLiimmiitteedd rreeaacchh

Editor's Notes

  • #3 Relation to textThis slide relates to the material on pp. 315-316. Summary OverviewA report from the “Communications Industry Forecast” predicts that in the year 2008, over $1 trillion will be spent in communications media to reach consumers… in the United States alone. Advertisers now define media as traditional or new. Traditional media includes television, radio, newspapers, magazines, and so on. “New” media includes such things as satellite radio, the Internet, ads on movie screens, wireless, and so on. Expenditures on all types of advertising will grow, but “new” media will receive the lion’s share of that growth. The bottom line is that the media environment is changing in a way never seen before. New media, new technologies that enhance existing media, and new media forms are rapidly changing the media landscape. Use of this slideUse this slide to point out how the billions of media dollars are currently being spent, and how these expenditures are likely to shift in the future, as new forms of media gain popularity and emerge.
  • #4 Relation to textThis slide relates to the material on pp. 316-317 and Figure 10-1 in the text. Summary OverviewThe media planning process is not easy. Options include those shown on this slide, plus out-of-the-home media, such as outdoor advertising, transit advertising, and electronic billboards. A variety of other media must also be considered, including direct marketing, the Internet, promotional products, sales promotions, and in-store point-of-purchase options. A proliferation of new media includes branded entertainment, wireless, and interactive media. Use of this slideThis slide can be used during a discussion of the many forms of media and media selection. Each form of media has advantages and disadvantages, depending on the message that the advertiser is trying to convey and the product or service being offered.
  • #5 Relation to textThis slide relates to the material on pp. 317-319 of the text. Summary OverviewThis slide shows some of the various terms used in media planning and strategy. Use of this slideThis slide can be used to introduce and provide a brief overview of the basic terms and concepts of media planning and strategy.
  • #6 Relation to textThis slide relates to the material on pp. 317-319 of the text. Summary OverviewThis slide shows some of the various terms used in media planning and strategy. Use of this slideThis slide can be used to introduce and provide a brief overview of the basic terms and concepts of media planning and strategy.
  • #7 Relation to textThis slide relates to material on p. 319 and Figure 10-3 of the text. Summary OverviewThe media plan determines the best way to get the advertiser’s message to the market. The basic goal is to find that combination of media that enables the marketer to communicate the message in the most effective manner to the largest number of potential customers at the lowest cost. The various steps and activities involved in developing the media plan are presented on this slide. Use of this slideThis slide can be used to introduce and provide an overview of the activities involved in developing a media plan. More detailed discussion of these activities will follow.
  • #8 Relation to textThis slide relates to material on pp. 319-321 of the text. Summary OverviewThis slide shows some of the problems that contribute to the difficulty of developing the media plan and thus may reduce its effectiveness. These problems include: Measurement problems occur frequently and only estimates are available Lack of information about markets and media; not measured or too costly Inconsistent terminology usually arises from confusion or lack of standard measurements Time pressures results in decisions being made without proper planning and analysis Use of this slideThis slide can be used to discuss some of the problems associated with media planning that can make planning difficult or diminish its effectiveness. Although these problems complicate the media decision process, they do not render it an entirely subjective exercise.
  • #9 Relation to textThis slide relates to material on pp. 321-332 and Figure 10-4 of the text. Summary OverviewThis slide shows the five steps of the media planning process. They are: Analyze the market Establish media objectives Develop media strategy Implement the strategy Evaluate performance Use of this slideThis slide can be used to introduce and briefly explain the various steps involved in the media planning process.
  • #10 Relation to textThis slide relates to the material on pp. 323-325 of the text. Summary OverviewKey questions to be answered in the market analysis stage are (1) To whom shall we advertise? (2) What internal and external factors are at work? (3) Where should we focus our promotion efforts? There are several indices available to marketers to assist in answering these questions. The index number, using the ratio of the following variables, is considered a good indicator of market potential: Percentage of users in a demographic segment Percentage of population in the same segment An index number over 100 means use of the product is proportionately greater in that segment than in one that is average (100) or less than 100. Use of this slideThis slide can be used to the discuss the value of raw numbers provided by such firms as the Simmons Market Research Bureau and Mediamark Research Inc. versus percentage figures and index numbers.
  • #11 Relation to textThis slide relates to the material on pp. 326-328 and Figures 10-10 of the text. Summary OverviewThe Brand Development Index (BDI), shown on this slide, helps marketers determine where to allocate the media budget. The index uses the ratio of the following variables: Percentage of the brand to total U.S. sales in a given market Percentage of total U.S. population in the given market By performing the mathematical calculations shown on the slide, the advertiser would be able to determine the sales potential for the brand in a particular market area.The higher the BDI number, the greater the potential that exists. Use of this slideThis slide can be used to explain the Brand Development Index. This index helps marketers factor the rate of product usage by geographic area into the decision of where to allocate their media budget.
  • #12 Relation to textThis slide relates to material on pp. 326-328 and Figure 10-11 of the text. Summary OverviewThis slide shows the Category Development Index (CDI), which is another index that can help marketers determine where to allocate the media budget. It is computed in a manner similar to the BDI index, except that it uses information regarding the overall product category, rather than for specific brands. This index uses the ratio of the following variables: Percentage of the total product category sales in a given market Percentage of total U.S. population in the given market By performing the mathematical calculation shown on the slide, the advertiser can determine the potential for development of the total product category in a given area. When this information is combined with the BDI, a much more insightful promotional strategy may be developed. Beginning with the CDI, the marketer can first look at how well the product category does in a specific market area. Then a brand analysis would follow to see how well the brand is doing relative to its competitors. Together this information provides a clearer picture of where to allocate the media budget. Use of this slideThis slide can be used to explain the Category Development Index.
  • #13 Ans: B
  • #14 Relation to textThis slide relates to material on pp. 326-328 and Figure 10-12 of the text. Summary OverviewThis slide summarizes the use of the BDI and CDI indices as they relate to market potential and market share. As the chart shows, high BDI and CDI means there is greater market share and greater market potential. The lower these two indices are, the lower the market potential. Knowing this information helps marketers decide where their ad dollars should be spent to achieve the desired outcome. Use of this slideThis slide can be used to further explain the use of the BDI and CDI indices. The following slide provides more detail regarding the implications of these indices.
  • #15 Relation to textThis slide relates to material on pp. 326-328 and Figure 10-12 of the text. Summary OverviewThis slide provides further insight into some of the inferences based on BDI and CDI data for a given geographic area. Some inferences regarding the market potential for the brand and the category are: High BDI/High CDI – good sales potential for brand and product category Low BDI/High CDI – category has high potential, but brand isn’t doing well; determine why High BDI/Low CDI – category is not doing well, but brand is; may be a good market in which to advertise Low BDI/Low CDI – both category and brand are not doing well, not a good market in which to advertise Use of slideThis slide can be used to further explain the use of the BDI and CDI data. Knowing this information helps marketers decide where their advertising dollars should be spent to achieve the most impact.
  • #16 Relation to textThis slide relates to material on pp. 329-330 of the text and Figure 10-14. Summary OverviewDeveloping media strategies involves matching the coverage of the media vehicles to the target market. The chart on this slide shows the market coverage possibilities. Chart 1 – shows the target market as a proportion of the total population. Chart 2 – full coverage of the target market; optimal goal Chart 3 – partial coverage, leaving some customers without exposure Chart 4 – media coverage exceeds target audience; some coverage may be wasted The goal of the media planner is to extend media coverage to as many of the members of the target audience as possible, while minimizing the amount of excess or wasted coverage. Use of this slideThis slide can be used to show the various target market coverage scenarios.
  • #17 Relation to textThis slide relates to material on page 330 of the text. Summary OverviewSnow skiing is more popular in some parts of the country than in others. It would not be wise to promote skis in areas of low interest, unless the goal is to increase interest. And while it may be possible to promote an interest in skiing in Texas, a notable increase in sales is not likely, given the market’s distance from snow. Use of this slideUse this slide to point out that weighting certain geographic area more than others may make sense, depending on the product or service being marketed and the goal of the advertising campaign.
  • #18 Relation to textThis material relates to material on pp. 330-331 and Figure 10-16 of the text. Summary OverviewThe primary objective of media scheduling is to time advertising efforts so that they will coincide with the highest potential buying periods. This slide shows the three scheduling methods available to the media planner: Continuity – continuous pattern of advertising; every day, every week, or every month Flighting – intermittent periods of advertising and no advertising Pulsing – combination of the first two; continuity is maintained but at certain periods advertising is increased. Use of this slideThis slide can be used to explain the various scheduling options available to the advertiser. The optimal scheduling schedule can be affected by buying cycles. A continuity schedule can be appropriate with food products, household products and products consumed on an ongoing basis. A flighting schedule is well suited to seasonal or other products that are consumed mostly during certain time periods. A pulsing schedule may be used for products that have little sales variation from period to period, but might see some increase in certain times, such as cold beverages in the hot summer months.
  • #19 Relation to textThis slide relates to material on pp. 332-334 and Figure 10-19 of the text. Summary Overview Because advertisers have budget constraints, they are forced to make trade-offs between reach and frequency. They must decide if they want the message seen and heard by more people (reach) or by fewer people more often (frequency). This slide shows the various concepts associate with reach and frequency. Reach of One Program – total audience reached by one program Reach of Two Programs – total audience reached by two programs (including duplicated reach) Duplicated Reach of Both – duplicated reach only (those that were exposed more than once) Unduplicated Reach of Both – total reach less duplication (exposed only once) Use of this slide This slide can be used to introduce the concepts of reach and frequency and the terms duplicated reach and unduplicated reach. Both of these concepts are very important to the media planner. Unduplicated reach indicates potential new exposures, while duplicated reach provides an estimate of frequency. Most media schedules consider both reach and frequency.
  • #20 Relation to textThis slide relates to material on pp. 336-337 and Figure 10-22 of the text. Summary OverviewThis slide shows a graph of effective reach which represents the percentage of a vehicle’s audience reached at each effective frequency increment. Effective reach as shown on the shaded area of this graph is between 3 to 10 exposures (though decreasing with the number of exposures). Fewer than 3 exposures is considered inefficient reach, while more than 10 is considered overexposure and thus excessive reach. The exposure level is no guarantee of effective communication as different messages may require more or fewer exposures. Use of this slideThis slide can be used to explain the concept of effective reach and the fact that viewers may need to be exposed to a message more than once for successful communication to occur. This graph shows 3 exposures to be a minimum. However, recent literature suggests that in the current environment where consumers are exposed to thousands of daily communication messages, effective reach may now require a minimum of 12 messages. Additionally, the complexity of the message, message length, and recency of the exposure can also have an impact on effective reach.
  • #21 Relation to textThis slide relates to material on pp. 336-337 and Figure 10-23 of the text. Summary OverviewTo determine effective frequency there are numerous factors that need to be considered such as marketing factors, message and creative factors, and media factors. The marketing factors to be considered include: Brand loyalty – inverse relationship; the higher the loyalty the less frequency required Brand share – inverse relationship; the higher the share the less frequency required Usage cycle – products needing to be replaced frequently require higher frequency to maintain top-of-mind awareness Brand history – new brands require higher frequency Share of voice – when strong competition exists, higher frequency is required Purchase cycles – shorter purchasing cycles require higher frequency to maintain top-of-mind awareness Target group – the ability to learn and retain messages has an impact on frequency Use of this slideThis slide can be used to discuss the various marketing factors that affect the advertisers’ decisions regarding frequency levels needed to communicate effectively.
  • #22 Relation to textThis slide relates to material on pp. 336-337 and Figure 10-23 of the text. Summary OverviewTo determine effective frequency, many factors must be considered, including: Message complexity – the simpler the message the less frequency required Message uniqueness – the more unique the message the less frequency required New vs. continuing campaign – new campaigns require a higher frequency Image vs. product sell – creating an image requires a higher frequency Message variation – a single message requires less frequency Wearout – higher frequency leads to faster wearout Advertising units – larger units require less frequency Use of this slideThis slide can be used to discuss the various message factors that affect the advertisers’ decisions regarding frequency levels needed to communicate effectively.
  • #23 Relation to textThis slide relates to material on pp. 336-337 and Figure 10-23 of the text. Summary OverviewTo determine effective frequency there are many factors that need to be considered. The media factors that must be taken into consideration include: Clutter – more clutter requires higher frequency Repeat exposures – media that allow for more repeat exposures require less frequency Editorial environment – the more consistent the ad is with the editorial environment the less frequency required Number of media used – fewer media the lower the frequency required Attentiveness – the higher the level of attention achieved by the media, the less frequency required Scheduling – continuous scheduling requires less frequency Use of this slideThis slide can be used to discuss the various media factors that affect the advertisers’ decisions regarding frequency levels needed to communicate effectively.
  • #24 Relation to textThis slide relates to material on p. 339 of the text. Summary OverviewThis slide shows some areas where flexibility in a media strategy may be needed to avoid lost opportunities and address new threats. Market opportunities. Sometimes a market opportunity arises that the advertiser wishes to take advantage of. Market threats. Internal or external factors may pose a threat to the firm, and a change in media strategy is dictated. Availability of media. Sometimes a desired medium (or vehicle) is not available to the marketer. Changes in media or in media vehicles. A change in the medium or in a particular vehicle may require a change in the media strategy. Use of this slideThis slide can be used to discuss the importance of a flexible media strategy. Because of the rapidly changing market environment, strategies may need to be modified.
  • #25 Ans: E
  • #26 Relation to textThis slide relates to material on p. 340 of the text. Summary OverviewAn important decision in the development of the media strategy is estimating the relative cost of advertising in various media. The overall objective of the advertiser is to deliver the message to the target audience at the lowest rate with the least waste. This slide shows how the cost of print media is calculated. CPM refers to cost per thousand people reached and is calculated for print media such as magazines by dividing the cost of the ad space by the circulation and multiplying this amount by 1000. Use of this slideThis slide can be used to discuss how the relative cost of print media is calculated.
  • #27 Relation to textThis slide relates to material on pp. 340-344 and Figure 10-27 of the text, which discusses the relative cost of media. Summary OverviewThe cost per thousand may overestimate or underestimate the actual cost effectiveness. Consider a situation where some waste coverage is inevitable. The circulation exceeds the target market. If the people reached by this message are not potential buyers of the product, then having to pay to reach them results in too low a cost per thousand, as shown in Scenario A. We must use the potential reach to the target market – the destination sought – rather than the overall circulation figure. Use of this slideThis slide can be used to discuss that most media buyers rely on target CPM, or TCPM, which calculates CPMs based on the target audience, not the overall audience.
  • #28 Relation to textThis slide relates to material on pp. 340-342 of the text. Summary OverviewAn important decision in the development of the media strategy is estimating the relative cost of advertising in various media. The overall objective of the advertiser is to deliver the message to the target audience at the lowest cost. This slide shows how the cost of broadcast media is calculated using CPRP (often referred to as CPP) which refers to cost per rating point. A rating point represents 1 percent of all households in a particular area who are tuned into a specific program. Use of this slideThis slide can be used to demonstrate how the relative cost of broadcast media is calculated by using the cost per rating point formula.
  • #29 Relation to textThis slide relates to p. 342 of the text. Summary OverviewAll plans require some evaluation to assess their performance. The media plan is no exception. Any measure of effectiveness must consider the two factors shown on this slide. Although it is difficult to measure effectiveness, it is not impossible. Even a less-than-perfect evaluation procedure is better than no attempt at all. Use of this slideUse this slide when discussing the need to evaluation any and all media plans before using them again.
  • #30 Relation to textThis slide relates to material on p. 342 and Figure 10-28 of the text. Summary OverviewThis slide summarizes the various advantages and disadvantages of using television as a medium. Some of the more noteworthy advantages are the fact that it is a mass medium with high reach and it is provides a combination of sight, sound, and motion. The major disadvantages of TV as an advertising medium are that it has a high absolute cost, potentially high production costs for commercials, and has become very cluttered. Use of this slideThis slide can be used to provide a brief overview of the advantages and disadvantages of using television as an advertising medium. Chapter 11 provides a more complete evaluation of television as a medium.
  • #31 Relation to text This slide relates to material on pp. 342-343 and Figure 10-28 of the text. Summary OverviewThis slide summarizes the various advantages and disadvantages of using radio as a medium. Some of the more noteworthy advantages are the fact that radio has local coverage, is low cost, and may result in high frequency of exposures. The major disadvantages of radio advertising is that it has high clutter, low attention getting ability, and provides only an audio message. Use of this slideThis slide can be used to provide a brief overview of the advantages and disadvantages of using radio as an advertising medium. Chapter 11 provides a more complete evaluation of broadcast media including radio.
  • #32 Relation to text This slide relates to material on pp. 342-343 and Figure 10-28 of the text. Summary OverviewThis slide summarizes the various advantages and disadvantages of using magazines as an advertising medium. Some of the more noteworthy advantages of magazines as advertising media vehicles are the fact that they have good potential for segmentation, provide quality reproduction, and have longevity. The major disadvantages include having a long lead time, providing only a visual message, and inflexibility. Use of this slideThis slide can be used to provide a brief overview of the advantages and disadvantages of using magazines. Chapter 12 provides a more complete evaluation of print media including magazines.
  • #33 Relation to text This slide relates to material on pp. 342-343 and Figure 10-28 of the text. Summary OverviewThis slide summarizes the various advantages and disadvantages of using newspapers as a medium. Some of the more noteworthy advantages are the fact that they have good potential for high coverage, the cost is relatively low, and they have short lead times. The major disadvantages of newspapers are that they have a short reading life, high levels of advertising clutter, and may have low attention getting ability. Use of this slideThis slide can be used to provide a brief overview of the advantages and disadvantages of using newspapers as an advertising medium. Chapter 12 provides a more complete evaluation of newspapers.
  • #34 Relation to text This slide relates to material on pp. 342-343 and Figure 10-28 of the text. Summary OverviewThis slide summarizes the various advantages and disadvantages of using outdoor as an advertising medium. Some of the more noteworthy advantages are the fact that outdoor ads are location specific, easily noticed, and allow for high repetition. The major disadvantages are that outdoor has a short exposure time, can accommodate only short messages, and may have a poor image. Use of this slideThis slide can be used to provide a brief overview of the advantages and disadvantages of using outdoor advertising. Chapter 13 provides a more complete evaluation of outdoor media.
  • #35 Relation to textThis slide relates to material on pp. 342-343 and Figure 10-28 of the text. Summary OverviewThis slide summarizes the various advantages and disadvantages of using direct mail as a medium. Some of the more noteworthy advantages of direct mail are that it is highly selective, the reader controls the exposure, and a great deal of information can be provided. The major disadvantages of direct mail are high cost-per-exposure, clutter, and poor image. Use of this slideThis slide can be used to provide a brief overview of the advantages and disadvantages of using direct mail as an advertising medium. Chapter 14 provides a more complete evaluation of direct marketing.
  • #36 Relation to textThis slide relates to material on pp. 342-343 and Figure 10-28 of the text. Summary OverviewThis slide summarizes the various advantages and disadvantages of using the Internet as an advertising medium. Some of the advantages of the Internet are the fact the user selects the information, is usually attentive and involved, and the medium is interactive. The major disadvantages of the Internet are limited creative capabilities, web snarl, and a lack of valid measurement techniques. Use of this slideThis slide can be used to provide a brief overview of the advantages and disadvantages of using the Internet as an advertising medium. Chapter 15 provides a more complete evaluation of the Internet.