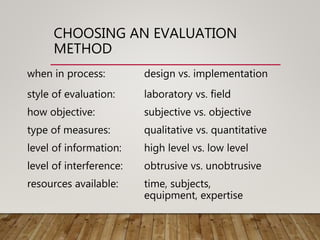
CHAPTER 8
EVALUATION
TECHNIQUES
EVALUATION TECHNIQUES
• Evaluation
• tests usability and functionality of system
• occurs in laboratory, field and/or in collaboration
with users
• evaluates both design and implementation
• should be considered at all stages in the design
life cycle
GOALS OF EVALUATION
• assess extent of system functionality
• assess effect of interface on user
• identify specific problems
EVALUATING DESIGNS
COGNITIVE WALKTHROUGH
HEURISTIC EVALUATION
REVIEW-BASED EVALUATION
COGNITIVE WALKTHROUGH
Proposed by Polson et al.
• evaluates design on how well it supports user in learning
task
• usually performed by expert in cognitive psychology
• expert ‘walks though’ design to identify potential
problems using psychological principles
• forms used to guide analysis
COGNITIVE WALKTHROUGH (CTD)
• For each task walkthrough considers
• what impact will interaction have on user?
• what cognitive processes are required?
• what learning problems may occur?
• Analysis focuses on goals and knowledge: does
the design lead the user to generate the correct
goals?
HEURISTIC EVALUATION
• Proposed by Nielsen and Molich.
• usability criteria (heuristics) are identified
• design examined by experts to see if these are violated
• Example heuristics
• system behaviour is predictable
• system behaviour is consistent
• feedback is provided
• Heuristic evaluation `debugs' design.
REVIEW-BASED EVALUATION
• Results from the literature used to support or refute
parts of design.
• Care needed to ensure results are transferable to new
design.
• Model-based evaluation
• Cognitive models used to filter design options
e.g. GOMS prediction of user performance.
• Design rationale can also provide useful evaluation
information
EVALUATING THROUGH USER
PARTICIPATION
LABORATORY STUDIES
• Advantages:
• specialist equipment available
• uninterrupted environment
• Disadvantages:
• lack of context
• difficult to observe several users cooperating
• Appropriate
• if system location is dangerous or impractical for
constrained single user systems to allow controlled
manipulation of use
FIELD STUDIES
• Advantages:
• natural environment
• context retained (though observation may alter it)
• longitudinal studies possible
• Disadvantages:
• distractions
• noise
• Appropriate
• where context is crucial for longitudinal studies
EVALUATING IMPLEMENTATIONS
REQUIRES AN ARTEFACT:
SIMULATION, PROTOTYPE,
FULL IMPLEMENTATION
EXPERIMENTAL EVALUATION
• controlled evaluation of specific aspects of interactive
behaviour
• evaluator chooses hypothesis to be tested
• a number of experimental conditions are considered
which differ only in the value of some controlled
variable.
• changes in behavioural measure are attributed to
different conditions
EXPERIMENTAL FACTORS
• Subjects
• who – representative, sufficient sample
• Variables
• things to modify and measure
• Hypothesis
• what you’d like to show
• Experimental design
• how you are going to do it
VARIABLES
• independent variable (IV)
characteristic changed to produce different
conditions
e.g. interface style, number of menu items
• dependent variable (DV)
characteristics measured in the experiment
e.g. time taken, number of errors.
HYPOTHESIS
• prediction of outcome
• framed in terms of IV and DV
e.g. “error rate will increase as font size decreases”
• null hypothesis:
• states no difference between conditions
• aim is to disprove this
e.g. null hyp. = “no change with font size”
EXPERIMENTAL DESIGN
• within groups design
• each subject performs experiment under each
condition.
• transfer of learning possible
• less costly and less likely to suffer from user
variation.
• between groups design
• each subject performs under only one
condition
• no transfer of learning
• more users required
• variation can bias results.
ANALYSIS OF DATA
• Before you start to do any statistics:
• look at data
• save original data
• Choice of statistical technique depends on
• type of data
• information required
• Type of data
• discrete - finite number of values
• continuous - any value
ANALYSIS - TYPES OF TEST
• parametric
• assume normal distribution
• robust
• powerful
• non-parametric
• do not assume normal distribution
• less powerful
• more reliable
• contingency table
• classify data by discrete attributes
• count number of data items in each group
ANALYSIS OF DATA (CONT.)
• What information is required?
• is there a difference?
• how big is the difference?
• how accurate is the estimate?
• Parametric and non-parametric tests mainly address
first of these
EXPERIMENTAL STUDIES ON
GROUPS
More difficult than single-user experiments
Problems with:
• subject groups
• choice of task
• data gathering
• analysis
SUBJECT GROUPS
larger number of subjects
 more expensive
longer time to `settle down’
… even more variation!
difficult to timetable
so … often only three or four groups
THE TASK
must encourage cooperation
perhaps involve multiple channels
options:
• creative task e.g. ‘write a short report on …’
• decision games e.g. desert survival task
• control task e.g. ARKola bottling plant
DATA GATHERING
several video cameras
+ direct logging of application
problems:
• synchronisation
• sheer volume!
one solution:
• record from each perspective
ANALYSIS
N.B. vast variation between groups
solutions:
• within groups experiments
• micro-analysis (e.g., gaps in speech)
• anecdotal and qualitative analysis
look at interactions between group and media
controlled experiments may `waste' resources!
FIELD STUDIES
Experiments dominated by group formation
Field studies more realistic:
distributed cognition  work studied in context
real action is situated action
physical and social environment both crucial
Contrast:
psychology – controlled experiment
sociology and anthropology – open study and rich data
OBSERVATIONAL METHODS
THINK ALOUD
COOPERATIVE EVALUATION
PROTOCOL ANALYSIS
AUTOMATED ANALYSIS
POST-TASK WALKTHROUGHS
THINK ALOUD
• user observed performing task
• user asked to describe what he is doing and why, what
he thinks is happening etc.
• Advantages
• simplicity - requires little expertise
• can provide useful insight
• can show how system is actually use
• Disadvantages
• subjective
• selective
• act of describing may alter task performance
COOPERATIVE EVALUATION
• variation on think aloud
• user collaborates in evaluation
• both user and evaluator can ask each other
questions throughout
• Additional advantages
• less constrained and easier to use
• user is encouraged to criticize system
• clarification possible
PROTOCOL ANALYSIS
• paper and pencil – cheap, limited to writing speed
• audio – good for think aloud, difficult to match with other
protocols
• video – accurate and realistic, needs special equipment,
obtrusive
• computer logging – automatic and unobtrusive, large
amounts of data difficult to analyze
• user notebooks – coarse and subjective, useful insights, good
for longitudinal studies
• Mixed use in practice.
• audio/video transcription difficult and requires skill.
• Some automatic support tools available
AUTOMATED ANALYSIS – EVA
• Workplace project
• Post task walkthrough
• user reacts on action after the event
• used to fill in intention
• Advantages
• analyst has time to focus on relevant incidents
• avoid excessive interruption of task
• Disadvantages
• lack of freshness
• may be post-hoc interpretation of events
POST-TASK WALKTHROUGHS
• transcript played back to participant for comment
• immediately  fresh in mind
• delayed  evaluator has time to identify questions
• useful to identify reasons for actions and alternatives
considered
• necessary in cases where think aloud is not possible
QUERY TECHNIQUES
INTERVIEWS
QUESTIONNAIRES
INTERVIEWS
• analyst questions user on one-to -one basis
usually based on prepared questions
• informal, subjective and relatively cheap
• Advantages
• can be varied to suit context
• issues can be explored more fully
• can elicit user views and identify unanticipated
problems
• Disadvantages
• very subjective
• time consuming
QUESTIONNAIRES
• Set of fixed questions given to users
• Advantages
• quick and reaches large user group
• can be analyzed more rigorously
• Disadvantages
• less flexible
• less probing
QUESTIONNAIRES (CTD)
• Need careful design
• what information is required?
• how are answers to be analyzed?
• Styles of question
• general
• open-ended
• scalar
• multi-choice
• ranked
PHYSIOLOGICAL METHODS
EYE TRACKING
PHYSIOLOGICAL MEASUREMENT
EYE TRACKING
• head or desk mounted equipment tracks the position of
the eye
• eye movement reflects the amount of cognitive
processing a display requires
• measurements include
• fixations: eye maintains stable position. Number and duration
indicate level of difficulty with display
• saccades: rapid eye movement from one point of interest to
another
• scan paths: moving straight to a target with a short fixation at
the target is optimal
PHYSIOLOGICAL MEASUREMENTS
• emotional response linked to physical changes
• these may help determine a user’s reaction to an
interface
• measurements include:
• heart activity, including blood pressure, volume and pulse.
• activity of sweat glands: Galvanic Skin Response (GSR)
• electrical activity in muscle: electromyogram (EMG)
• electrical activity in brain: electroencephalogram (EEG)
• some difficulty in interpreting these physiological
responses - more research needed
CHOOSING AN EVALUATION
METHOD
when in process: design vs. implementation
style of evaluation: laboratory vs. field
how objective: subjective vs. objective
type of measures: qualitative vs. quantitative
level of information: high level vs. low level
level of interference: obtrusive vs. unobtrusive
resources available: time, subjects,
equipment, expertise

Chapter 8 Evaluation Techniques

  • 1.
  • 2.
    EVALUATION TECHNIQUES • Evaluation •tests usability and functionality of system • occurs in laboratory, field and/or in collaboration with users • evaluates both design and implementation • should be considered at all stages in the design life cycle
  • 3.
    GOALS OF EVALUATION •assess extent of system functionality • assess effect of interface on user • identify specific problems
  • 4.
    EVALUATING DESIGNS COGNITIVE WALKTHROUGH HEURISTICEVALUATION REVIEW-BASED EVALUATION
  • 5.
    COGNITIVE WALKTHROUGH Proposed byPolson et al. • evaluates design on how well it supports user in learning task • usually performed by expert in cognitive psychology • expert ‘walks though’ design to identify potential problems using psychological principles • forms used to guide analysis
  • 6.
    COGNITIVE WALKTHROUGH (CTD) •For each task walkthrough considers • what impact will interaction have on user? • what cognitive processes are required? • what learning problems may occur? • Analysis focuses on goals and knowledge: does the design lead the user to generate the correct goals?
  • 7.
    HEURISTIC EVALUATION • Proposedby Nielsen and Molich. • usability criteria (heuristics) are identified • design examined by experts to see if these are violated • Example heuristics • system behaviour is predictable • system behaviour is consistent • feedback is provided • Heuristic evaluation `debugs' design.
  • 8.
    REVIEW-BASED EVALUATION • Resultsfrom the literature used to support or refute parts of design. • Care needed to ensure results are transferable to new design. • Model-based evaluation • Cognitive models used to filter design options e.g. GOMS prediction of user performance. • Design rationale can also provide useful evaluation information
  • 9.
  • 10.
    LABORATORY STUDIES • Advantages: •specialist equipment available • uninterrupted environment • Disadvantages: • lack of context • difficult to observe several users cooperating • Appropriate • if system location is dangerous or impractical for constrained single user systems to allow controlled manipulation of use
  • 11.
    FIELD STUDIES • Advantages: •natural environment • context retained (though observation may alter it) • longitudinal studies possible • Disadvantages: • distractions • noise • Appropriate • where context is crucial for longitudinal studies
  • 12.
    EVALUATING IMPLEMENTATIONS REQUIRES ANARTEFACT: SIMULATION, PROTOTYPE, FULL IMPLEMENTATION
  • 13.
    EXPERIMENTAL EVALUATION • controlledevaluation of specific aspects of interactive behaviour • evaluator chooses hypothesis to be tested • a number of experimental conditions are considered which differ only in the value of some controlled variable. • changes in behavioural measure are attributed to different conditions
  • 14.
    EXPERIMENTAL FACTORS • Subjects •who – representative, sufficient sample • Variables • things to modify and measure • Hypothesis • what you’d like to show • Experimental design • how you are going to do it
  • 15.
    VARIABLES • independent variable(IV) characteristic changed to produce different conditions e.g. interface style, number of menu items • dependent variable (DV) characteristics measured in the experiment e.g. time taken, number of errors.
  • 16.
    HYPOTHESIS • prediction ofoutcome • framed in terms of IV and DV e.g. “error rate will increase as font size decreases” • null hypothesis: • states no difference between conditions • aim is to disprove this e.g. null hyp. = “no change with font size”
  • 17.
    EXPERIMENTAL DESIGN • withingroups design • each subject performs experiment under each condition. • transfer of learning possible • less costly and less likely to suffer from user variation. • between groups design • each subject performs under only one condition • no transfer of learning • more users required • variation can bias results.
  • 18.
    ANALYSIS OF DATA •Before you start to do any statistics: • look at data • save original data • Choice of statistical technique depends on • type of data • information required • Type of data • discrete - finite number of values • continuous - any value
  • 19.
    ANALYSIS - TYPESOF TEST • parametric • assume normal distribution • robust • powerful • non-parametric • do not assume normal distribution • less powerful • more reliable • contingency table • classify data by discrete attributes • count number of data items in each group
  • 20.
    ANALYSIS OF DATA(CONT.) • What information is required? • is there a difference? • how big is the difference? • how accurate is the estimate? • Parametric and non-parametric tests mainly address first of these
  • 21.
    EXPERIMENTAL STUDIES ON GROUPS Moredifficult than single-user experiments Problems with: • subject groups • choice of task • data gathering • analysis
  • 22.
    SUBJECT GROUPS larger numberof subjects  more expensive longer time to `settle down’ … even more variation! difficult to timetable so … often only three or four groups
  • 23.
    THE TASK must encouragecooperation perhaps involve multiple channels options: • creative task e.g. ‘write a short report on …’ • decision games e.g. desert survival task • control task e.g. ARKola bottling plant
  • 24.
    DATA GATHERING several videocameras + direct logging of application problems: • synchronisation • sheer volume! one solution: • record from each perspective
  • 25.
    ANALYSIS N.B. vast variationbetween groups solutions: • within groups experiments • micro-analysis (e.g., gaps in speech) • anecdotal and qualitative analysis look at interactions between group and media controlled experiments may `waste' resources!
  • 26.
    FIELD STUDIES Experiments dominatedby group formation Field studies more realistic: distributed cognition  work studied in context real action is situated action physical and social environment both crucial Contrast: psychology – controlled experiment sociology and anthropology – open study and rich data
  • 27.
    OBSERVATIONAL METHODS THINK ALOUD COOPERATIVEEVALUATION PROTOCOL ANALYSIS AUTOMATED ANALYSIS POST-TASK WALKTHROUGHS
  • 28.
    THINK ALOUD • userobserved performing task • user asked to describe what he is doing and why, what he thinks is happening etc. • Advantages • simplicity - requires little expertise • can provide useful insight • can show how system is actually use • Disadvantages • subjective • selective • act of describing may alter task performance
  • 29.
    COOPERATIVE EVALUATION • variationon think aloud • user collaborates in evaluation • both user and evaluator can ask each other questions throughout • Additional advantages • less constrained and easier to use • user is encouraged to criticize system • clarification possible
  • 30.
    PROTOCOL ANALYSIS • paperand pencil – cheap, limited to writing speed • audio – good for think aloud, difficult to match with other protocols • video – accurate and realistic, needs special equipment, obtrusive • computer logging – automatic and unobtrusive, large amounts of data difficult to analyze • user notebooks – coarse and subjective, useful insights, good for longitudinal studies • Mixed use in practice. • audio/video transcription difficult and requires skill. • Some automatic support tools available
  • 31.
    AUTOMATED ANALYSIS –EVA • Workplace project • Post task walkthrough • user reacts on action after the event • used to fill in intention • Advantages • analyst has time to focus on relevant incidents • avoid excessive interruption of task • Disadvantages • lack of freshness • may be post-hoc interpretation of events
  • 32.
    POST-TASK WALKTHROUGHS • transcriptplayed back to participant for comment • immediately  fresh in mind • delayed  evaluator has time to identify questions • useful to identify reasons for actions and alternatives considered • necessary in cases where think aloud is not possible
  • 33.
  • 34.
    INTERVIEWS • analyst questionsuser on one-to -one basis usually based on prepared questions • informal, subjective and relatively cheap • Advantages • can be varied to suit context • issues can be explored more fully • can elicit user views and identify unanticipated problems • Disadvantages • very subjective • time consuming
  • 35.
    QUESTIONNAIRES • Set offixed questions given to users • Advantages • quick and reaches large user group • can be analyzed more rigorously • Disadvantages • less flexible • less probing
  • 36.
    QUESTIONNAIRES (CTD) • Needcareful design • what information is required? • how are answers to be analyzed? • Styles of question • general • open-ended • scalar • multi-choice • ranked
  • 37.
  • 38.
    EYE TRACKING • heador desk mounted equipment tracks the position of the eye • eye movement reflects the amount of cognitive processing a display requires • measurements include • fixations: eye maintains stable position. Number and duration indicate level of difficulty with display • saccades: rapid eye movement from one point of interest to another • scan paths: moving straight to a target with a short fixation at the target is optimal
  • 39.
    PHYSIOLOGICAL MEASUREMENTS • emotionalresponse linked to physical changes • these may help determine a user’s reaction to an interface • measurements include: • heart activity, including blood pressure, volume and pulse. • activity of sweat glands: Galvanic Skin Response (GSR) • electrical activity in muscle: electromyogram (EMG) • electrical activity in brain: electroencephalogram (EEG) • some difficulty in interpreting these physiological responses - more research needed
  • 40.
    CHOOSING AN EVALUATION METHOD whenin process: design vs. implementation style of evaluation: laboratory vs. field how objective: subjective vs. objective type of measures: qualitative vs. quantitative level of information: high level vs. low level level of interference: obtrusive vs. unobtrusive resources available: time, subjects, equipment, expertise